HMRC's annual report and accounts 2025 to 2026: Financial review
Published 9 July 2026

© Crown copyright 2026
This publication is licensed under the terms of the Open Government Licence v3.0 except where otherwise stated. To view this licence, visit nationalarchives.gov.uk/doc/open-government-licence/version/3 or write to the Information Policy Team, The National Archives, Kew, London TW9 4DU, or email: psi@nationalarchives.gov.uk.
Where we have identified any third party copyright information you will need to obtain permission from the copyright holders concerned.
This publication is available at https://www.gov.uk/government/publications/hmrc-annual-report-and-accounts-2025-to-2026/hmrcs-annual-report-and-accounts-2024-to-2025-financial-review
This financial review explains our funding, how we’ve used this to deliver against our strategic objectives and how we ensure we use public money responsibly.
“While HMRC’s core purpose remains to bring in the revenue that funds the UK’s public services and ensure the customs system supports the smooth flow of trade at the border, how we do this is changing. We are on a vitally important transformation journey, which is about creating a tax and customs system that is quicker and easier to interact with, and which meets the needs of a rapidly evolving world.
In 2025 to 2026 our expenditure of £7,427 million enabled us to continue delivering a whole host of exciting changes. We are designing and building the next generation of services that will improve the customer experience and strengthen the resilience and security of our systems.
I am incredibly proud of the expertise we have within HMRC and of all the hard work, energy and innovation that I see being applied across the organisation — whether that’s focused on closing the tax gap, improving day-to-day performance and the customer experience, or on the reform and modernisation of tax and customs administration.
We will continue to use the public funds entrusted to us responsibly and efficiently, as we make further progress towards our vision of being a trusted, modern tax and customs department.”
Justin Holliday
Chief Finance Officer
Budgetary framework
Being transparent about how we’ve spent public money is essential to maintaining and building public trust. HM Treasury sets the budgetary framework for government spending and within this, we are given our own Supply Estimate, which sets our proposed maximum spending and is voted on by Parliament at the start of the financial year.
Our total spend, which is known as Total Managed Expenditure (TME), in 2025 to 2026 was £33,300 million. This funding is subject to strict HM Treasury controls and consists of budgets voted by Parliament and budgets where appropriation is covered in other legislation (including the National Insurance Fund and other reliefs and allowances).
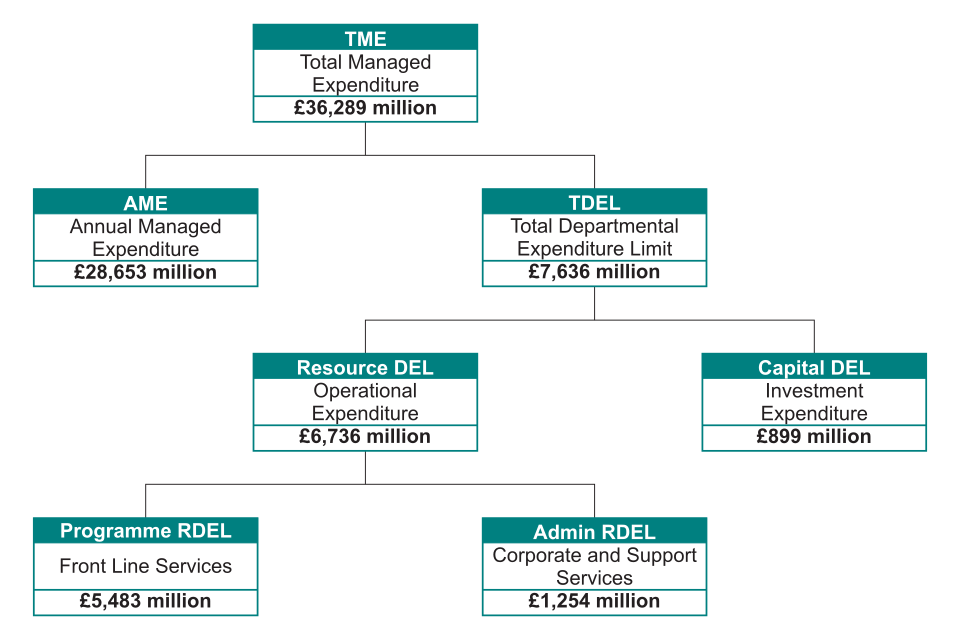
Figure 9 shows how TME is split into Total Departmental Expenditure Limit (TDEL) and Annually Managed Expenditure (AME) budgets, where TDEL sets our budget for controllable expenditure and AME covers our more flexible budgets for volatile or demand-led expenditure.
Within our TDEL budgets we have ringfences against some programmes where we receive budget which we can only spend on a specific policy measure. This is referred to as the HM Treasury policy ringfence. Resource Departmental Expenditure Limit (RDEL) includes day-to-day resource and administration costs, and Capital Departmental Expenditure Limit (CDEL) is our investment expenditure.
Figure 9: Our budgetary framework (note)
Note: Numbers may appear not to sum due to rounding.
Using our funding to deliver our priorities
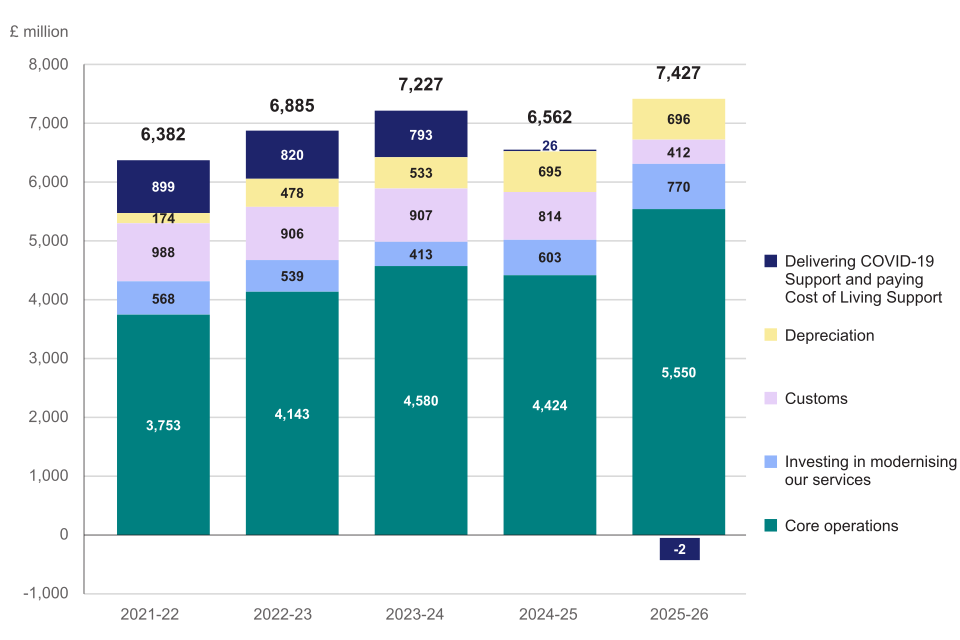
Table 3 and figure 10 show our spending pattern over the last 5 years split by spend type.
Table 3: 5-year trend on our spending (note)
| Expenditure | 2021-22 £ million | 2022-23 £ million | 2023-24 £ million | 2024-25 £ million | 2025-26 £ million |
|---|---|---|---|---|---|
| Resource DEL | 5,717 | 6,329 | 6,502 | 5,834 | 6,552 |
| Capital DEL | 665 | 556 | 725 | 728 | 876 |
| Total DEL | 6,382 | 6,885 | 7,227 | 6,562 | 7,427 |
Figure 10: 5-year trend on spending — Total DEL
Note: Numbers may appear not to sum due to rounding.
In 2025 to 2026 we spent £7,427 million total DEL, which included £5,550 million on our core operations, delivering the resources and systems we need to collect tax and deliver our strategic objectives. This supported delivery of £50.2 billion of compliance yield in 2025 to 2026 and helped improve the service our customers received.
Figure 10 shows the breakdown of our expenditure into some of our main spending streams. Over the last five years, our main spend has been on our core operations with sustained investment into modern systems and capabilities needed to run the tax and customs systems resiliently.
Spending has increased on work to modernise our IT infrastructure and increase resilience in our IT architecture. This is driven most notably by the delivery of high-quality digital services that enable us to become a digital-first organisation, support a shift in how we manage customer compliance, and reduce customer service costs over time. Expenditure has also increased so we can bring in new compliance and debt management staff, following investments made at Autumn Budget 2024 and Spring Statement 2025.
In 2025 to 2026 there was no DEL expenditure on delivering COVID-19 support, as residual work has wound down and any remaining activity is now a part of our day-to-day operations.
Figure 11 shows our RDEL expenditure in 2025 to 2026 split by spend type. Our cost base is largely fixed, especially in the short term, leaving limited areas for managing our spend outside of staff costs.
Figure 11: Total HMRC Group RDEL expenditure in 2025 to 2026 by spend type (notes 1 to 4)

Notes:
- Numbers may appear not to sum due to rounding.
- HMRC Group includes VOA figures.
- Other includes income.
- Total excludes the Cost of Living Payments.
Variances between budget and expenditure
Table 4: 2025 to 2026 Financial performance (note)
Due to the amount of data presented, only part of the table below is visible. Please use the scrollbar at the bottom of the table to view all the columns.
| Expenditure | Budget £ million | Expenditure £ million | Expenditure compared to Budget £ million | Underspend on ringfences £ million | Position excluding ringfence underspend £ million | Position excluding ringfence underspend % |
|---|---|---|---|---|---|---|
| Resource DEL | 6,736 | 6,552 | -185 | 159 | -25 | -0.4% |
| Capital DEL | 899 | 876 | -24 | 3 | -21 | -2.3% |
| Total DEL | 7,636 | 7,427 | -208 | 162 | -46 | -0.6% |
Note: Numbers may appear not to sum due to rounding.
Table 4 shows our financial performance in 2025 to 2026, where we underspent by £208 million, the equivalent of 2.7% of our TDEL budget. When excluding our budgets under HM Treasury policy ringfences (referenced in the Budgetary Framework section), we had an underspend of 0.6%.
Against our Resource DEL budget of £6,736 million, we underspent by £185 million. When excluding underspends in HM Treasury ringfenced budgets, the underspend was £25 million (0.4%). This underspend mainly reflects newly recruited compliance officers joining later in the year than planned. Despite this, recruitment levels remained ahead of plan by the end of the year.
Against our Capital DEL budget of £899 million, we underspent by £24 million. When excluding underspends in HM Treasury ringfenced budgets, the underspend was £21 million (2.3%). The underspend mainly reflects changes in the timing of project delivery with expenditure on several programmes moved from 2025 to 2026 into 2026 to 2027. These changes were driven by capacity constraints in early phases of delivery. Updated cost estimates also reduced the level of capital spend required in-year.
Trends in Annually Managed Expenditure
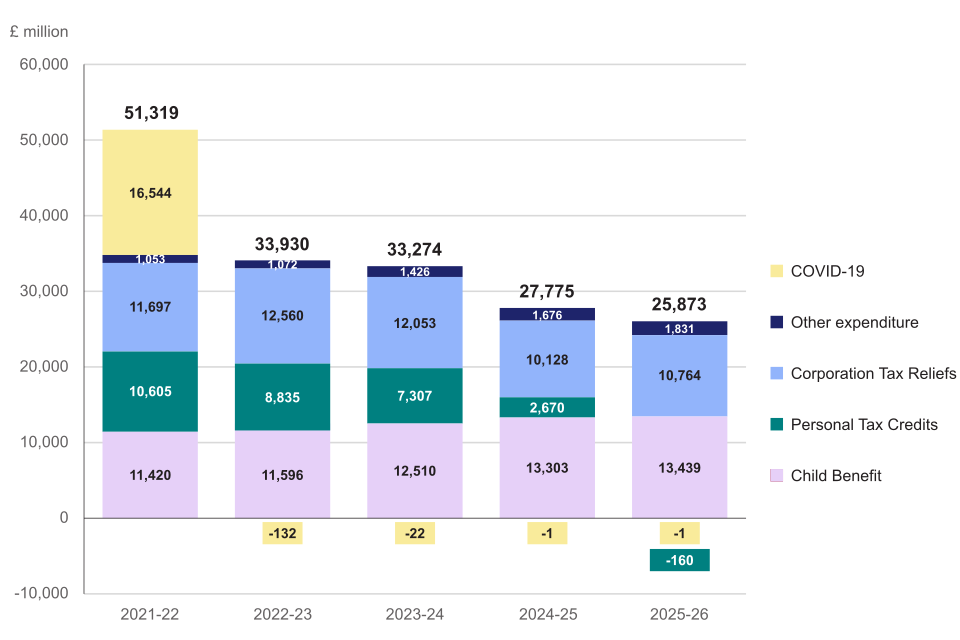
In 2025 to 2026, we spent £25,873 million, against a budget of £28,653 million, on Annually Managed Expenditure (AME). This was an underspend of £2,781 million. Table 5 and figure 12 show our AME spending pattern, over the last 5 years.
Overall, 52% of our AME spend was on Child Benefit payments, totalling £13,439 million in 2025 to 2026. Total Child Benefit payments have slightly increased compared to 2024 to 2025 because of higher take-up of Child Benefit following the Spring 2024 changes to the High-Income Child Benefit Charge threshold and taper. Those changes meant some higher-income households claimed or opted back into payment.
We spent £10,764 million on reliefs and allowances, which includes Corporation Tax reliefs, primarily for Research and Development relief and Film Tax relief. This made up 42% of our AME spend.
AME covers volatile or demand-led expenditure that is more difficult to control, so requires ongoing oversight. Our underspend primarily reflected fewer families claiming Child Benefit payments than forecast and lower expenditure than budgeted for Corporation Tax reliefs. The underspend in expenditure for Personal Tax Credits reflects its closure, which ended on 5th April 2025 and was replaced by Universal Credit.
Table 5: 5-year trend on our AME funding and spend (note)
| Total Annually Managed Expenditure £ million | 2021-22 | 2022-23 | 2023-24 | 2024-25 | 2025-26 |
|---|---|---|---|---|---|
| Funding | 59,069 | 38,162 | 36,380 | 31,723 | 28,653 |
| Expenditure | 51,319 | 33,930 | 33,274 | 27,775 | 25,873 |
| Expenditure compared to Budget | -7,750 | -4,232 | -3,105 | -3,947 | -2,781 |
Note: Numbers may appear not to sum due to rounding.
Figure 12: Total AME 5-year expenditure trend (note)
Note: Numbers may appear not to sum due to rounding.
Using public money responsibly
We’re committed to using public money responsibly and we demonstrate this by delivering efficiency savings that reduce our operational costs and by comparing tax revenue with the cost of collecting it.
Delivering sustainable efficiencies
We achieve sustainable efficiencies when we improve how we carry out a process or activity to deliver a permanent cost reduction, while maintaining or improving existing performance levels. Our track record of delivering efficiencies is strong. In the 5-year period since 2021 to 2022 we have delivered total sustainable efficiencies of £767 million — as a result, our costs are £767 million lower in 2025 to 2026 than they would otherwise have been.
Figure 13: 5-year view of sustainable efficiencies, cumulative by Spending Review (SR) period

In 2025 to 2026, we achieved new sustainable efficiencies of £137 million against a target of £134 million. We achieved these broadly through delivering people and productivity improvements, modernising our IT systems, and by reducing the costs associated with maintaining our physical estate.
We made savings of £58 million through people and productivity improvements, such as by tackling compliance risks more effectively. By modernising our IT systems, through replacement of existing IT contracts with new, more efficient, services and suppliers, we delivered £63 million savings. We also saved £16 million by further optimising our office space and subletting to other government departments. Our overall efficiency commitment across the Spending Review 2025 period from 2025 to 2026 to 2028 to 2029 is £1,020 million.
Four ways in which we delivered sustainable efficiencies this year
- we delivered £30 million of efficiencies in customer services through a combination of service redesign, increasing automation, digital modernisation and operational improvements. This improved how customers interact with HMRC digitally and reduced demand on frontline services. Examples of this include simplifying tax codes for customers, reducing the volume of queries, and improvements to Self-Assessment, including reducing manual handling
- we delivered £28 million of savings by tackling compliance risks more effectively and supporting customers to get their tax affairs right at the outset
- we continue to deliver efficiencies through the rationalisation of our digital services and infrastructure. Alongside this, we have reduced our software licensing costs, and ongoing IT support costs
- as we continue to restructure and optimise our physical estate, we saved £10 million through streamlining our facilities management contracts
Tax revenues
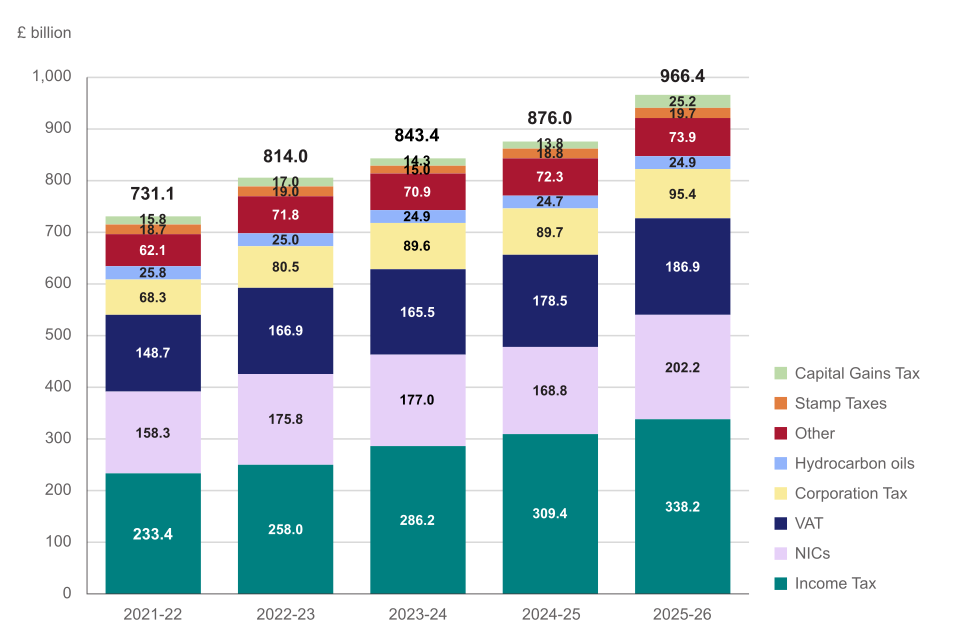
Total tax revenues represent all the money HMRC received (or was due to receive), less any money that we owed or repaid. Tax revenue is driven by various factors, including the overall level of financial activity taking place within the economy and the rates of taxation, allowances and reliefs set by Parliament. Tax revenues are based on when a tax liability accrues, which is different to tax receipts that are based on when a payment for a tax liability is received by HMRC. Figure 14 shows total tax revenues between 2021 to 2022 and 2025 to 2026.
Figure 14: Total tax revenues (note)
Note: Numbers may appear not to sum due to rounding.
During 2025 to 2026, we generated total revenues of £966.4 billion, which is £90.4 billion more than the previous financial year. Overall tax revenues have continued to increase, driven by economic factors such as growth in wages, profits and inflation as well as continued growth in the number of taxpayers within the tax system.
Income Tax revenues increased by £28.8 billion (9.3%) compared to 2024 to 2025, reflecting average earnings growth. The Office for Budget Responsibility note that policy changes, including the decision to freeze some tax allowances and thresholds, boosted revenues.
National Insurance contributions increased by £33.4 billion (19.8%) compared to 2024 to 2025 due to an increase in the secondary Class 1 rate and a decrease in the Secondary Threshold.
Corporation Tax revenues increased compared to 2024 to 2025, and VAT revenues increased by £8.4 billion (4.7%) compared to 2024 to 2025, reflecting economic growth and increased inflation.
Capital Gains Tax revenues increased by £11.4 billion (82.6%) compared to 2024 to 2025, due to a combination of policy changes including increased rates introduced part-way through 2024 to 2025, and reforms to the non-domiciled regime.
Hydrocarbon oil revenues marginally increased by £0.2 billion (0.8%) and stamp tax revenues increased by £0.9 billion (4.8%), reflecting increased property prices and the reduction in the nil-rate band.
Other taxes include a range of taxes including Insurance Premium Tax, Inheritance Tax and Tobacco Duties.
Read more on tax receipts over time in our annual bulletin of HMRC tax receipts and National Insurance contributions on GOV.UK. Tax receipt data for 2025 to 2026 is provisional until Summer 2026. Please note: receipts are on a cash basis and so represent when a payment for a tax liability is received by HMRC. This is different to tax revenues which are based on when the tax liability accrues.
Cost of collection
Table 6 shows that in 2025 to 2026, the cost of collection was 0.51 pence for every pound we generated in tax revenue, maintaining the amount it costs us at around half a penny for every £1 collected.
A range of factors affect the cost of collection. In 2025 to 2026, higher expenditure was offset by higher revenue. Expenditure increased as we invested in delivering our priorities of closing the tax gap, improving day to day performance, and reform of the tax and customs system. Revenue also increased over the year.
Table 6: Cost of collection trends from 2021 to 2022 to 2025 to 2026 (note)
| Year | Pence |
|---|---|
| 2021-22 | 0.50 |
| 2022-23 | 0.51 |
| 2023-24 | 0.51 |
| 2024-25 | 0.51 |
| 2025-26 | 0.51 |
Note: A change to the methodology for the overall cost of collection has been made in 2021 to 2022 and the ratio is now shown net of Customs and International Trade.
Our spending compared to total tax revenue in 2025 to 2026
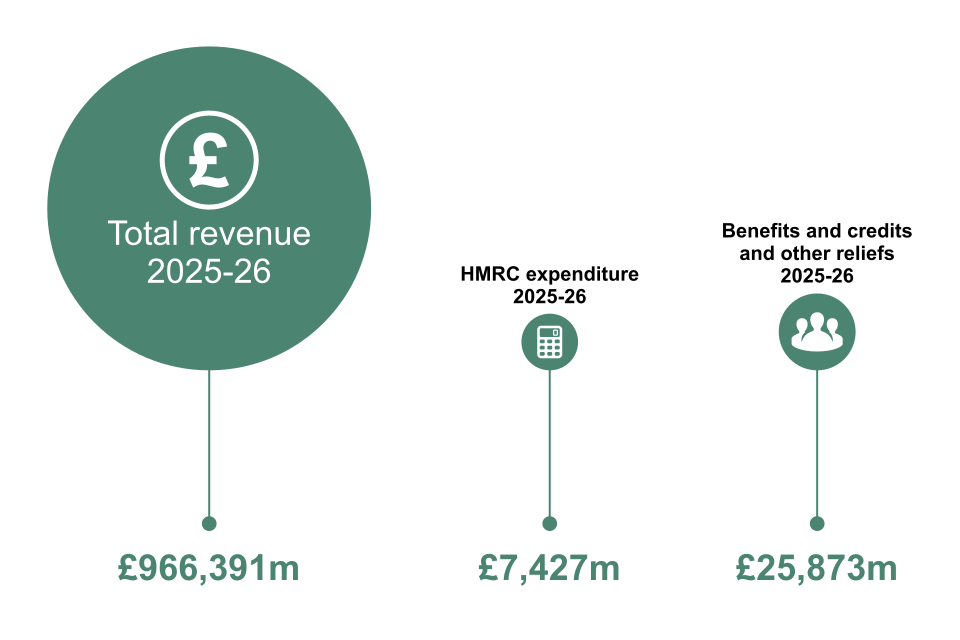
Figure 15 shows what it cost to run HMRC in 2025 to 2026. For our expenditure of £7,427 million, we generated £966.4 billion of revenue for the UK’s public services and provided £25,873 million in financial support for Child Benefit and other reliefs.
Figure 15: Total expenditure relative to total revenue