Figures to March 2018 (published 26 April 2018)
Updated 21 February 2019

© Crown copyright 2019
This publication is licensed under the terms of the Open Government Licence v3.0 except where otherwise stated. To view this licence, visit nationalarchives.gov.uk/doc/open-government-licence/version/3 or write to the Information Policy Team, The National Archives, Kew, London TW9 4DU, or email: psi@nationalarchives.gov.uk.
Where we have identified any third party copyright information you will need to obtain permission from the copyright holders concerned.
This publication is available at https://www.gov.uk/government/statistics/historical-statistics-notices-on-uk-milk-prices-and-composition-of-milk-2018/united-kingdom-milk-prices-and-composition-of-milk-statistics-notice-data-for-march-2018
1.1Key messages
-
This release shows the latest information on average farm-gate milk prices, volumes and the butterfat and protein content of UK produced milk.
-
The UK average farm-gate milk price for March 2018 is 28.57 pence per litre (ppl). This represents a 2.8% (0.83 ppl) decrease on February 2018 and is 4.0% (1.09 ppl) higher than the same month last year. (Figure 1.2).
-
Butterfat is up 0.9% on last month at 4.20%. Compared to last year butterfat is 1.9% higher than March 2017. (Figures 1.3a).
-
March volumes increased following seasonal trends to 1,257 million litres, a rise of 12% on the previous month. Milk volumes are down 2.1% on March 2017. (Figure 1.4).
1.2 United Kingdom farm-gate milk price (pence per litre)
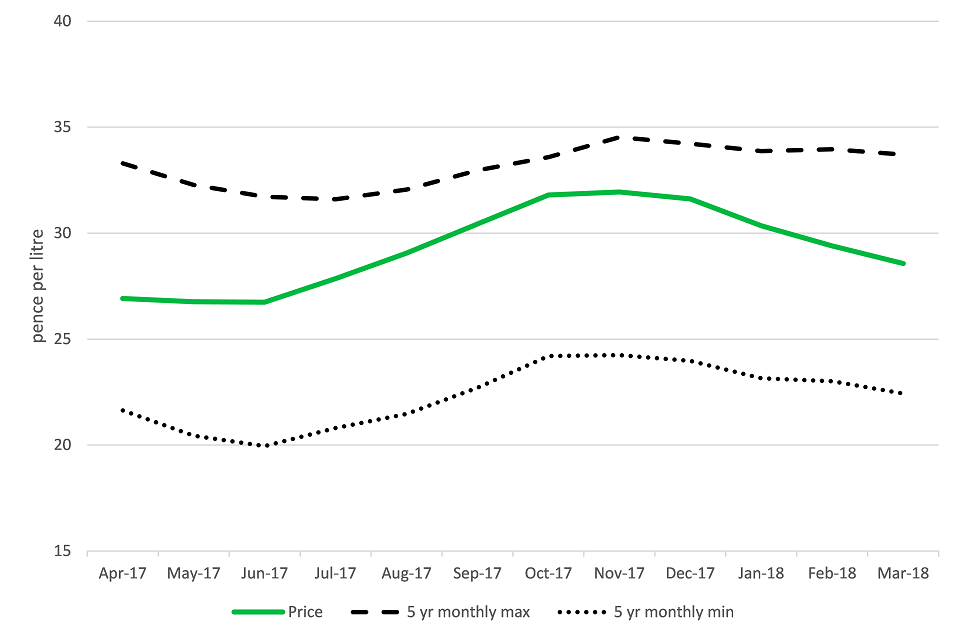
United Kingdom farm-gate milk price (pence per litre) to March 2018
1.3 Average butterfat and protein content of United Kingdom produced milk
1.3a. Butterfat %
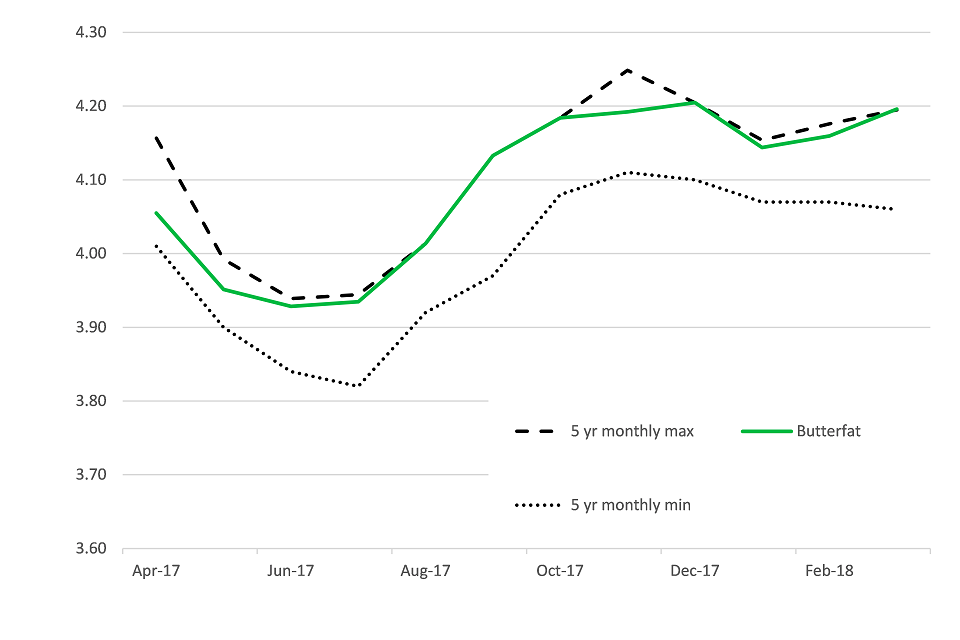
a. Butterfat % to March 2018
1.3b. Protein %

b. Protein % to March 2018
1.4 United Kingdom wholesale milk production (million litres)
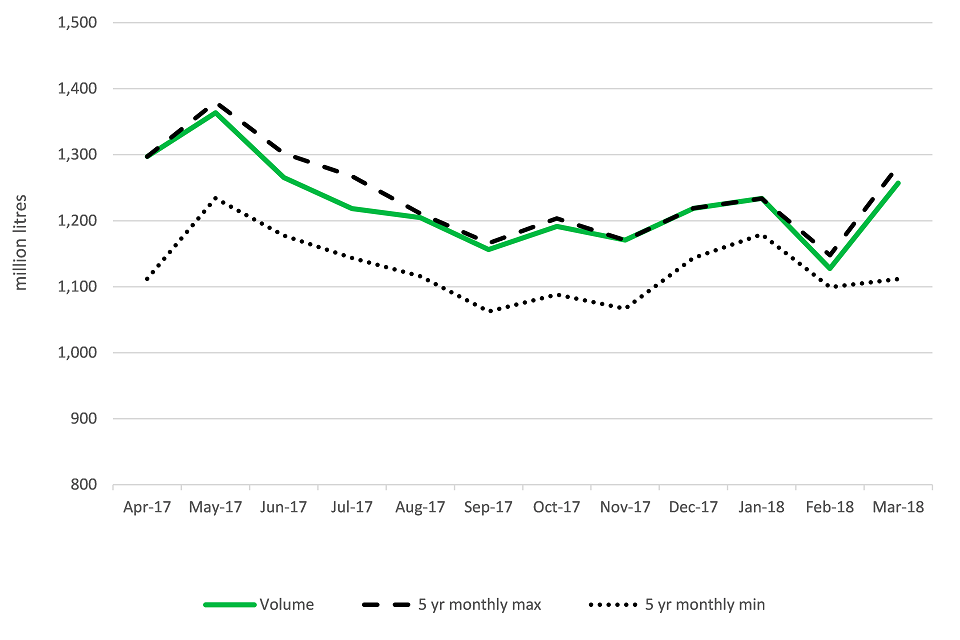
United Kingdom wholesale milk production (million litres) to March 2018
1.5 Percentage change in key items: March 2018 compared to March 2017
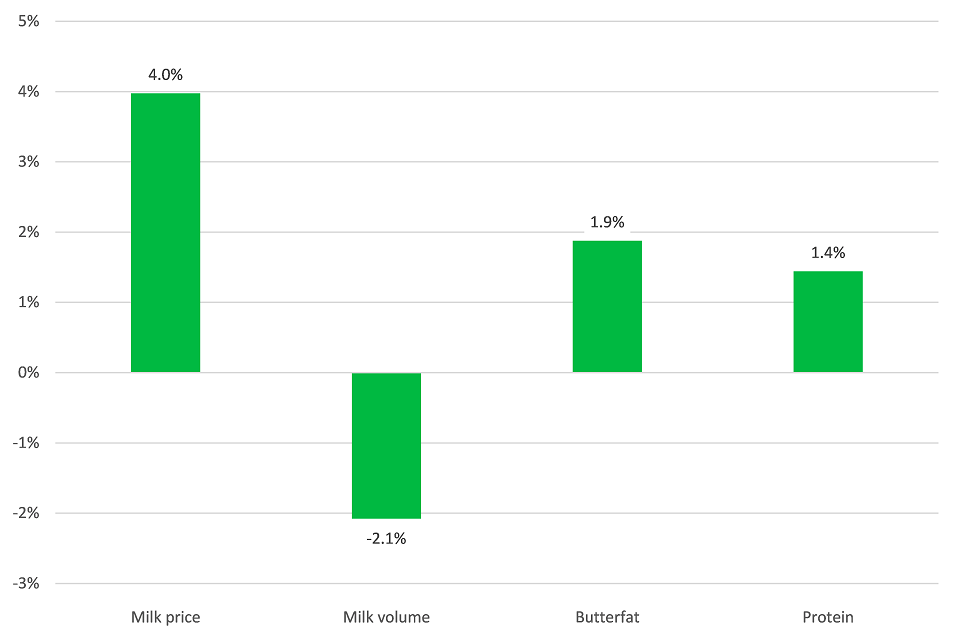
Percentage change in key items: March 2018 compared to March 2017
1.6 Trends
Figures 1.2 to 1.4 above show the values for the latest 12 months along with the maximum and minimum monthly values. Trends can be seen, notably the spring flush in milk production and the drop in butterfat as the dairy herd diet changes when they are put out to grass in the summer. There is a strong positive correlation between milk composition (butterfat and protein content) and milk price.
Milk production, butterfat and protein are running at 5 year highs.
1.7 Retrospective payments
Some companies make retrospective bonus payments. We do not reflect these payments in the monthly milk price figures. The annual average price for farm-gate milk in 2017, including retrospective payments, is 28.86 ppl, 0.16 ppl more than the annual average price without retrospective payments (28.70 ppl). In 2017 total retrospective payments were 2.5% lower than 2016 at £24.2 million.
A retrospective payment is when a company makes a payment to a farmer that is outside the normal contract price they receive and is generally paid on prior production, for example profit sharing.
1.8 Revisions and estimates
England and Wales survey response in March was 100%. Northern Ireland data for March 2018 is an estimate. Revisions to February 2018 data are due to receiving actual data from Northern Ireland.
The next update of this monthly notice is at 09:30 on 31st May 2018.
Enquiries to: Julie Rumsey, Tel: +44 (0) 208 026 6306
email: julie.rumsey@defra.gsi.gov.uk
Defra, Rm 201,
Foss House,
Kings Pool,
1-2 Peasholme Green,
York,
YO1 7PX