Food chain total factor productivity 2016 - provisional release (published 25 January 2018)
Updated 19 June 2025

© Crown copyright 2025
This publication is licensed under the terms of the Open Government Licence v3.0 except where otherwise stated. To view this licence, visit nationalarchives.gov.uk/doc/open-government-licence/version/3 or write to the Information Policy Team, The National Archives, Kew, London TW9 4DU, or email: psi@nationalarchives.gov.uk.
Where we have identified any third party copyright information you will need to obtain permission from the copyright holders concerned.
This publication is available at https://www.gov.uk/government/statistics/historic-statistics-notices-on-food-chain-productivity/total-factor-productivity-of-the-united-kingdom-food-chain-2016-provisional-release-published-25-january-2018
1. Key messages
- In 2016 the productivity of the food chain increased by 1.9 per cent while the wider economy decreased by 0.3 per cent. In the 10 years prior to 2016, the average annual growth rate of the food chain was 0.4 per cent whereas the wider economy’s average annual growth rate was 0.3 per cent
- In 2016 wholesale saw the highest increase in productivity of 3.4 per cent while catering was the only sector to see a decrease, of 2.7 per cent
- In 2016, the value of Gross Value Added for the four sectors of the food chain was £103 billion. This counted for about 9 per cent of the UK non-financial business economy
2. Overview
The total factor productivity (TFP) of the United Kingdom food chain is an indicator of the efficiency and competitiveness of the food industry within the United Kingdom. An increase in TFP indicates the industry is improving its efficiency. If TFP in the UK food chain increases faster than other countries, this indicates that the industry is improving competitiveness.
Factors influencing total factor productivity
In economic theory, Total Factor Productivity (TFP), also called multi-factor productivity, measures the proportion of output not explained by traditionally measured inputs of labour and capital used in production.
Increases in total factor productivity reflect a more efficient use of inputs and TFP is often taken as a measure of long-term technological change or dynamism brought about by such factors as technical innovation. This indicator does not explicitly capture these factors, but attempts to produce a more sophisticated measure than simple labour productivity estimates. Explaining year to year changes in TFP is not straightforward as there is no single factor that can explain changes in TFP.
There are several macro and micro economic factors, which together can help to understand patterns in the TFP behaviour. These include technological advances, Macroeconomic factors, Human capital and Insitutions. Please see the Background Notes section further down this document for further detail.
The food sector plays a significant part in our economy, accounting for about 9 per cent of the Gross Value Added of the UK non-financial business economy. Four sectors make up the food chain: retail, manufacture, wholesale and non-residential catering. Both alcoholic and non-alcoholic drinks are included in food. Total factor productivity is a measure of the efficiency with which inputs are converted into outputs. For example, TFP increases if the volume of outputs increases while the volume of inputs stays the same. Similarly, TFP increases if the volume of inputs decreases while the volume of outputs stays the same. Although there is a practical limit on how much food people want to buy, the volume of output can increase due to increases in quality of products and by increases in exports.
2.1 Gross value added of the UK food sector 2016
| 2016 | £ billion |
|---|---|
| Food and Drink Manufacturing | £28.8bn |
| Food and Drink Wholesaling | £12.0bn |
| Food and Drink Retailing | £29.8bn |
| Non-Residential Catering | £32.4bn |
In 2016, the value of Gross Value Added for the four sectors of the food chain was £103 billion. Catering was the largest contributor with £32.4 billion while wholesaling was £12 billion.
This estimate for 2016 is final as the underlying data used are final estimates. See the Uses section for more details. The background data and charts in this release can be downloaded here: Food chain productivity
3. Sector trends
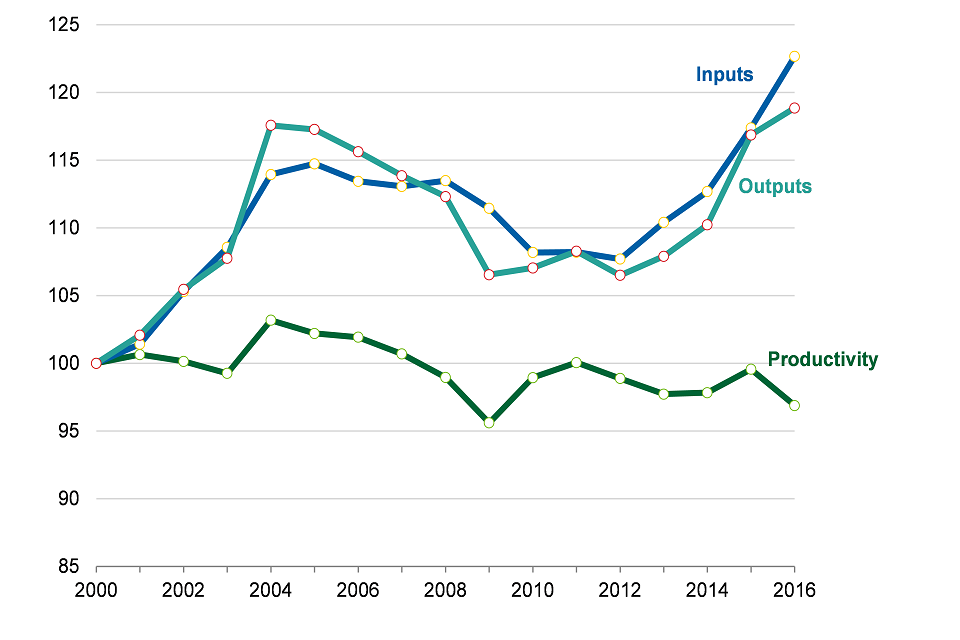
3.1 Total Factor Productivity trends within the UK food industry 2000 to 2016
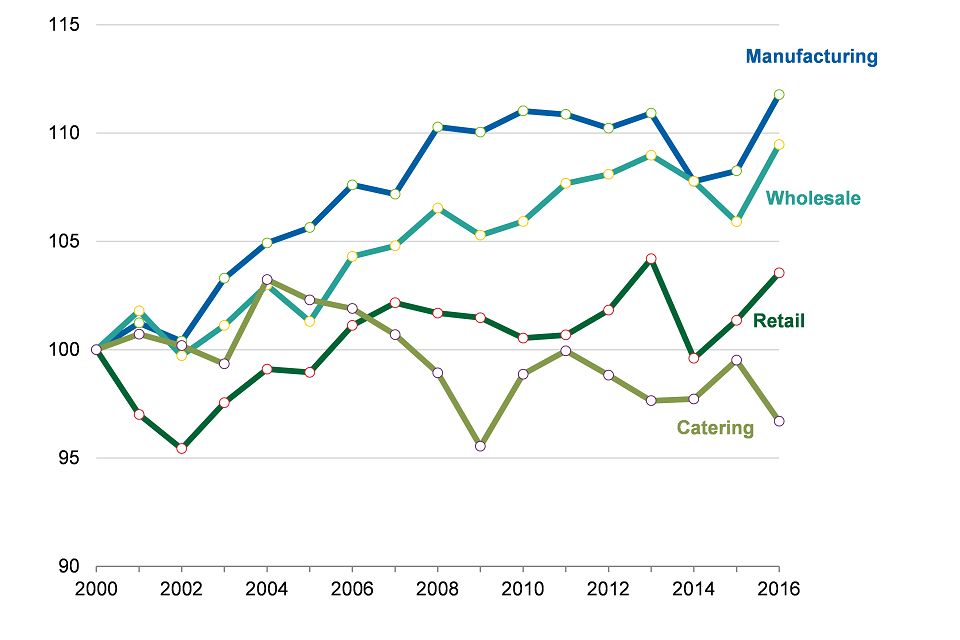
Total Factor Productivity trends within the UK food industry 2000 to 2016
- In 2016 wholesale saw the highest increase in productivity of 3.4 per cent while catering was the only sector to see a decrease, of 2.7 per cent.
- Since 2000 manufacturing has had the highest productivity except for 2001 and 2014 when wholesale was very slightly higher.
- Manufacturing and wholesale have steadily risen from 2000 to 2016, while retail and catering have had a flatter trend, but with some one-off spikes.
- In 2016, catering has a lower productivity than in 2000, while all other sectors have increased their productivity. However, manufacturing and wholesale have increased much more than retail.
- In 2002 and 2009, all sectors had a decrease in productivity. 2004 is the only year when all sectors increased their productivity.
4. Sector Analysis
4.1 Manufacturing
Manufacturing to 2016
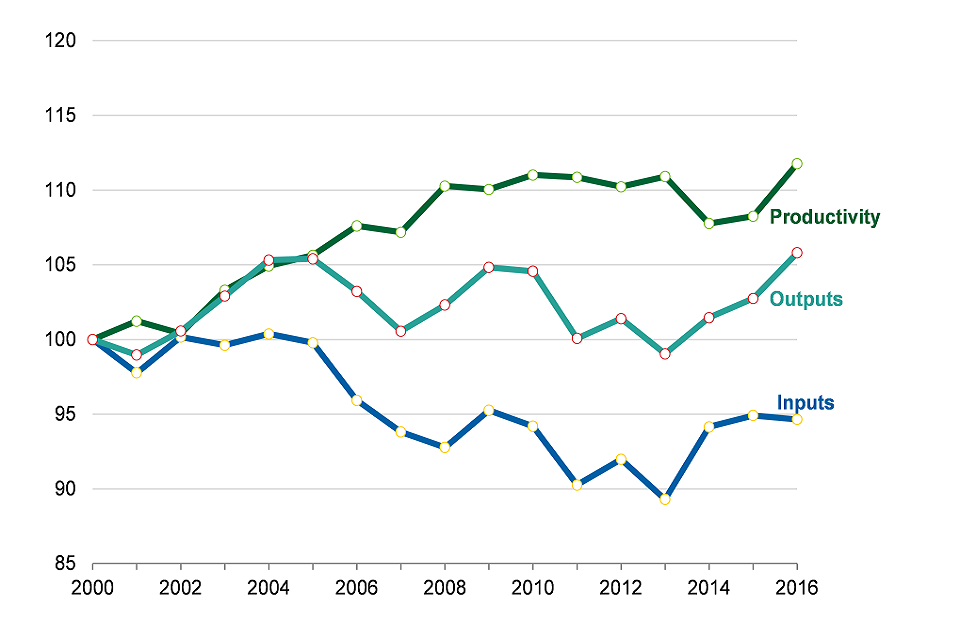
- In 2016, total factor productivity in food and drink manufacturing increased by 3.3 per cent and in the last 10 years has shown an average annual increase of 0.5 per cent.
- In 2016 outputs grew by 3.0 per cent, while inputs decreased by 0.3 per cent, resulting in the productivity increase. From 2000 inputs have consistently been lower than outputs.
- Since 2015, labour input has increased by 6.4 per cent. However, in the last 10 years there has been an average annual decrease of labour input of 0.04 per cent.
- In 2016, food and drink manufacturing contributed 28 per cent to Gross Value Added of the food chain beyond the farm-gate.
4.2 Wholesaling
Wholesaling to 2016
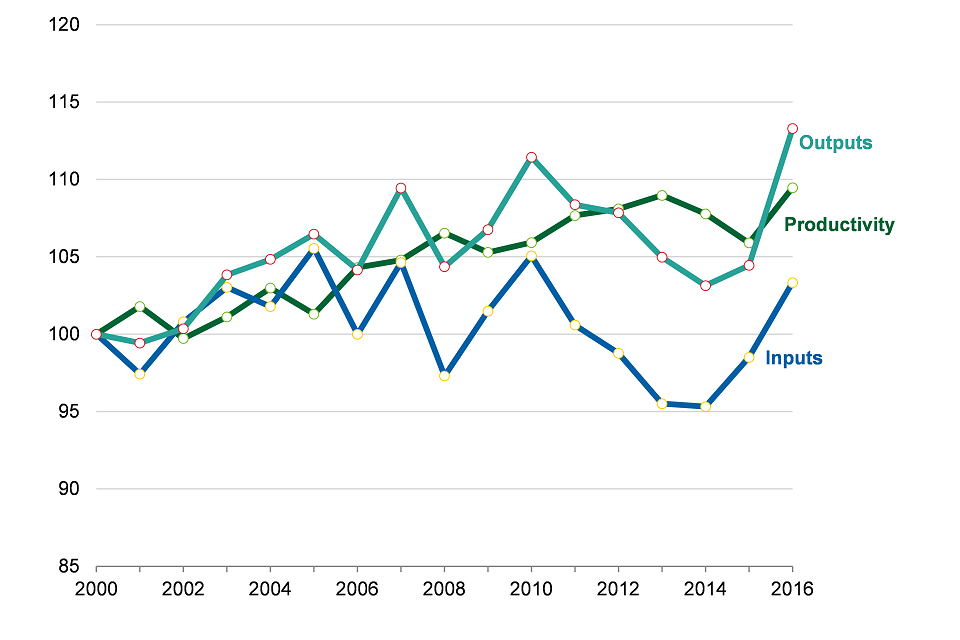
- Total factor productivity of food wholesaling increased by 3.4 per cent in 2016, the highest increase this year, but in the last 10 years has shown an average annual increase of 0.7 per cent.
- Both inputs and outputs have increased between 2015 and 2016, but outputs have increased more than inputs (8.5 per cent and 4.9 per cent respectively) resulting in the increase in productivity.
- In 2016 labour volume increased by 3.3 per cent. Labour decreased by 12.4 per cent between 2008 and 2009, but increased by 21.3 per cent between 2011 and 2012.
- In 2016 the wholesale sector contributed 12 per cent to Gross Value Added of the food chain beyond the farm-gate.
4.3 Retail
Retail to 2016
- Productivity of the food retail sector has increased by 2.2 per cent since 2015. The increase is due to there being an increase in both inputs (0.7 per cent) and outputs (2.9 per cent), but the increase in outputs being higher. In the last 10 years, productivity has increased by 0.4 per cent. Since 2000, inputs and outputs have followed a similar pattern resulting in little change in productivity.
- Labour input has increased by 0.1 per cent since 2015. The highest year on year decrease in labour input was in 2010 while the highest increase was in 2002.
- In 2016 food retailing contributed 29 per cent to Gross Value Added of the food chain beyond the farm-gate.
4.4 Non-Residential Catering (NRC)
Non-Residential Catering (NRC) to 2016
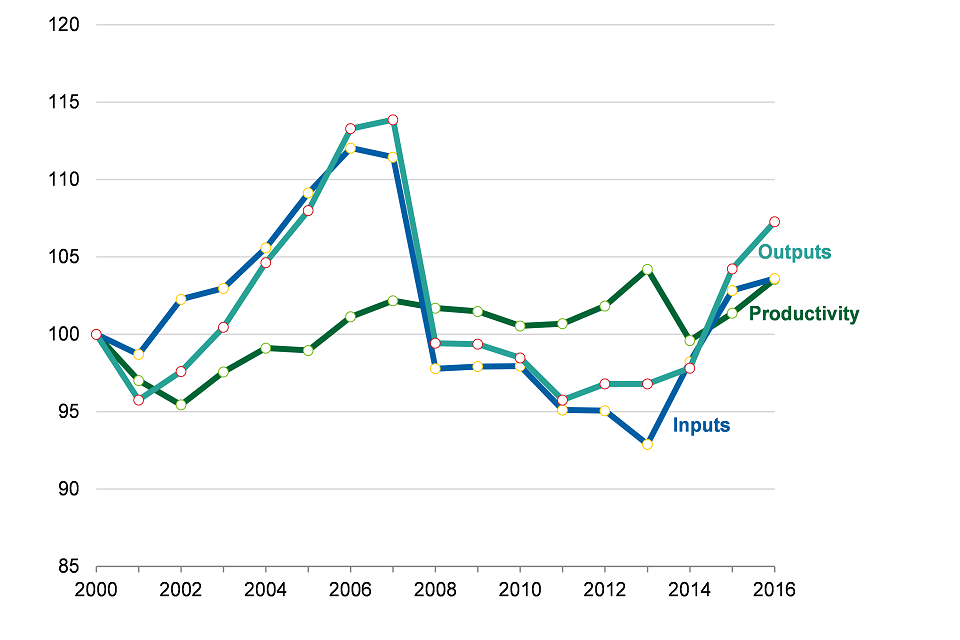
- In 2016 non-residential catering (NRC) showed the only decrease in productivity of all sectors, with a decrease of 2.7 per cent.
- The increase in productivity was due to an increase in both inputs and outputs, however inputs increased by 4.5 per cent while outputs increased by only 1.7 per cent. In the last 10 years, productivity has seen an average annual decrease of 0.5 per cent, while all other sectors have increased. Outputs have been lower than inputs for much of the last 15 years resulting in low productivity.
- Productivity of NRC was at its strongest prior to the recession, then dipped to its lowest level in 2009, but since the recession has seen an increase until 2016. This sector would have been affected strongly by the recession that started in 2008 and lasted through most of 2009. These challenging economic times will make it difficult for companies to make proportionate savings across all inputs, especially with labour being a relatively high component. Consumers find it easier to cut on this form of spending on food. During periods of economic downturn it is likely that consumers will make savings through eating out less and switching to home cooking.
- Labour in NRC is at its highest level since 2000, having dipped between 2009 and 2013. There was an increase in labour in 2016 of 7.5 per cent.
- In 2016, NRC contributed 31 per cent to Gross Value Added of the food chain beyond the farm-gate.
5. Benchmarking the UK food chain against the wider economy
An estimate of total factor productivity in the wider economy is calculated for comparison purposes from the same data sources as the food chain using the same method. This measure does not cover the full economy but rather non-public sector industries that are covered by the Annual Business Survey. Financial services are the largest sector not included in the measure.
In 2016 the productivity of the food chain increased by 1.9 per cent while the wider economy decreased by 0.3 per cent. In the 10 years prior to 2016, the average annual growth rate of the food chain was 0.4 per cent whereas the wider economy’s average annual growth rate was 0.3 per cent. For the last 10 years, the food chain has had a higher productivity than the wider economy, except for 2014 and 2015.
5.1 Total factor productivity of the UK food sector compared with the wider economy for the UK
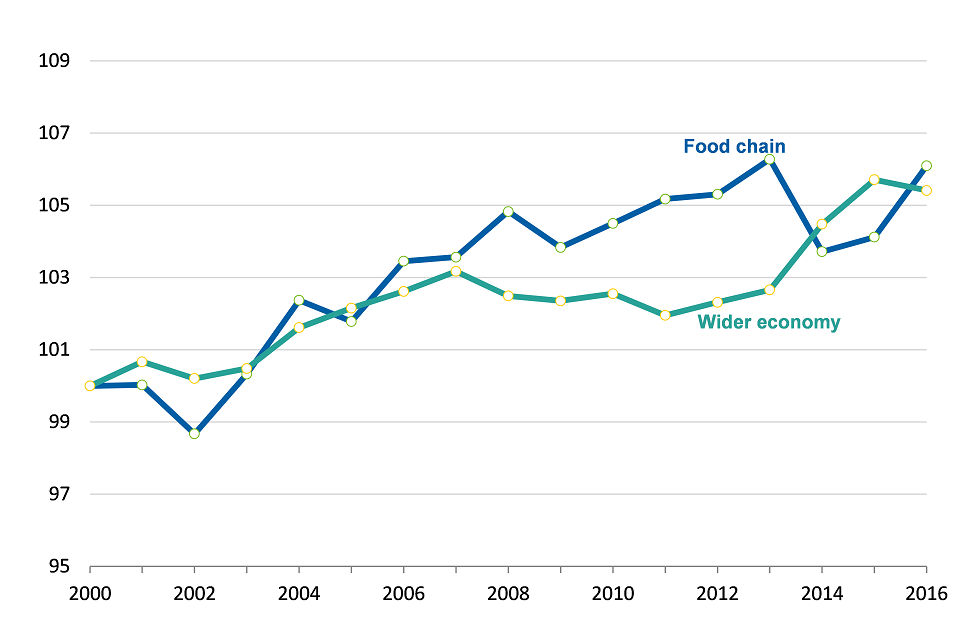
Total factor productivity of the UK food sector compared with the wider economy for the UK to 2016
6. Background notes
6.1 TFP calculation
The method incorporates the inputs and outputs that are associated with monetary transactions but does not incorporate external effects on society and the environment. TFP differs from labour productivity by factoring in capital consumption. This calculation covers labour, capital and purchases while output is the volume of sales. TFP is measured only in the form of changes as the change in the ‘volume of outputs’ divided by the change in ’the volume of inputs’. The series is annually rebased and chain linked. Inputs are measured in the form of labour, capital and purchases. Purchases (mainly food but also energy, water and other consumables) dominate the inputs in all sectors.
6.2 Contribution of inputs
| Category | Capital | Purchases | Labour | |
|---|---|---|---|---|
| Catering | 7 | 58 | 35 | |
| Retail | 5 | 78 | 17 | |
| Wholesale | 1 | 92 | 7 | |
| Manufacturing | 4 | 77 | 19 |
A more detailed methodology note to accompany the release sets out methods, assumptions, data sources and revisions, and is available here: Food chain productivity
6.3 Factors influencing total factor productivity
In economic theory, Total Factor Productivity (TFP), also called multi-factor productivity, measures the proportion of output not explained by traditionally measured inputs of labour and capital used in production. Increases in total factor productivity reflect a more efficient use of inputs and TFP is often taken as a measure of long-term technological change or dynamism brought about by such factors as technical innovation. Explaining year to year changes in TFP is not straightforward as there is no single factor that can explain changes in TFP behaviour. There are several macro and micro economic factors, which together can help to understand patterns in the TFP behaviour:
Changes in technology
Factors of production typically include land, labour, capital and natural resources. These inputs are used directly to produce a good or service. Technology, on the other hand, is used to put these factors of production to work. A firm doesn’t purchase additional units of technology to feed into the production process in the same way that a firm might hire more labour in order to increase output. Instead, the technology available in a particular industry or economy allows firms to use labour and capital more or less efficiently. Advances in technology alter the combination of inputs or the types of inputs required in the production process and that usually means that fewer and/or less costly inputs are needed. Innovation is the driving force behind these leaps in efficiency.
Macroeconomic factors
Economic stability (e.g. inflation, interest rates, and exchange rate), levels of taxation, fiscal and monetary policies can lead to changes in the level of output produced in the economy. For example, fluctuations in commodity prices resulting from increased/low levels of inflation or exchange rates can cause higher/lower inputs prices and subsequently affect the production cost and the TFP.
Economic shocks and cyclical movements of the business cycle (intrinsic periods of recession to recovery) can also account for changes in total factor productivity.
Overall openness to international trade and capital mobility are expected to boost productivity growth. International trade spurs competition –which leads to innovation –as well as serves as a channel for technology diffusion amongst nations. Generally, openness to capital flows (Foreign Direct Investment) is associated with technology diffusion and knowledge transfers, which in turn boost productivity growth.
Human Capital
Labour skills positively affect productivity because of its inherent contributions to capital productivity, innovation and technological change. In addition better labour skills may also increase the capability of an economy to benefit from externalities created by international trade and capital flows.
Institutions
Institutions and the overall legal framework of an economy shape the incentives for both factor accumulation and innovation and therefore play an important role in fostering technological change as well as improving the overall allocative efficiency of factors of production. Furthermore, technical change is significantly impacted by innovation through public research and improved human capital through education and health care access.
7. Uses and potential uses of this data
Defra use TFP in the food chain beyond agriculture as a measure of how well the UK food industry beyond agriculture is improving its productivity and thereby on course to be competitive in the future.
Improving the productivity and competitiveness of food and farming businesses, while improving the environment, is a priority for Defra. Domestically a more competitive, profitable and resilient farming and food industry is needed. As the UK economy recovers, this sector, like all others, needs to maximise its potential for sustainable growth, maintain and increase its chance of securing European and global trading opportunities, and meet society’s needs. We also need a basic level of resilience against changing environmental conditions, price fluctuations, financial uncertainty and food availability.
The Food and Drink Federation use this data to communicate to its members (by tracking the industry’s progress and promoting the sector) and they make this information available on their website.
Food and drink businesses can also use this data to track progress of the industry in general but this measure is not comparable with competitiveness measures applied to individual businesses and cannot be used to benchmark their own performances.
This measure is not directly comparable with the general calculation used by the Office for National Statistics to measure whole economy productivity. To enable a comparison with the wider economy we calculate TFP growth in the wider economy using this calculation, i.e. data from the annual business survey. It is limited to coverage of the economy by the Annual Business Survey. The Annual Business Survey is the main structural business survey conducted by the Office for National Statistics. Prior to 2009 it was known as the Annual Business Inquiry - part 2. It collects financial information for about two-thirds of the UK economy, covering agriculture (part); hunting; forestry and fishing; production; construction; motor trades; wholesale; retail; catering and allied trades; property; service trades. The financial variables covered include turnover, purchases, employment costs, capital expenditure and stocks. Further details on the survey are at: Annual Business Survey – ONS
The original research this statistics release is based on was published in May 2006 and is available here: UK Food Chain Productivity research.
Total factor productivity of agriculture is published in Agriculture in the UK Chapter 5. Data up to 2016 is available in Chart 5.1.
8. Glossary
8.1 Economic Definition of the food sector
The UK food sector is defined in terms of the standard industrial classification (SIC 2007) as food manufacturing, food wholesaling, food retailing and non-residential catering:
| Category | SIC codes |
|---|---|
| Food and Drink Manufacturing | 10 + 11 |
| Food and Drink Wholesaling | 46.3 (excluding 46.35) + 46.17 |
| Food and Drink Retailing | 47.2 (excluding 47.26) + 47.11 + 47.81 |
| Non-Residential Catering | 56 |
The deductions are to remove non-food items as far as possible.
8.2 Food and Drink Manufacturing
The sector comprises of nine main categories including processing and preserving meat, dairy, fruit and vegetables, oils, bread, biscuits and cakes, and confectionary. Animal feed manufacturing is included, covering both farm animal feed and pet food, and representing 7% of total turnover in food and drink manufacturing in 2016. The drink manufacturing sector includes alcoholic beverages and soft drinks and mineral waters.
8.3 Food and Drink Wholesaling
The sector consists of the buying, storage and reselling of food either manufactured or freshly produced. Wholesale of tobacco products is not included.
8.4 Food and Drink Retailing
The sector is defined as the sale of food within both non-specialised stores (e.g. supermarkets) and specialised stores such as butchers and bakers.
8.5 Non-residential Catering
(NRC) consists of restaurants and bars involved in preparation and serving of food, alongside canteens and catering services. Hotels are not included.
8.6 Gross Value Added (GVA)
GVA is the difference between output and intermediate consumption for any given sector / industry. This is the difference between the value of goods and services produced and the cost of raw materials and other inputs which are used up in production.
8.7 Inputs
Inputs are labour (total hours worked), capital expenditure and purchases (of goods materials and services).
8.8 Outputs
Output is Turnover (volume of sales of products.).
These estimates are produced twice yearly. Most of the data is sourced from the Annual Business Survey (ABS), which is produced by the Office for National Statistics (ONS). The ONS release the ABS provisional estimates normally around November and the revised estimates are released around June. Data in this release comes from the Annual Business Survey published in November 2017, The Annual Survey of Earnings and Hours published in November 2017 and Capital Stocks: Consumption of Fixed Capital published in November 2017. The next TFP update will be in July 2018.
Enquiries to:
David Lee
Tel: +44 (0) 208 026 3006
email: david.lee@defra.gsi.gov.uk
Defra
Food Statistics team
Area 1A Nobel House
17 Smith Square
London
SW1P 3JR