Geospatial AI for Land Use, by The Alan Turing Institute
Published 14 November 2024

© Crown copyright 2024
This publication is licensed under the terms of the Open Government Licence v3.0 except where otherwise stated. To view this licence, visit nationalarchives.gov.uk/doc/open-government-licence/version/3 or write to the Information Policy Team, The National Archives, Kew, London TW9 4DU, or email: psi@nationalarchives.gov.uk.
Where we have identified any third party copyright information you will need to obtain permission from the copyright holders concerned.
This publication is available at https://www.gov.uk/government/publications/geospatial-ai-for-land-use-by-the-alan-turing-institute/geospatial-ai-for-land-use-by-the-alan-turing-institute
The Geospatial Commission commissioned the Alan Turing Institute in 2022 to explore how land use decision making can be supported by geospatial data, including earth observation data, and artificial intelligence. This independent report sets out their findings.
Executive summary
We face new and existing pressures on our finite land. We need to meet the needs of our growing population whilst maintaining our food and energy security, satisfying our net zero commitments and protecting our land. These competing priorities mean that a holistic, evidence-based view of our land is required to understand acceptable trade-offs and the impact of different use cases.
There has been exponential growth in data about our world. Everything is being transformed into data, including our land: its current state, how it changes and how it is being used. Key attributes of land, from the most remote areas to the middle of our cities, are being recorded through sensors and social processes in ways that are increasing in detail and machine readable. This accumulation of information is creating the necessary conditions for a revolution in how we understand and manage our land.
While data is necessary, they are not sufficient. Geospatial AI can process the expanding data about land to unlock its information and turn it into actionable insights. The Alan Turing Institute define ‘geospatial AI’ as AI applied in a geospatial context. This paper will refer to AI as a set of computational techniques based on machine learning that allow machines to learn about datasets and use that learning to perform statistical tasks such as prediction, or human-presenting tasks like holding a conversation about a topic.
In November 2022, the Alan Turing Institute began a partnership with the Geospatial Commission to develop a prototype decision support tool focused on spatial modelling for land use. This initial project explored how data science and AI could be used to support land use decision making, in collaboration with Newcastle City Council planners which provided the local context and challenges. The result was a prototype tool, DemoLand, which could suggest land use scenarios that would lead to desired outcomes. In December 2023, the Geospatial Commission and The Turing extended its partnership to further develop DemoLand by introducing geospatial AI.
This report outlines the key findings of this joint Alan Turing Institute and Geospatial Commission project to apply state-of-the-art geospatial AI to the DemoLand tool. It includes lessons learned from the technical development of the tool and extensive engagement with the land use modelling community on the potential for geospatial AI to make evidence-based decisions on land and land use.
The paper has three sections. In sections one and two, it identifies areas in land use modelling where geospatial AI has the potential to improve current practice. In the final section, the paper outlines cross-cutting challenges to maximising the potential of geospatial AI.
Section 1: The impact of low-resolution satellite data
Much of the information we require to characterise land use in our models is encoded in images taken from above. Although satellites have been in orbit for several decades, the amount, quality and frequency with which new data is being generated is growing exponentially. What we can do with those data is being redefined because of recent advances in computation and deep learning.
Section one explores the potential to complement or replace traditional data about land use, such as manually collected records on land uses, with imagery.
Section 2: The value of LLMs
Analysis tools, even those designed to be used by non-technical audiences, can contain a large amount of numerical information that is challenging to interpret. Often, specialist data science capability is required to understand a model’s output. Generative AI and large language models (LLMs) can provide a more natural interface for end users to interact with computers and realise important opportunities.
Section two tests how a conversational interface, using LLM agents, can lower the barrier to access outputs from the model. We utilised a series of techniques from recent literature [footnote 1] to create tools for the LLM to use when answering a user’s question. We explore how these approaches can reduce the risk of undesirable behaviour in LLMs, specifically the tendency to confidently offer incorrect answers and information.
Section 3: Cross-cutting challenges
There are strategic, operational and technical challenges to maximising the use of geospatial AI. Users of foundational models are tied to the choices that their creators made about how the model was trained and designed; the significant computational and infrastructure costs associated with the use of foundational models could prohibit use; data used to train foundational models can be expensive or include licensing restrictions; and, the use of AI in the geospatial sector is an interdisciplinary challenge that will require collaboration.
Section three describes these cross-cutting challenges and opportunities to overcome them. To identify and understand them, we convened a community of land use modelling experts and practitioners, including through two workshops.
Recommendations
This report makes five key recommendations for the UK geospatial ecosystem to improve the use of geospatial AI for land use decision making.
1. Identify additional areas of opportunity for satellite data to build the value case for geospatial AI: Satellite data, even of medium resolution, can have a profound impact in land use modelling. This is in part because of recent advances in geospatial AI. It has also illustrated an application in the context of strategic spatial planning that shows clear benefits over alternative data sources. We recommend that additional areas of deployment are identified for satellite data in the field of land use. We note the area of urban land uses and land use change as potential candidates where this technology can deliver frequent, reliable and actionable insights.
2. Develop a Geospatial AI Toolkit for LLMs: The tools developed in this project represent an exploration of a much larger body of work that could give LLMs access to the UK’s rich datastores, including census and Office for National Statistics (ONS) data. Developing an open-source library of such tools with a wide community of partners has huge potential to accelerate the deployment of LLMs in land use planning and other geospatial applications. This toolkit would address the limitations of existing LLMs in geospatial tasks by utilising rich data sources while allowing users to select the underlying LLM that aligns with their use case and aiming for model agnosticism to enable easy adaptation to newer models as the landscape evolves.
3. Expand the conversation on national foundation models to land use and geospatial: While a Geospatial AI Toolkit that can provide capabilities to existing LLMs has the potential to address many of the challenges in this space, a model that has a strong built-in understanding of geography and space is desirable. We recommend convening a range of experts in AI, geography and land use policy, to better understand what would be required in training new models tailored to specific national geographic needs or adapting existing open-source LLMs through fine-tuning techniques to enhance spatial capabilities especially related to UK geography.
4. Improve access to key computational and data resources: Training foundational models, including ChatGPT and SatlasNet, requires vast computational resources. Running such models to power tools like DemoLand also requires significant ongoing computational resources. Data is also required to power the tools that will enhance the capabilities of LLMs and to fine-tune language models and foundational satellite models. Much of this data is hard to licence and fund for individual research groups and organisations. We recommend that government identifies ways to increase access to these resources.
5. Promote knowledge sharing and cross-discipline collaboration: Building geospatial AI for land use requires hard-to-find technical skills and experience. Expertise in AI, computational infrastructure, geographic theory and policy will all play key roles in growing this new field. We recommend that government organises a series of workshops, conferences and training opportunities to accelerate the growth of this field by facilitating cross-discipline knowledge and skills transfer, capacity building and collaboration.
Section 1: The impact of low-resolution satellite data
Land use planning has an intrinsic temporal component. It is both necessary to have the most up to date information to inform decisions and modelling and track impact indicators over time. These requirements pose a challenge: many of the key datasets of interest, including the national census, travel surveys and mapping of infrastructure are updated over long-time scales which rarely align. Additionally, the generation of these datasets require significant energy and cost.
Modern earth observation satellites offer a possible solution to this problem. Satellites produce multiple cloudless images of the entire Earth’s surface every year. The data that is extracted from these images offers a unique perspective on cities, capturing snapshots of urban morphology, land use patterns, infrastructure networks, and environmental impacts from a bird’s-eye view.
Foundation models, such as vision transformers, have revolutionised computer vision and remote sensing. These models learn rich and generalisable representations of visual data by training on diverse tasks like segmentation, object detection and image classification. Researchers and data scientists can efficiently analyse satellite imagery by fine-tuning or adapting these models to specific downstream tasks, such as the prediction of socioeconomic or environmental inequalities [footnote 2], achieving state-of-the-art performance while saving time and computational resources.
The initial phase of the DemoLand project utilised data from multiple sources to predict several quality-of-life indicators, including house prices and air quality. In this phase, we built a model to leverage information extracted from satellite images by foundational AI models and assessed the feasibility of using this to replace the traditional data used in the initial phase.
To ensure that the findings of this research could be easily adopted and replicated by others, publicly available images from the Sentinel-2 satellite were selected. These images initially went through a pre-processing step to address challenges such as cloud cover and seasonal variations, which could affect data consistency.
The resulting composite of multiple stitched satellite images with a 10 metre per pixel resolution encompassing four spectral bands captured between January 2017 and December 2018, enabled direct analysis without extensive preprocessing.
To conduct the analysis at a specific spatial scale, the hexagonal geometries were merged with the square grid imagery using two preprocessing methods: dividing into image chips and introducing a masking step. A universal mask was applied across all image tiles to ensure consistency and prevent geographical biases from varying mask shapes due to the Earth’s curvature (summed masked).
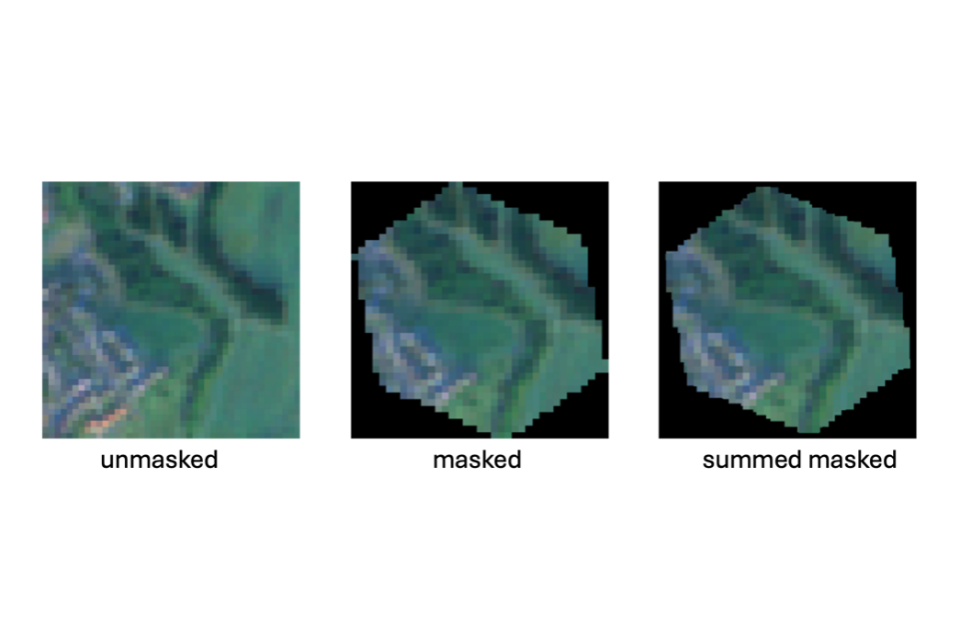
Figure 1: Example of satellite image tiles
The figure demonstrates different masking techniques applied to satellite imagery for data processing purposes. The image shows three versions of the same satellite image: First, the “unmasked” tile, which is square image showing an aerial view of a green area, likely farmland or forests, with some visible structures. The second image, called “masked” shows the same image, but cropped into a hexagonal shape with black corners where the image has been cut off.
The third image, the “summed masked” tile, appears almost identical to the “masked” image, also in a hexagonal shape with black corners, however, with slightly smoother boundaries.
After analysing both datasets, the masked dataset was chosen for the final analysis to maintain consistency and mitigate potential geographical biases. This approach standardised the representation across all areas, addressing the issue of AI models inferring geographic locations from mask variations.
Models such as SatlasNet can summarise complex information, such as images, into more “digestible” formats known as image embeddings. These lower-dimensional feature vectors, essentially a long list of numbers, capture the key features and patterns within satellite images. SatlasNet, a state-of-the-art vision transformer model with a Vision Transformer backbone, pretraining on Sentinel-2 images, was selected as the foundation model. The tasks that the model was trained to perform and the features it was designed to detect were well aligned with the task of predicting quality-of-life indicators in urban environments.
One advantage of using image embeddings is their ease of sharing and integration. Instead of working with large, computationally expensive image datasets, embeddings can be extracted from the pretrained model and incorporated into the existing DemoLand modelling pipeline. As a result, even data scientists without specific training in image analysis or remote sensing applications can easily utilise the embeddings. The code for creating image embeddings is available via the publicly available GitHub repository.
We built three models to compare the relative ability of satellite embeddings and traditional data sources to correctly predict the quality-of-life indicators:
- Baseline: Only the original fifty nine urban features from the DemoLand 1.0 setup are used to predict urban indicators.
- Satellite embeddings: Satellite image embeddings alone are used for predictions.
- All data combined:Both datasets are combined to predict the indicators.
The aim of employing these different approaches was to leverage the strengths of each dataset and modelling technique to achieve the most accurate predictions. The importance of geographic context in the models was assessed by creating variants of each model which had access to information on where each region was located. This was encoded as a spatial H3 index.
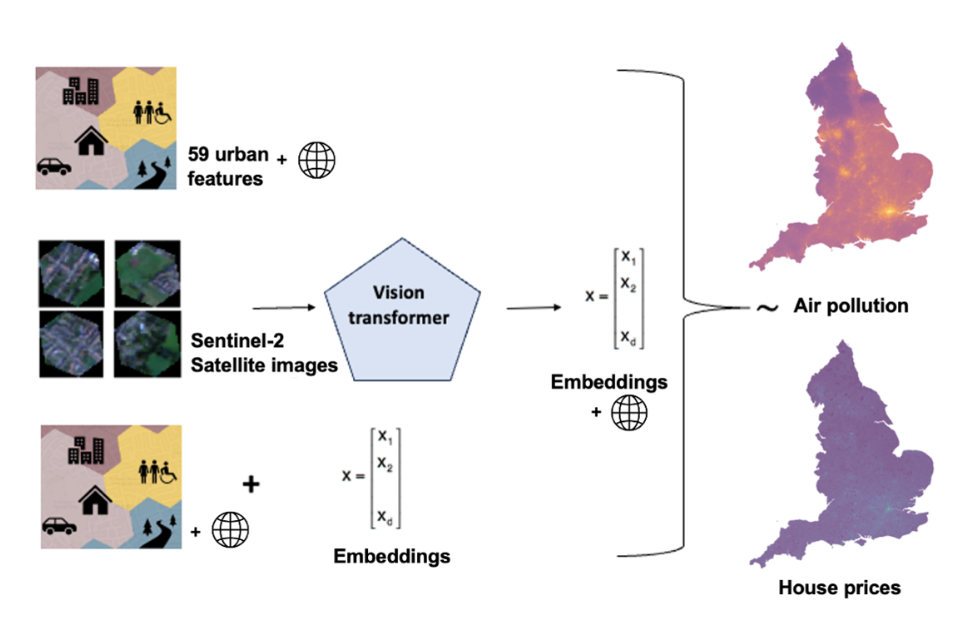
Figure 2: Overview of the three experiments with different data sources as input.
This image illustrates a method pipeline for analysing urban features, satellite imagery, and their relationship to air pollution and house prices in England.
The diagram shows three different data inputs to predict air pollution and house prices.
1. Fifty nine urban features represented by an icon showing buildings, people and trees.
2. Sentinel-2 satellite images (shown as an example with four small aerial views) which are fed into a vision transformer, illustrated by an arrow. The icon representing the vision transformer outputs image embeddings, which are represented as mathematical vectors.
3. The icon representing the fifty nine urban features added to the embeddings, represented as mathematical vectors. All three streams feed into two maps of England showing air pollution and house prices distribution.
The experiment results revealed the following findings for the two urban indicators, air pollution and house prices. The accuracy of each model was assessed by calculating its R2 score with higher values indicating a better model fit. The results of the three different modelling approaches are outlined in the tables below.
Table 1: Air pollution
| Approach | Spatial information | R2 |
|---|---|---|
| Baseline | / | 0.849 |
| H3,res.3 | 0.957 | |
| Satellite embeddings | / | 0.713 |
| H3,res.3 | 0.870 | |
| All data combined | / | 0.862 |
| H3,res.3 | 0.958 |
Table 2: House prices
| Approach | Spatial information | R2 |
|---|---|---|
| Baseline | / | 0.59 |
| H3,res.3 | 0.884 | |
| Satellite embeddings | / | 0.301 |
| H3,res.3 | 0.833 | |
| All data combined | / | 0.619 |
| H3,res.3 | 0.894 |
Findings
Traditionally, accurate assessments of air pollution and housing prices have relied on extensive on-the-ground data collection and complex modelling. However, our findings suggest that satellite imagery alone can provide a powerful alternative or complement to these approaches. This analysis shows that while combining all predictors produced the highest performance, the models that used only satellite embedding models were competitive with the baseline models. The inclusion of spatial information improved the accuracy of each model with notable improvements to the house prices model.
Satellite imagery is particularly useful in areas where ground-based data is limited or unavailable, enabling more frequent and cost-effective monitoring. Despite the relatively low resolution and limited visual information captured in the satellite images, our model was able to extract meaningful insights and generate predictions that closely matched ground-truth data. We found:
-
Standalone satellite image embeddings extracted from low-resolution satellite imagery have remarkable predictive capability and account for a significant portion of the variance in air pollution levels and house prices. This highlights the potential of satellite imagery in studying and understanding complex urban environments.
-
Combining traditional urban predictors with satellite image embeddings enhances model performance for air pollution and house prices. More data leads to better performance, although the improvement is often minimal.
-
The integration of geographical context, such as regional latitude and longitude, improves model accuracy. By accounting for spatial variations through geographic attributes, the model can capture and learn regional differences, further enhancing performance.
-
Low or medium resolution satellite imagery can be leveraged to predict outcomes that are not directly visible within the images. For example, satellite data has been successfully used to generate predictions regarding air pollution levels and house prices, variables that are not explicitly visible within a satellite image. This suggests that satellite-based analysis could have broader applications for estimating a wide range of neighbourhood-level indicators.
Recommendations
Our findings highlight the potential of satellite imagery and satellite image embeddings in understanding and predicting various aspects of urban environments, such as air pollution levels and housing prices. Further research is needed to explore the applicability of this approach to other important factors, such as noise pollution or flood risk, which are also linked to the physical environment depicted in satellite data. We recommend:
-
Further exploration and development of satellite imagery models: The use of low or medium-resolution satellite imagery, combined with deep learning approaches like vision transformers, has shown promise in predicting urban inequality indicators. Continued research and refinement of these models can enhance their interpretability and enable more in-depth analyses through counterfactual simulations.
-
Integration of satellite imagery with urban form and function information: Linking satellite images with data on urban form and function can facilitate the integration of models into scenario-making web tools like DemoLand. This integration would enable policymakers and researchers to simulate the impact of various interventions and policy changes.
-
Longitudinal analysis: Conducting longitudinal analysis using satellite images can track changes in urban environments over time, filling gaps in data sources that are only updated infrequently, such as census data.
-
Incorporation of additional data sources: Incorporating additional data sources, such as environmental indicators, can expand the assessment of outcomes related to climate change and other factors. There is large potential in tapping into the existing UK datasets, including ONS and census data and combining it with satellite images.
-
Development of a toolbox for data scientists: Creating a toolbox that allows data scientists to easily access and download satellite image embeddings for their analyses would facilitate further research and exploration in this field. This toolbox would enable researchers to seamlessly integrate insights from openly available satellite images into their existing models.
-
Models tailored to UK geography and land use: Leverage the UK’s rich datasets to develop vision transformer models for geospatial, ensuring they are tailored to the unique needs of UK geography and land use. Utilising the wealth of open remote sensing datasets and models, even fine-tuning existing computer vision models for specific national applications can be an effective approach.
-
Exploration of UK government-backed foundation models: Explore the potential of foundation models with a built-in understanding of geography and space. Assess the requirements for training new models tailored to specific geographic needs or for adapting existing open-source models through fine-tuning techniques to enhance spatial capabilities. Currently, we rely on models trained by private companies to tap into the potential of vision transformer models for remote sensing. Government-endorsed (open) models or government-backed models (e.g. open models fine-tuned to specific geographic needs) would enable more transparency in terms of model design and data used for training.
Section 2: Broadening the audience
There is a significant potential for data science and AI to support land use policy and decision making but a challenge remains: How to allow non-technical audiences to utilise these increasingly sophisticated models. Non-technical stakeholders such as policy experts, political leaders or members of the public, typically ask questions of data in natural language and require answers in kind. Often this task of translating queries between data, models and language falls to an analyst or data scientist. Such resources are however expensive and are not always available at smaller organisations.
Graphical user interfaces, such as those developed on the DemoLand project, are designed to bridge this gap by providing intuitive inputs that allow users to express queries to these models and receive answers in the form of interactive charts, graphs and maps. While such interfaces improve on the simple display of tabular data, they still need to be translated and distilled into policy-ready insights.
Over the past three years, LLMs have emerged as a promising new tool that allow automated systems to interact with users through natural language queries. These models are trained on vast amounts of data to predict the next word in sequences of text. They have exhibited impressive capabilities in many text-based tasks such as language translation, code completion, knowledge retrieval, conversational interfaces and even simple reasoning. However, they also exhibit negative behaviours such as a tendency to generate and confidently present false facts, called hallucinations.
To explore the technical challenges, opportunities and associated risks of deploying LLMs in policy-informing tools, a chatbot based interface was developed for the DemoLand tool. The interface allows users to engage in a conversational interaction with the tool, posing queries about the selected planning scenario and receiving answers in plain text. This approach was selected from several possible ways that LLMs could be deployed because it is a mode of interaction which is increasingly familiar to users. Many websites employ chatbot-like interfaces which connect a user to an AI or human agent for help.
Other potential opportunities for the use of LLMs, which were not implemented but may be useful for future exploration, are detailed in Appendix A. Figure 3 shows how the chat interface was implemented alongside the existing charts and graphs. Figure 4 shows an example of a typical user interaction with the chatbot.
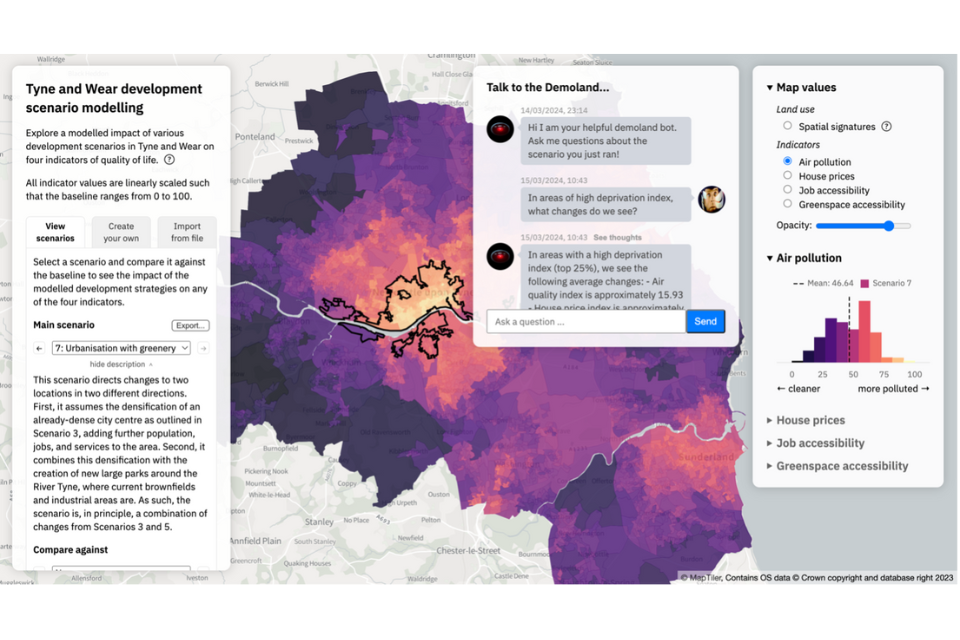
Figure 3: The DemoLand tool with the addition of the chatbox interface An example chat session between a user and the LLM agent An image showing the Demoland web interface. It shows a map of the greater Newcastle area with a colour scale showing the amount of air pollution across the city. Overlaid on top of this is the AI chat bot window showing a user asking a question and the LLM agent responding.
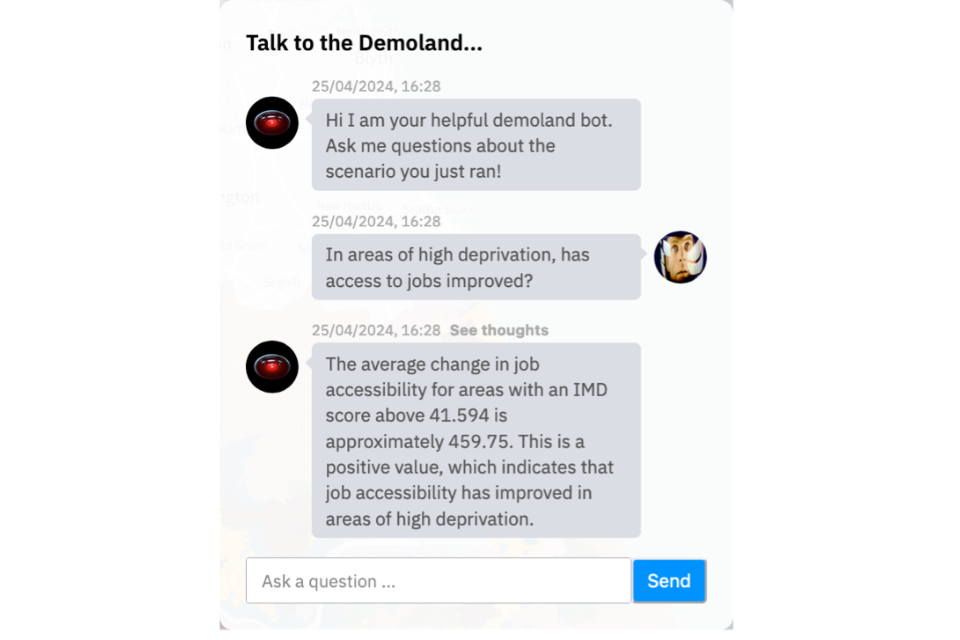
Figure 4: An image showing an example exchange between the LLM agent and a user. The user asks the question “In areas of high deprivation, has access to jobs improved”. The agent responds “The average change in job accessibility for areas with IMD score above 41.594 is approximately 41.594. This is a positive value, which indicates that job accessibility has improved in areas of high deprivation.
The technical implementation consisted of the development of a geospatially aware LLM agent which coordinated the interaction between a commercial LLM, in this case OpenAI’s ChatGPT 4.0 and several datasets and tools. The agent was accessed through an application programming interface (API) server which received input from, and sent replies to, the user interface. Some examples of the range questions and responses the chatbot supported are outlined here.
Question: What is the average change in air quality?
Answer: The average change in air quality, as measured by the air pollution index, is approximately 0.08. This means that, on average, air quality has slightly improved in the areas under consideration.
Question: In areas of high deprivation has access to jobs improved?
Answer: In approximately 15.4% of the areas with high levels of deprivation, job accessibility has improved. This suggests that while some progress has been made, there is still a significant proportion of high deprivation areas where job accessibility has not improved. It’s important to continue efforts to improve job accessibility in these areas, as this can play a key role in reducing deprivation.
Question: How has air quality changed around schools?
Answer: Sure, let’s take a look at the changes in air quality around some schools:
- St Joseph’s Roman Catholic Aided Primary School: The air pollution index has increased by 0.1074 units. This school is located in Gateshead.
- Newcastle Bridges School: The air pollution index has increased slightly by 0.0479 units.
- Alternative Education Service - The Beacon Centre: There has been no change in the air pollution index at this location in South Tyneside.
- Yamaha Music School: Similarly, there has been no change in the air pollution index at this location in North Tyneside.
- New Silksworth Academy Junior and Infant: Both these schools, located in Sunderland, have also seen no change in the air pollution index.
Please note that these changes are relative to the current air pollution index at each location.
Behind the scenes, the LLM agent uses the LLM to propose and execute a sequence of actions in response to user queries, acting like an analyst or data scientist by orchestrating resources to generate answers and provide ongoing guidance to the LLM. The following illustrates this process for a prompt given to the DemoLand agent:
User prompt: “In areas of high deprivation, has access to jobs improved?”
Agent: “Given the following tools [description and usage of available tools] determine how to answer the following question
Question: “In areas of high deprivation, has access to jobs improved?”
LLM Response: “To answer this question, we need to look at the change in job accessibility in areas with high deprivation. The Index of Multiple Deprivation (IMD) score can be used as a measure of deprivation. Let’s consider areas with an IMD score above a certain threshold as areas of high deprivation.
Let’s calculate the average change in job accessibility for these areas. This can be calculated by tuning the following python code with the python tool:”
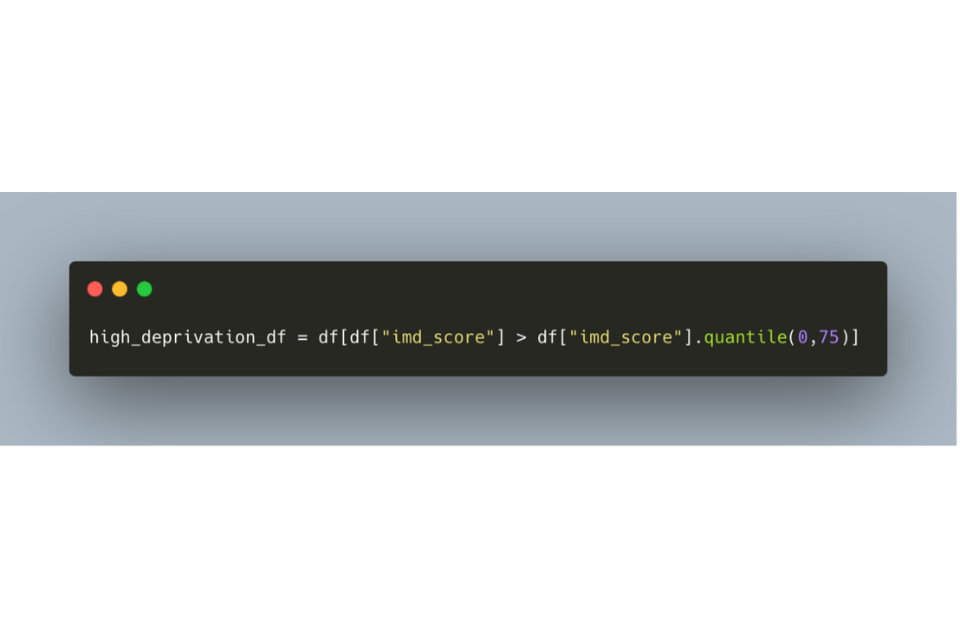
Image above shows a terminal window showing a snipped of python code. The code shows the pandas data frame operation which selects regions with an IMD score greater than the 75th percentile and stores them in a variable “high_deprivation_df”.
Agent: Runs the python code using the python tool and returns the result to the LLM.
LLM Response: “Next we need to calculate the average of the high_deprivation_df dataframe. This can be done by running the following code in the python tool:
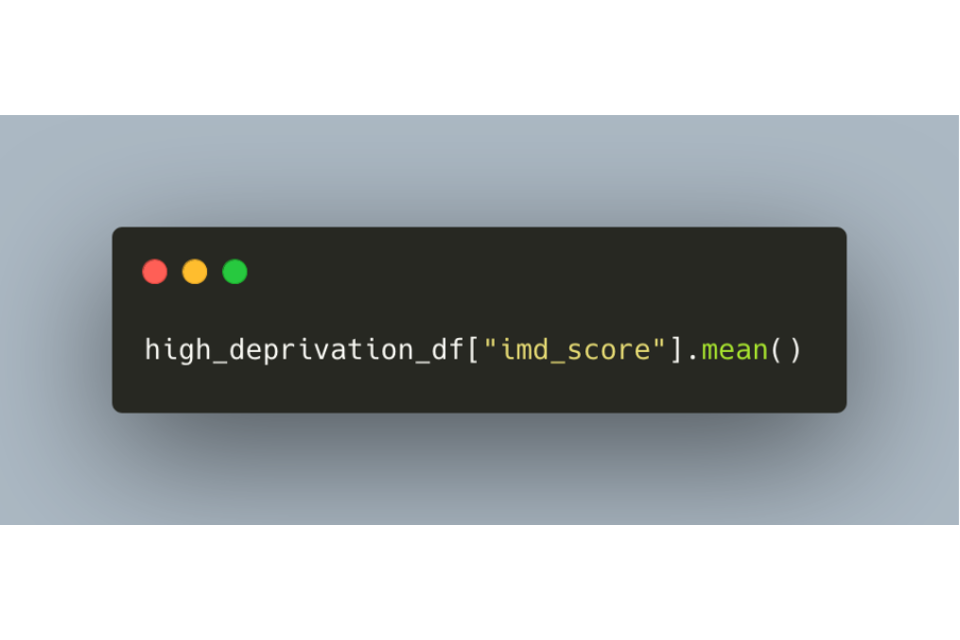
Image above shows a terminal window showing a snipped of python code. The code calculates the mean of areas with a high IMD score by applying the mean function to the high_deprivation_df dataframe.
Response to user: “The average change in job accessibility in areas of high deprivation is approximately 459.75. This suggests that access to jobs has improved in these areas. However, the extent of improvement and its impact on the overall deprivation level would require a more detailed analysis.”
Findings
Limitations of LLMs for geospatial data
Several limitations of standard LLMs were identified when implementing a chatbot capable of answering users’ questions about land use scenario change. Many of these are known limitations of LLMs in general, but several are specific to the geospatial nature of land use planning.
- LLMs are only aware of information that they are trained on. This means that they have no access to the data which represents the proposed scenario or its outcomes.
- LLMs have little understanding of geography or the relationships between geographical entities within the study area. This makes it hard for them to interpret questions that involve reference to specific spatial features or areas.
- LLMs have no information, such as statistics about different populations within the areas of interest, with which to contextualise the questions being posed.
- The outputs of the core DemoLand predictive model are numeric tables detailing the impact of a land use change on quality-of-life measures. A key task which the LLM must perform to answer questions related to the scenario is therefore the manipulation and summation of numeric data. While LLMs are excellent at manipulating language, they are not well equipped to manipulate numeric data and often provide incorrect answers when presented with data as text.
A common approach to solve these issues is to develop LLM agents which orchestrate interaction between the LLM and other resources, such as external knowledge bases (Retrieval Augmented Generation) and computational tools (tool calling), to enhance capability and reliability.
Instead of directly asking the LLM a query and expecting it to answer from the knowledge they were exposed to at the time of their training, they are instead provided a list of tools with examples for their use and asked to develop a set of steps which utilize these tools to answer the user’s query.
The agent developed for the DemoLand interface included the following tools:
- A tool that allows the LLM to execute python code to combine, manipulate and summarise several different datasets. These datasets include the outputs of the predictive DemoLand model, contextualising datasets such as the names and extents of neighbourhoods and statistics about different populations within the study area.
- A tool that allows the LLM to execute python code to perform spatial queries on the provided datasets. This is key to allowing relational insights into the data that involve the distances between locations and where different features are located.
- A tool to obtain the details of features and points of interest (schools, parks, businesses etc) from external sources. In addition to the datasets made available through the python interface, the LLM was given a tool to make queries against the Open Street Map API allowing it to gather information of what is present in specific geographic regions.
Given these tools and a query posed by the user, the LLM agent orchestrates a chain of calls to the LLM, asking it to propose a set of steps that would answer the question. The agent then executes these steps in feeding the results back to the LLM for future guidance. In this way the LLM agent mimics the role of an analyst or data scientist. Its role is not to answer the question directly but to orchestrate the usage of several resources to answer the question.
Increase user confidence through transparent feedback
Driving the adoption of LLMs in land use planning will depend on fostering users’ confidence in the reliability and accuracy of their answers. Many of the users who tested the DemoLand chatbot expressed concern at not knowing how the LLM answered their questions. This was exacerbated by the inclusion of information they did not expect the model to have access to, for example school locations through the Open Street Map API tool.
This feedback led to the inclusion of a ‘thoughts’ button on the user interface, which allowed a user to see the reasoning chain the LLM had used to answer a specific question. Making the reasoning of the tool transparent and allowing the user to audit the logic of how a response was arrived at, mitigated user fears and increased their confidence in the tool. One limitation of the reasoning tool is its potential complexity and interpretability. Despite offering a reasoning chain, the tool’s outputs may be challenging for non-technical users to fully comprehend.
Tone and delivery
For users to embrace the use of conversational interfaces for land use planning, not only should the LLM agent provide accurate and trustworthy responses, but it needs to do so in language and tone that is appropriate for the audience. A policymaker may want the response from the LLM to be focused on language useful for lawmaking, including many specific statistics for multiple regions, while an interested member of the public may prefer fewer details and more of a summary in response to their question.
LLMs have the capability to respond to inquiries from individuals in diverse styles and personas. Instructions dictating the tone and delivery of the response are embedded within the prompt provided to the LLM. The prompt used to guide the tone of the DemoLand agent was designed to compromise between providing excessive detail and over summarizing results. Selecting the appropriate tone and delivery of an LLM for a given audience, is a key determinant of its success with that audience. The guidance it was given was:
You are very powerful geospatial assistant, but don’t know current events. If asked about places physical locations you don’t know, for example schools, hospitals, grocery stores etc, use the find_points_of_interest tool to look them up. Make your responses conversational as if you were reporting them in a talk. If asked to report changes only report nonzero changes.
LLMs as a way of combining data from disparate sources
Land Use and other geospatial use cases interact with multiple domains and sources of information. The land use classifications used in DemoLand are derived from over fifty nine different variables derived from multiple data sources. Combining disparate sources to gain insight into a given question requires a skilled data scientist or analyst to not only have a knowledge of where such data can be found but also to understand how to work with different data formats and how they can be meaningfully joined together.
Providing an LLM agent with a set of tools for access data and its associated metadata, may present a way of automating this process. An LLMs ability to translate between different data formats, for example CSV to JSON, is also a benefit in bridging different data formats.
Recommendations
The DemoLand chatbot demonstrates that LLM agents, if augmented with tools and access to appropriate datasets, can facilitate natural language interactions with complex models and data. To continue to explore their use in this field we recommend the:
1.Development of a toolkit for building geo-aware LLM agents. A software library that enables the rapid prototyping of geo-aware LLM agents should be developed to allow for increased exploration of their utility in the land use sector. This package should include:
a. Scaffolding for geo-aware agents that allow them to interact with several underlying LLM models.
b. A collection of tools that allow that agent to programmatically access common data sources like those held by the census and the Office for National Statistics.
c. A collection of tools that allow agents to perform the geospatial manipulation of data and calculate spatial statistics of such data.
d. A set of priming prompts that can customise the tone and delivery of the agents output for different audiences.
e. Evaluation tools that help monitor the accuracy of the outputs of agents.
2.Identification of common challenges where LLM can provide value.
The creation of LLM based solutions to problems in the land use space should be driven by real world well scoped problems. We recommend that further work be carried out to identify common workflows, tasks and issues where LLMs could have a substantive impact. By building prototypes to solve these problems, we will further define the solution space in which LLMs can provide value and grow expertise in their development and use.
3.Promotion of open LLM models.
We recommend that future work focus on open source, local LLM models. The DemoLand agent was built using ChatGPT 3.5 and ChatGPT4 as the underlying LLM. The principal motivations for using these commercial closed source models were that they provided, through their APIs, a fast way to start experimenting with LLMs and are seen as some of the most capable models currently available. There are significant downsides to being tied to closed commercial models.
a. The companies that build these models often retrain them with new data leading to a lack of control and the consistency the products built on them.
b. There is a lack of transparency in how these models are trained.
c. In commercial settings there may be restrictions on what data can be exposed to a third-party API.
4. Promotion of research into the utility of advanced LLM methods.
The agent built for DemoLand primarily relies on two techniques for interacting with LLMs: Retrieval Augmented Generation (RAG) and Chain of Thoughts (CoT) prompts. These methods produced accurate answers to a wide range of questions but there are many other advanced methods for interacting with LLMs. We recommend the funding of future work to explore and develop new advanced methodologies for interacting with LLMs in geospatial contexts.
Section 3: Cross-cutting challenges and opportunities for geo AI
In this section we present the cross-cutting challenges for geospatial AI. These are drawn from the work described in sections one and two and feedback from the broader community gathered at two workshops.
Strategic challenges
One of the core shifts in AI over the past three to four years has been the emergence of foundational models. In the language space this has been in the form of LLMs, while in the Earth observation sector it has been in the form of foundational satellite image models.
These models differ from previous models in that they are designed to be useful for a range of tasks either out of the box or with tuning. This allows the computationally intensive and expensive training to happen once and for many downstream uses to derive value from it. This represents a huge opportunity that opens the door to utilising powerful models without the cost and burden of training them from scratch for every application. However, there are potential challenges:
-
The user is tied to the choices that their creators made about, for example, what data was used to train them and the architecture of the model structure. If closed source models are utilised, it may be hard to fully identify these choices and understand their impact.
-
Models that are closed source and made available over API interfaces are subject to change over time. There have been notable instances of third-party model providers retraining or updating a model which can have unintended consequences for those using it in applications.
-
Many of these models are trained by large for-profit entities with their own goals, which may or may not align with the goals of land use applications.
One approach to mitigating these challenges is to train open foundational models specifically designed for geospatial applications. The resources required for such an endeavour are likely prohibitive and would require a large investment of resources and collaborative effort from several partners. Another approach would be to build the tools that extract value from these foundation models in a model agnostic way. If one model becomes less desirable to use over time, then the tools developed can easily be migrated to newer or more appropriate models.
Organisational / operational challenges
The development of geospatial AI tools and understanding where they can provide value and impact is the priority. However, it is also important to deploy these tools in a sustainable and cost-effective way. While most of the computational costs associated with geospatial AI tools occur upstream in the training of foundational models, there are still significant computational and infrastructure requirements associated with the downstream fine-tuning of the models and running them in response to user queries.
The LLMs which power the DemoLand agent incur nontrivial costs as they must access the ChatGPT API. The training required to harness the power of the foundational satellite model, likewise, requires significant GPU resources. These costs could constitute a challenge to the wide scale adoption of this technology, especially by resource constrained organisations.
An additional challenge exists in licensing the data required for retraining these models. The work presented in Section one utilises publicly available Sentinel-2 data. While this low-resolution imagery works better than expected, other use cases are likely to require higher resolution imagery which can be expensive and come with licensing restrictions.
Access to the geographically contextualising data that will power LLM agents is often only available through APIs. These APIs often have a charge associated with their use and may also have specific usage licences to consider. There is an opportunity for a central body to help organise both licensed access to data and the compute infrastructure required to develop geospatial AI tools.
Technical knowledge and skills challenges
To successfully deliver the value of AI in land use and other geospatial applications will require knowledge and experience from multiple disparate disciplines. An individual working in this area needs to combine proficiency in cutting-edge AI techniques, many of which have emerged only in the last few years, with a foundational knowledge of geography and geospatial.
Working with the large amounts of data required by foundation models and LLMs also requires practical knowledge of distributed computer systems and complex GPU processing and the ability to manage and orchestrate such infrastructure. For AI researchers, there are barriers inherent in utilising and understanding the challenges of geospatial data.
While it is a considerable challenge to bridge this knowledge and skills gap, there is an opportunity to convene organisations to promote interdisciplinary learning through workshops, conferences and online material.
Appendix A - User stories for LLM use in DemoLand
This section explores potential uses of large language models (LLMs) in DemoLand. User personas are defined to capture the background, motivations, and expertise of each user type. Each scenario is described in the following terms:
- User Personas effected: Which user stories the scenario targets.
-
Proposal Type: How would the LLM be used in this scenario?
Batch: run on a lot of data at once
Live: the LLM is run as the user uses the tool
Interactive:the users converse with the LLM
- Requires additional geographic context: Does this use of an LLM require access to geographic data to provide context that is not currently available in DemoLand.
- User story: A step by step description of how a user would interact with the DemoLand tool under this scenario.
- Potential benefits: What benefits does this scenario provide over the baseline DemoLand tool.
- Potential issues: What are some of the dangers of using an LLM in this way.
Our general principles in producing these scenarios are:
- Make DemoLand more approachable to non-data science / academic users by incorporating natural language interfaces to the model inputs and outputs.
- Leverage LLMs to lower the effort required to move DemoLand to new regions.
- Where LLMs are used, as much as possible there should be a human in the loop to verify their inputs and outputs.
User personas
These are meant to describe the profiles of different users of DemoLand so we can focus on how new features involving LLMs might empower each of them.
Policy maker
- Understands problem space from practical and political perspectives.
- Limited understanding of model internals.
- Prefers summaries over raw data.
- Can describe changes verbally but lacks time and ability to configure scenarios directly.
Analyst
- Understands the problem space from a practical point of view and less of a political perspective.
- Has background context knowledge which might not be captured in the data from DemoLand.
- Has some data abilities but is more comfortable in basic data tools (Excel rather than python).
- Can look at proposed scenarios and their output and assess the results.
- Comfortable generating scenarios through the user interface (UI) but would love anyway to speed that process up.
DemoLand team member/researcher
- Helps maintain DemoLand.
- Is involved with setting up DemoLand for different regions.
- Understands the model inputs and outputs, how to build scenarios using either the interface or manually in data files.
- Might not understand the local context of a DemoLand implementation: What is happening in the city, local knowledge about regions not captured by data, political realities in the region.
General public/local resident
Scenarios
Proposal one: Produce output summaries for existing curated scenarios
User Personas effected: Analyst, Policy Maker
Proposal Type: Batch
Requires additional geographic context: Yes
User story
- The user loads the DemoLand website with the aim of exploring the curated scenarios.
- They select “scenario two: mid-density mixed neighbourhood” and read the description of the proposed changes.
- Under the scenario input descriptions, they see a section labelled impacts which has the following LLM generated summary:
“Under this scenario, people who live near the city centre have better access to green space. This has created an increase in house prices near the city centre. People living in lower income neighbourhoods at the outskirts of the city also see a negative impact on air pollution in their neighbourhoods.”
- After reading this summary, the user potentially follows up and verifies the results using the charts and graphs in the user interface.
Potential benefits
- Generating summaries of scenario outputs requires expert knowledge of the data, the model outputs and the wider context of the region and so are resource constrained in producing them for each curated scenario. An LLM approach would allow us to scale these up. Instead of using an expert’s time to write the summaries, that person could simply validate the outputs tweaking them with reference to the model results if needs be.
- The benefit for an end user is that it gives them a starting point and overview of the changes. In some situations, this might be sufficient for their understanding, in others it can provide a good starting context through which to explore the data more thoroughly in the interface.
Potential issues
- The LLM summary might not capture the full impacts of the scenario, leaving out potentially negative or positive impacts for some populations. This might be ok if there is sufficient checking of the data.
- The LLM summary might make mistakes in its summary of the output. With sufficient checking by an expert this should be able to be mitigated.
- Having access to a summary of the data might disincentivise further / deeper exploration of the data.
Technical challenges
- Providing the LLM sufficient geographic context to allow it to describe the results of the scenario in a way that people might be challenging.
Proposal two: Generation or refinement of scenarios
User Personas effected: Policy Maker
Proposal Type: Interactive / one off query
Requires additional geographic context: Yes
User story
- A policy maker loads the DemoLand website with the aim of understanding the potential impact of a new policy.
- They look through the existing scenarios and find one which is close to what they are proposing.
- They select an option to modify the scenario.
- They enter the following instruction into a prompt box:
“Change this scenario to include more new homes near parks within the city.”
- The LLM generates a new set of scenario parameters given the old scenario and the requested changes.
- The policy maker is still not 100% happy with the changes and has the option to refine the scenario either by entering another prompt or by making small changes using the existing UI.
Potential benefits
- Most policy makers / decision makers don’t think of changes to scenarios in terms of data but in terms of policy decisions or descriptive changes.
- These are hard to translate into model inputs and currently would require either an analyst to interact with the UI to translate the policy change to model inputs or do so using data science tools to generate the inputs.
- Getting a LLM to generate the scenario inputs potentially allows a policy maker to explore many more scenarios, increasing the usefulness of the tool.
Potential issues
- Language is a pretty blunt tool to use to describe the desired changes to the scenario. There might be multiple valid ways of interpreting a request for a policy change.
- The LLM might not produce particularly accurate scenarios given an input prompt.
- The LLM might not produce particularly novel or interesting scenarios given an input prompt.
- There may be systematic bias in the way an LLM interprets a scenario change request.
- A policy maker would need to spend time validating the proposed scenario by interpreting the charts and maps which it represents. Skipping this step and blindly trusting the LLM scenario might lead to misleading interpretation.
Proposal three: Simple summarisation of histogram results
User Personas effected: Policy Maker
Proposal Type: Single query
Requires additional geographic context: No
User story
- A policy maker loads the DemoLand website with the aim of understanding the potential impact of a new policy.
- They select a scenario that an analysis has prepared and look at the impacts of that scenario compared to the baseline scenario.
- They select the air pollution tab for the visualisation output.
- Under each histogram showing the changes for the outcome variables they see a description of how that variable has changed between the baseline scenario and the proposed new one.
Potential benefits
- Interpreting histograms comparing scenarios can be challenging if you’re not used to looking at them. This would provide a simple description of the changes to aid interpretations.
Potential issues
- LLM might not give an accurate description of the changes.
- It might miss some subtlety in the changes, perhaps just describing the shift in the mean of the distribution without describing the tails for example.
Proposal four: Generation of custom scenario input and output descriptions.
User Personas effected: Analyst
Proposal Type: Single query
Requires additional geographic context: Yes
User story
- An analyst uses the main UI to create a new scenario by selection and change the signatures in multiple different areas of the map.
- Once they have made their changes, the LLM generates a text-based summary of their proposed scenario:
- “This scenario shows what would happen if industrial areas of the city were converted into a mix of green space and new housing.”
- They don’t quite feel like the scenario has captured their inputs and so they edit the text to better capture the intent and description of the changes.
- They run the model and are presented with the usual results, the map histograms etc, but also with a written summary of the model outputs. Something like the following:
“Compared to the baseline scenario, house prices in industrial areas have increased by a factor of two while house prices in the city centre have fallen. Air pollution for the entire city has been improved as has access to green spaces.”
- They take screenshots of the charts and maps and copy and paste the summary as part of a report, making minor tweaks to the produced output.
Potential benefits
- Writing descriptions of both scenario descriptions and of the resulting outputs can be difficult from scratch. Allowing a LLM to generate starting points to both could save a lot of time on the analyst side and potentially surface insights that they might have missed.
Potential issues
- LLM might not give an accurate description of the changes or the scenario but if an analyst is in the loop these should be caught.
- The LLM descriptions might bias an analyst’s own thoughts on a scenario, leading them to not explore alternative interpretations or having their own interpretations influenced in inaccurate ways.
Proposal five: Area descriptions
User Personas effected: Policy Maker
Proposal Type: Single query
Requires additional geographic context: Yes
User story
- A policy maker has generated a scenario and notices that an area of the city has much worse air pollution rates under this scenario.
- They are personally unfamiliar with that area and want to better understand who will be affected by the changes.
- They select the area in the interface and the UI provides them with a plain text summary of demographics and built landscape within that region.
- The policy maker uses this to inform revisions to the scenario and to help determine if it should be adopted.
Potential benefits
- Providing quick insight into demographics and other relevant data can enhance decision making. Instead of having to digest several charts, a quick summary of the groups living in the region derived from census data can give important digestible context to help inform decisions.
Proposal six: Generative images
User Personas effected: All
Proposal Type: Single query
Requires additional geographic context: Maybe?
This proposal has two versions: a static one working with pre-defined scenarios, and a dynamic one with user-generated ones.
User story
- A user is working with a scenario, examining details, and exploring what these changes look like (numerically).
- They may not be familiar with the area, or they may want to get a better perspective of what the changes would look like if implemented.
- The tool presents an aerial image of the area currently selected for change under the scenario.
- An option is given to the user to compare such image with one generated by the system of what the area would look like if the changes were implemented.
Potential benefits
- Visual representation of changes is an effective way to get non-technical audiences to understand how a proposed scenario would change a place.
Potential issues
- This not only requires an LLM, but a genAI algorithm for image generation, or a multimodal LLM.
- The image generated might not be representative of the changes, or not in the expected way.
- The image generated may make the place look like a different one, not because of changes implemented but because of the inner workings of the algorithm.
-
Lewis, P., Perez, E., Piktus, A., Petroni, F., Karpukhin, V., Goyal, N., Küttler, H., Lewis, M., Yih, W.T., Rocktäschel, T. and Riedel, S., 2020. Retrieval-augmented generation for knowledge-intensive nlp tasks. Advances in Neural Information Processing Systems, 33, pp.9459-9474. ↩
-
Rolf, E., et al. (2021). A generalizable and accessible approach to machine learning with global satellite imagery. Nature Communications, 12(1), 4392, https://doi.org/10.1038/s41467-021-24638-z. Yeh, C., et al. (2021). SustainBench: Benchmarks for Monitoring the Sustainable Development Goals with Machine Learning. arXiv:2111.04724 [cs] http://arxiv.org/abs/2111.04724 ↩