Gender Pay Gap Report 1 April 2022 to 31 March 2023
Published 30 November 2023

© Crown copyright 2023
This publication is licensed under the terms of the Open Government Licence v3.0 except where otherwise stated. To view this licence, visit nationalarchives.gov.uk/doc/open-government-licence/version/3 or write to the Information Policy Team, The National Archives, Kew, London TW9 4DU, or email: psi@nationalarchives.gov.uk.
Where we have identified any third party copyright information you will need to obtain permission from the copyright holders concerned.
This publication is available at https://www.gov.uk/government/publications/gender-pay-gap-report-2022-to-2023/gender-pay-gap-report-1-april-2022-to-31-march-2023
Foreword
The CMA is committed to being a diverse and inclusive employer, with a breadth of experience, knowledge and outlook that is representative of the communities we serve. We believe that by making all our colleagues feel welcome and included, they will deliver the best possible outcomes for the benefit of people, businesses and the UK economy. We have an ambitious Equality, Diversity and Inclusion Strategy 2020 to 2024 and Action Plan that support our aim to be a great employer that values and welcomes the different ideas, skills and experiences of our colleagues.
Our Gender Pay Gap Report 2022 to 2023 provides us with an insight into how we are living up to this commitment. This year we have seen a reduction in our ordinary pay gaps compared with 2021 to 2022 and a significant reduction in our mean bonus gap. While we acknowledge these positive changes, we are ambitious to reduce our pay gaps further. The primary factor that contributes to our gender pay gap continues to be the underrepresentation of women in our most senior grades and we must do more to understand how we can support female colleagues to join, retain and develop and progress their careers within the CMA.
The CMA’s Board and Executive Committee are committed to delivering change and in March 2023 we published our Equality, Diversity and Inclusion Action Plan 2023 to 2024 which sets out the ambitious programme of work to deliver our strategy, and to address our pay gaps. It focuses on 5 thematic areas:
- recruitment and grow our own
- career progression and development
- improving representation
- pay and reward
- culture of inclusivity
While it is too soon to see the impact of these actions in this Gender Pay Gap report, and indeed our plan includes some long-term initiatives that may take time to realise an impact on pay, we believe these actions will make the CMA a truly inclusive and representative place to work.
Sarah Cardell, Chief Executive, Amelia Fletcher, Non-Executive Director and Wellbeing, Inclusion, Diversity and Equality Steering Group (WIDE) Chair
Introduction
The CMA is an independent non-ministerial UK Government department and is the UK’s principal competition and consumer protection authority. We help people, businesses and the UK economy by promoting competitive markets and tackling unfair behaviour.
This report sets out the CMA’s gender pay gap and how we plan to address the gap.
Background
In 2017, the Government introduced world-leading legislation that made it statutory for organisations with 250 or more employees to report annually on their gender pay gap. Government departments are covered by the Equality Act 2010 (Specific Duties and Public Authorities) Regulations 2017 which came into effect on 31 March 2017. These regulations underpin the Public Sector Equality Duty and require relevant organisations to publish their gender pay gap data by 30 March for the preceding financial year.
The statutory pay measures contained in this report are:
- the mean and median gender pay gaps
- the mean and median gender bonus pay gaps
- the proportion of men and women who received bonuses
- the proportion of male and female employees in each pay quartile
The gender pay gap shows the difference in the average pay between all men and women in a workforce. If a workforce has a particularly high gender pay gap, this can indicate there may be a number of issues to deal with, and the individual calculations may help to identify what those issues are. Where there is a positive percentage, this means that the pay of male staff is higher than the pay of female staff. The higher the percentage, the greater the gender pay gap.
The gender pay gap is different to equal pay. Equal pay deals with the pay differences between men and women who carry out the same jobs, similar jobs or work of equal value. It is unlawful to pay people unequally because of their gender.
The CMA supports the fair treatment and reward of all staff irrespective of gender. This report sets out the CMA’s statutory requirements under gender pay legislation, extended analysis of our gender pay gap by grade and the CMA’s action plan to tackling any arising issues.
Gender profile of the CMA
At 31 March 2023, the CMA had a total of 882 staff in the UK with 16 staff based in Belfast, 11 in Cardiff, 3 in Darlington, 68 in Edinburgh, 768 in London and 16 in Manchester. This is the number of staff deemed to be ‘full pay relevant’; those employees who are not being paid or are on reduced, statutory or no pay during March 2023 are excluded, as they are not ‘full pay relevant’ employees.
The gender profile of full pay relevant CMA staff as of 31 March 2023:
Figure 1: CMA Gender Profile by workforce as of 31 March 2023
| CMA Workforce | Total staff | Men | Women |
|---|---|---|---|
| AO to Grade 6 | 759 | 50.1% | 49.9% |
| Senior Civil Service | 123 | 58.5% | 41.5% |
| All staff | 882 | 51.2% | 48.8% |
Figure 2: CMA Gender Profile by grade as of 31 March 2023
| Civil Service grade | Total staff | Men | Women |
|---|---|---|---|
| AO | 26 | 50.0% | 50.0% |
| EO | 57 | 40.4% | 59.6% |
| HEO | 156 | 45.5% | 54.5% |
| SEO | 67 | 53.7% | 46.3% |
| Grade 7 | 238 | 51.7% | 48.3% |
| Grade 6 | 215 | 53.0% | 47.0% |
| SCS PB1 | 98 | 58.2% | 41.8% |
| SCS PB2 and PB3 | 25 | 60.0% | 40.0% |
| All staff | 882 | 51.2% | 48.8% |
The gender profile of CMA staff is 51.2% men and 48.8% women. This is a slight decrease in female representation since 2021 to 2022 when 49.2% of staff were female. This can be attributed to fewer women than men joining the organisation in 2022 to 2023 where 49.2% of new joiners were women.
Looking at our Senior Civil Servants (SCS) community, the proportion of male to female staff has also changed since 2021 to 2022. The proportion of female SCS staff increased slightly from 41.1%% to 41.5% in 2022 to 2023. This can be attributed to higher percentage of men leaving the CMA at SCS level.
We know that an over representation of women in the lowest pay quartile as well as an under representation of women at the highest pay quartile is a cause of the gender pay gap across the Civil Service[footnote 1]. Looking at our gender profile more closely, this is the same for the CMA.
Improving the gender balance in senior grades will be 1 of the key ways in which we will reduce the pay gaps at the CMA.
Calculating the gender pay gap
Ordinary pay
Ordinary pay, expressed as hourly pay, is used to calculate the mean and median gender pay gaps. Ordinary pay includes basic pay, any allowances and any bonus payments made in March 2023. Salary sacrifice amounts are deducted from this value.
The calculation for the mean and median ordinary pay only includes ‘full pay relevant’ employees, as described in paragraph 9.
The gender pay gap calculations are based on the number of individual employees, and not on full-time equivalents. This means that each part-time employee counts as 1 employee.
The following table shows the mean pay gap (which is the difference between the average hourly pay between men and women) and the median pay gap (which is the difference between the median hourly pay of men and women):
Figure 3: CMA Gender Mean and Median Pay Gaps for the last 3 years
| Measure | 2022 to 2023 | 2021 to 2022 | 2020 to 2021 |
|---|---|---|---|
| Mean pay gap | 6.8% | 8.9% | 6.7% |
| Median pay gap | 5.9% | 6.3% | 5.5% |
Both the mean and median ordinary pay gaps decreased from 2021 to 2022, where the mean pay gap reduced by 2.1 percentage points in 2022 to 2023, and the median pay gap reduced by 0.4 percentage points. The pay gaps are now similar in value to 2020 to 2021.
As a small department, we know that our gender pay can be affected by small changes to our gender representation and pay. Some of the factors that have contributed to the ordinary pay gaps decreasing in 2022 to 2023 are:
-
although the gender profile of the ‘full time relevant staff’ has seen a decrease in the female split from 49.2% to 48.8%, since 2021 to 2022 there is a greater percentage of female colleagues at Grade 7 and SCS PB 2/3 which increased the average pay for female employees in 2022 to 2023. Additionally, AO and SEO grades have seen an increase in the percentage of male employees, lowering their average pay across the workforce during this reporting period
-
in 2022 to 2023 men accounted for 51.5% of leavers compared to 43.2% in the previous 12-month period. We also note that a higher proportion of leavers from our senior grades (Grade 7 to SCS PB3) were men equating to 58.8% of all male leavers.
-
the grade profile of joiners was more balanced this year. Of the 195 employees who joined the organisation in 2022 to 2023, 50.8% were men (53.4% in 2021 to 2022) and 49.2% were women (46.6% in 2021 to 2022). The profile of joiners at Grade 7 and above was also more evenly matched, where 48.3% of joiners at these grades were women and 51.7% were men
-
changes to the profile of those receiving Digital, Data and Technology (DDaT) capability-based allowances. These allowances are targeted to specific DDaT roles, which attract a premium in the market due to their relative scarcity, with the aim of attracting and retaining permanent staff in these roles. Staff in eligible roles, as defined by the Government Digital Service, are required to evidence their skill level corresponding to essential DDaT skills. In 2022 to 2023, of those staff who received allowances, 72.0% were men. In addition, DDaT allowances for men are, on average, 11.39% higher than women due to larger numbers of men at more senior grades receiving a DDaT allowance, in addition to their awards being based on a higher capability level (this figure is an improvement from 2021 to 2022 where this figure was 30.8%). The average allowance paid to male staff was 10.23% higher than the allowances provided to female staff
Figure 4 below shows the mean and median gender pay gaps for 2022 to 2023 broken down by grade:
Figure 4: Mean and median gender pay gaps by grade for 2022 to 2023*
| Civil Service grade | Mean pay gap | Median pay gap |
|---|---|---|
| AO | 0.7% | 2.5% |
| EO | 0.7% | 4.5% |
| HEO | -0.5% | -0.9% |
| SEO | 0.5% | 0.5% |
| Grade 7 | 0.4% | 1.7% |
| Grade 6 | 0.9% | 0.2% |
| SCS PB1 | -0.8% | 0.3% |
| SCS PB2 and PB3 | 2.9% | 1.9% |
| All staff | 6.8% | 5.9% |
Looking at the mean and median gender pay gap analysis by grade, the differences are relatively small, with the majority of the gaps being less than 1% across grades AO up to and including SCS PB1. This indicates that while there is an overall pay gap it is primarily driven by an underrepresentation of female staff at higher SCS pay bands, as the ordinary pay received by male and female staff is relatively equal within grade. The largest gap is the median pay gap at EO grade. 2 thirds of EOs recruited in 2022 to 2023 were female, which contributed to this as there are more women at the lower end of the pay range for this grade.
Our Pay Policy sets out rules for salaries on appointment which limits starting salaries to the grade minimum up to the grade midpoint; this has the effect of limiting differences in pay between existing staff and new starters which also has the potential to negatively impact our pay gaps. The decision to award a flat 3% increase to grades AO to Grade 6 for 2022 to 2023 has also meant that we have seen no major changes in the comparative mean and median pay gaps since 2021 to 2022. We also chose to pay higher awards to SCS colleagues lowest in the pay band which had a small positive impact on the SCS grade mean pay gap.
The CMA’s pay gaps compare favourably against the rest of the Civil Service. Although the gender pay gaps have reduced for both CMA and the Civil Service in 2022 to 2023, the CMA has a lower mean and median gender pay gap than the average for the UK Civil Service. In 2023, the Cabinet Office reported that the Civil Service mean pay gap was 8.1% and the median pay gap was 9.6%[footnote 2].
Bonus Pay
Bonus pay, which is also calculated as mean and median, is based on bonus payments paid to staff throughout the 2022 to 2023 financial year.
This calculation may include employees who are not ‘full pay relevant’ employees but will not include employees who left the CMA before 31 March 2023.
At the CMA, usually bonus pay includes any performance related pay (PRP). These are payments based on performance management outcomes for the previous financial year. In the case of staff in grades AO to Grade 6, these payments are negotiated annually with our recognised trade unions. For SCS staff, there are separate arrangements which are centrally set by government each year. However, on an exceptional basis for the 2022 to 2023 pay award for staff at grades AO to Grade 6, it was agreed that there would not be a link between performance ratings and non-consolidated payments. An organisational award was paid instead, in recognition of the continuing high performance across the CMA during a challenging year (2021 to 2022). This award was included in the bonus payments made during the 2022 to 2023 financial year and is therefore included in the bonus gap calculations.
Staff in grades AO to Grade 6 had a Staff Recognition Scheme which provided non-consolidated payments. During the 2022 to 2023 financial year, these awards were valued between £50 and £500. Any scheme awards made during the 2022 to 2023 financial year are also included in bonus pay calculations.
Bonus calculations also include ‘Pivotal Role Allowances. These payments, approved by a subgroup of the Civil Service Board and Chief Secretary to Treasury, are aimed at retaining SCS staff in highly specialised roles and those delivering high-risk, major projects within the Civil Service. The allowances were paid to a small number of SCS staff in the 2022/23 financial year on completion of project milestones.
The number of SCS pivotal role allowances were split evenly between male and female staff in 2022 to 2023, however the average amounts received by male staff were 2.1% higher than the amounts received by females. As the total number of awards were less than 10, this variance was negligible in the overall gender pay gap.
In the 2022 to 2023 financial year, 76.3% of male staff received a bonus payment compared with 79.4 % in 2021 to 2022. The percentage of female staff who received a bonus decreased to 78.1% in 2022 to 2023 when compared with 81.1% in 2021 to 2022. These changes reflect the overall decrease in the proportion of staff who received a bonus in 2022 to 2023 to 77.2% from 80.2% in 2021 to 2022.
The following table shows the mean bonus gap (which is the difference between the average bonus pay between men and women) and the median bonus gap (which is the difference between the median of the bonus pay of men and women):
Figure 5: CMA Gender Mean and Median Bonus Gaps for 2022 to 2023
| Measure | 2022 to 2023 | 2021 to 2022 | 2020 to 2021 |
|---|---|---|---|
| Mean bonus gap | 5.6% | 26.6% | 41.2% |
| Median bonus gap | 0.0% | 0.0% | 57.3% |
The mean bonus pay gap has significantly reduced for the second year running, and the median bonus gap has remained at 0.0%.
The reduction in the bonus pay gap can partly be attributed to the different pay award approach taken in 2022 to 2023, where an organisational award was made for grades AO to Grade 6. A standard organisational award of £900 was made to all staff at grades AO to Grade 6 who received a performance rating for the performance year ending 31 March 2022. This is in contrast to 2021 to 2022, when organisational awards were calculated on the basis of an underpin plus an amount tiered by grade, with more senior grades receiving higher awards.
The following table shows the mean and median gender bonus gaps for 2022 to 2023 broken down by grade.
Figure 6: CMA Gender Mean and Median Bonus Gaps by grade for 2022 to 2023
| Civil Service grade | Mean bonus gap | Median bonus gap |
|---|---|---|
| AO | -68.0% | -600.0% |
| EO | 8.3% | 12.2% |
| HEO | -12.9% | 5.3% |
| SEO | -1.7% | 2.7% |
| Grade 7 | -4.9% | -10.5% |
| Grade 6 | 1.9% | 9.5% |
| SCS PB1 | 10.4% | 15.0% |
| SCS PB2 and PB3 | -19.5% | -19.8% |
| All staff | 5.6% | 0.0% |
The table shows there is a very high mean and median bonus gap at AO grade. The main reasons for the bonus gap within this grade is due to women receiving fewer bonuses of higher value, whereas a larger number of bonuses of smaller amounts were awarded to men during this reporting period.
Looking at the mean bonus gap analysis, the reduced gap is attributable to the following factors
-
although staff recognition awards were split evenly between females and males, the average value of the recognition award received by females was 15.0% higher than males
-
the value of bonuses for SCS staff are significantly higher than the staff in grades AO to Grade 6. SCS PB1 saw 55% of bonuses paid at this grade to male staff which is comparable to the number of male staff at this grade (58.2% as per figure 2). Although females make up 40% of staff at SCS PB2/3, they received 48.2% of bonuses paid at this grade, which minimised the bonus pay gap
-
the inclusion of Pivotal Role Allowances in bonus calculations had a minimal effect on the bonus pay gap. While the number of bonuses paid were evenly split between males and females, and the average award for males was 2.1% higher during the period 2022 to 2023
Pay Quartiles
The hourly pay quartiles are calculated by listing all employees in order of hourly pay and splitting them into 4 equal parts. The graph below shows the proportion of men and women that are in each pay quartile.
Figure 7: Proportion of staff by gender in each pay quartile for 2022 to 2023
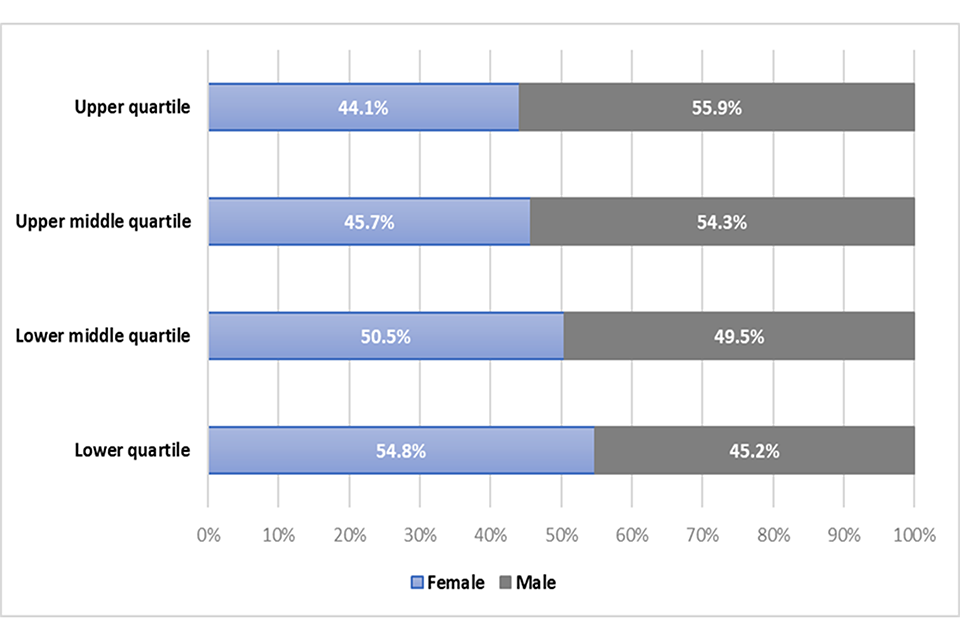
Image description: A bar chart in which the vertical axis shows the pay quartile and the horizontal axis shows the percentage of female and male staff in each quartile. The charts shows that there is a higher percentage of male staff in the upper pay quartile; 55.9% male staff compared with 44.1% female staff. The upper middle quartile also has a higher percentage of male staff; 54.3% compared with 45.7% female staff. However, the lower quartile and lower middle quartile both have a higher percentage of female staff. 50.5% of staff in the lower middle quartile and 54.8% of staff in the lower quartile are female.
The pay quartile distribution shows that the proportion of female staff in the lower and lower middle quartiles is higher than male staff, as women generally, make up a higher proportion of our junior grades. We note that female representation has increased in the lower quartile since last year, owing to a higher proportion of female joiners. There has however been an increase in the number of males in the lower middle quartile from 46.7% to 49.5%
The upper quartile, which is mainly comprised of Grade 6 competition specialists and SCS staff, continues to have a higher proportion of male staff. There has been an increase in female representation at the upper middle quartile from 43.6% to 45.7%.
As above, progress has been made to balance the gender split in the upper and lower middle quartiles, however we acknowledge that further work needs to be undertaken to address the gaps at the upper and lower quartiles. To continue to close the gaps, a better gender balance should be achieved across all grades in the CMA
Closing the Gap – Actions for the CMA
The CMA is committed to promoting equality and diversity amongst our workforce. We take steps to ensure we are a great employer that values and welcomes the different ideas, skills, behaviours and experiences of our colleagues. We also aim to foster a culture that promotes wellbeing and mental health and provides support so all our colleagues can thrive.
We continue to take steps to minimise the gender pay gap and our approach to pay seeks to reward staff fairly, regardless of gender. We are committed to reducing, and eventually eliminating, the gender pay gap.
Our Equality, Diversity and Inclusion Strategy 2020 to 2024 describes how equality, diversity and inclusion are essential to the way that we operate, both as the UK’s competition authority and as an employer. We have published reviews of our progress against our strategy, objectives and action plans in April 2021 and September 2022
To deliver the final 2 years of our Equality, Diversity and Inclusion Strategy 2020 to 2024, we launched a detailed action plan, following engagement with internal stakeholders. The initiatives in the plan are intended to make a wide-reaching impact on equality, diversity and inclusion at the CMA, including having an impact on our pay gaps. Each action was assessed to determine whether it would help to:
-
reduce the gender and or ethnicity pay gaps
-
improve diverse representation
-
improve our culture of inclusivity
-
remove, reduce and or mitigate the potential for bias
Our Equality, Diversity and Inclusion Action Plan is focussed on:
-
recruitment and ‘growing our own’
-
career progression and development
-
improving senior representation
-
pay and reward
-
promoting a culture of inclusivity
Within each area we are prioritising some top actions, our ‘Accelerators’, where we will particularly focus our energy to make the most difference.
The plan was launched 1 day before the snapshot date (31 March 2023) for this pay gap report, so we did not expect the action plan to have affected the gender and ethnicity pay gap outcomes for 2022 to 2023, and we recognise that some of the actions and initiatives may take some time to be fully realised.
We will ensure that all pay activities and initiatives continue to consider the equality impact and support this drive to address and minimise our gaps.
The CMA Board, Executive and Chief Executive are committed to our ambitious yet achievable plans that will deliver change, not just in our gender and ethnicity pay gaps, but more broadly so the CMA is a truly inclusive and representative place to work.
Declaration
The CMA confirms that all calculations have been carried out in line with the guidance and regulations, with all efforts made to ensure a robust and methodical approach to the production of our findings.
-
Source: Statistical Bulletin - Civil Service Statistics 2023 published August 2023 ↩
-
Source: Statistical Bulletin - Civil Service Statistics 2023 published August 2023 ↩