Gender Pay Gap Report: 1 April 2021 to 31 March 2022
Published 30 March 2023

© Crown copyright 2023
This publication is licensed under the terms of the Open Government Licence v3.0 except where otherwise stated. To view this licence, visit nationalarchives.gov.uk/doc/open-government-licence/version/3 or write to the Information Policy Team, The National Archives, Kew, London TW9 4DU, or email: psi@nationalarchives.gov.uk.
Where we have identified any third party copyright information you will need to obtain permission from the copyright holders concerned.
This publication is available at https://www.gov.uk/government/publications/gender-pay-gap-report-2021-to-2022/gender-pay-gap-report-1-april-2021-to-31-march-2022
Foreword
As a competition authority, we help people, businesses and the UK economy by promoting competitive markets and tackling unfair behaviour. We need staff from diverse backgrounds to help ensure we make sound decisions that are representative of the different perspectives within society. We also seek to positively influence the approach of the stakeholders we work with, where we can.
As an employer, we remain committed to promoting equality and diversity amongst our workforce. We take steps to ensure we are a great employer that values and welcomes the different ideas, skills, behaviours and experiences of our colleagues. We also aim to foster a culture that promotes wellbeing and mental health and provides support so all our colleagues can thrive.
Our Gender Pay Gap Report 2021 to 2022 provides us with an insight into how we are living up to this commitment and, in particular, helps us to understand how we are supporting women to join, develop and progress their careers within the CMA.
This is our sixth year of reporting on our gender pay gap and over this time we have made progress in improving, in particular, our ordinary pay gaps (with 2019 to 2020 being the year where we reduced these gaps to their lowest level). This year, we have made considerable progress in closing our bonus pay gaps, however we have also seen that both our median and mean ordinary pay gaps have reached their highest levels since we began reporting. This is not acceptable to us, and we will be focusing our efforts to improve this position.
We know that, historically, the pay gaps in the CMA have mainly been driven by men being proportionally more likely to be occupying roles at senior grades and women being proportionally more likely to have roles at junior grades. This year the proportion of women within our Senior Civil Servant (SCS) grades has decreased to 41.1%, which has had an impact on our mean and median ordinary pay gaps.
With a new Chair of the Board and my own appointment as Chief Executive in 2022we have a renewed focus on delivering our strategic ED&I priorities and we will work tirelessly to ensure that diversity is at the very heart of our endeavours. Our commitment to close the gender pay gap speaks to a broader agenda of inclusion and we look forward to further progressing this goal as part of an ambitious strategy to achieve equality in the workplace.
Our Action Plan focuses on how we can make the CMA an employer of choice for women looking to further their careers while also encouraging our existing female colleagues to progress. Within the plan we will be prioritising some top actions that will make the most difference, our ‘Accelerators’. These include a full review of our performance management framework, reviewing our recruitment process to identify and address the potential barriers that applicants might currently face, and implementing our outreach programme.
We all want to work in an inclusive environment, and the Board, Executive and Chief Executive are committed to our ambitious yet achievable plans that will deliver change, not just in our gender and ethnicity pay gaps, but more broadly so the CMA is a truly inclusive and representative place to work.
Sarah Cardell, Chief Executive
Amelia Fletcher, Non-Executive Director and Wellbeing, Inclusion, Diversity and Equality Steering Group (WIDE) Chair
Introduction
The CMA is a non-ministerial government department in the United Kingdom responsible for promoting competition for the benefit of consumers, both within and outside the UK. Our aim is to make markets work well for consumers, businesses and the economy, strengthening business competition and preventing and reducing anti-competitive activities.
As an organisation, the CMA remains committed to promoting equality and diversity amongst our workforce. In August 2020, we published our ‘Equality, Diversity and Inclusion Strategy 2020 to 2024’ and ‘Equality, Diversity and Inclusion Action Plan 2020 - 2022’ which set out our ambitious programmes of work which seek to embed a diverse and inclusive culture within the CMA. We continue to take steps to minimise the gender pay gap and our approach to pay seeks to reward staff fairly, regardless of gender.
This report sets out the CMA’s gender pay gap and how we plan to address the gap.
In 2017, the Government introduced world-leading legislation that made it statutory for organisations with 250 or more employees to report annually on their gender pay gap. Government departments are covered by the Equality Act 2010 (Specific Duties and Public Authorities) Regulations 2017 which came into effect on 31 March 2017. These regulations underpin the Public Sector Equality Duty and require relevant organisations to publish their gender pay gap data by 30 March for the preceding financial year.
The statutory pay measures contained in this report are:
- the mean and median gender pay gaps;
- the mean and median gender bonus pay gaps;
- the proportion of men and women who received bonuses; and
- the proportion of male and female employees in each pay quartile
The gender pay gap shows the difference in the average pay between all men and women in a workforce. If a workforce has a particularly high gender pay gap, this can indicate there may be a number of issues to deal with, and the individual calculations may help to identify what those issues are. Where there is a positive percentage, this means that the pay of male staff is higher than the pay of female staff. The higher the percentage, the greater the gender pay gap.
The gender pay gap is different to equal pay. Equal pay deals with the pay differences between men and women who carry out the same jobs, similar jobs or work of equal value. It is unlawful to pay people unequally because of their gender.
The CMA supports the fair treatment and reward of all staff irrespective of gender. This report sets out the CMA’s statutory requirements under gender pay legislation, extended analysis of our gender pay gap by grade and the CMA’s action plan to tackling any arising issues.
Gender profile of the CMA
At 31 March 2022, the CMA had a total of 842 staff in the UK with 779 based in London, 50 in Edinburgh, 5 in Cardiff and 8 in Belfast. This is the number of staff deemed to be ‘full pay relevant’; those employees who are not being paid or are on reduced, statutory or no pay during March 2022 are excluded as they are not ‘full pay relevant’ employees.
The gender profile of full pay relevant CMA staff at 31 March 2022 is below.
Figure 1: CMA gender profile by workforce as of 31 March 2022
| CMA Workforce | Total staff | Male | Female |
|---|---|---|---|
| AO to Grade 6 | 718 | 49.4% | 50.6% |
| Senior Civil Service | 124 | 58.9% | 41.1% |
| All staff | 842 | 50.8% | 49.2% |
Figure 2: CMA gender profile by grade as of 31 March 2022
| Civil Service grade | Total staff | Male | Female |
|---|---|---|---|
| AO | 20 | 40.0% | 60.0% |
| EO | 66 | 45.5% | 54.5% |
| HEO | 142 | 45.1% | 54.9% |
| SEO | 60 | 43.3% | 56.7% |
| Grade 7 | 231 | 52.8% | 47.2% |
| Grade 6 | 199 | 52.8% | 47.2% |
| SCS PB1 | 99 | 56.6% | 43.4% |
| SCS PB2 and PB3 | 25 | 68.0% | 32.0% |
| All staff | 842 | 50.8% | 49.2% |
The gender profile of CMA staff is 50.8% male and 49.2% female. This is a slight decrease in female representation since 2020 to 2021 when 50.9% of staff were female. This can be attributed to a decrease in the number of women joining the organisation in 2021 to 2022 where 46.5% of new joiners were women,. In addition, 56.8% of leavers in 2021 to 2022 were women.
Looking at our Senior Civil Servants (SCS) community, the proportion of male to female staff has also changed since 2020 to 2021. The proportion of female SCS staff decreased slightly from 43.2% to 41.1% in 2021 to 2022. This can be attributed to higher percentage of men joining the organisation at SCS level. In 2021 to 2022, 77.8% of the SCS new joiners were men while 22.2% were women.
We know that an over representation of women in the lowest pay quartile as well as an under representation of women at the highest pay quartile is a cause of the gender pay gap across the Civil Service[footnote 1]. Looking at our gender profile more closely, this is the same for the CMA.
Improving the gender balance in senior grades will be one of the key ways in which we will reduce the pay gaps at the CMA.
Calculating the gender pay gap
Ordinary pay
Ordinary pay, expressed as hourly pay, is used to calculate the mean and median gender pay gaps. Ordinary pay includes basic pay, any allowances and any bonus payments made in March 2022. Salary sacrifice amounts are deducted from this value.
The calculation for the mean and median ordinary pay only includes ‘full pay relevant’ employees, as described in paragraph 9.
The gender pay gap calculations are based on the number of individual employees, and not on full-time equivalents. This means that each part-time employee counts as one employee.
The following table shows the mean pay gap (which is the difference between the average hourly pay between men and women) and the median pay gap (which is the difference between the median hourly pay of men and women).
Figure 3: CMA gender mean and median pay gaps for the last 3 years
| Measure | 2021 to 2022 | 2020 to 2021 | 2019 to 2020 |
|---|---|---|---|
| Mean pay gap | 8.9% | 6.7% | 5.6% |
| Median pay gap | 6.3% | 5.5% | 2.9% |
The ordinary pay gaps have widened from 2020 to 2021.
As a small department, we know that our gender pay can be affected by small changes to our gender representation and pay. Some of the factors that have contributed to the ordinary pay gaps widening in 2021 to 2022 are:
- a continued shift in turnover by gender, where in 2021 to 2022, 56.8% of leavers were female and 43.2% were male.
- an increase in the proportion of men joining the organisation in 2021 to 2022, with men accounting for 53.4% of new joiners, and a higher proportion of women joining at more junior grades. In 2021 to 2022, 67.6% of female joiners were in grades AO to SEO, compared with 43.6% of male joiners. In addition, 77.8% of the SCS new joiners were men while 22.2% were women.
- digital, Data and Technology (DDaT) allowances were introduced in the 2020 to 2021 financial year. These allowances are paid to eligible DDaT roles – defined by the Government Digital Service (GDS) who centrally own the DDaT Framework – which evidence attraction and retention issues across government due to the scarcity of professionals in the job market. In 2021 to 2022, of those staff who received allowances for holding eligible roles, 70.6% were men (a small increase from 2019 to 2020, where 68.7% of these were men). In addition DDaT allowances for men are, on average, 30.8% higher than female staff due to male staff evidencing higher capability levels through the capability assessment process and larger numbers of men at more senior grades receiving a DDaT allowance (this figure is an improvement from 2020 to 2021 where this figure was 39.2%).
The following table shows the mean and median gender pay gaps for 2021 to 2022 broken down by grade.
Figure 4: Mean and median gender pay gaps by grade for 2021 to 2022*
| Civil service grade | Mean pay gap* | Median pay gap* |
|---|---|---|
| AO | 1.4% | 0.6% |
| EO | 4.5% | 4.4% |
| HEO | 0.5% | 0% |
| SEO | 2.5% | 3.6% |
| Grade 7 | 1.0% | 0.8% |
| Grade 6 | -0.2% | 0.0% |
| SCS PB1 | 0.7% | 1.4% |
| SCS PB2 and PB3 | 3.5% | 0.7% |
| All staff | 8.9% | 6.3% |
*Where we have a negative percentage, this means that the pay of female staff is higher than the pay of male staff.
Looking at the mean and median gender pay gap analysis by grade, the differences are small (no higher than 4.4% across any measure / grade, although this has increased from 2.6% in 2020 to 2021) between male and female staff. This indicates that while there is an overall pay gap it is primarily driven by an underrepresentation of female staff at SCS, as the ordinary pay received by male and female staff is relatively equal within grade.
Although there was no Pay Award for 2021 to 2022 (other than the exceptions in place for staff earning a base salary of under £24,000pa (FTE)), the small gaps may be attributed to our decision in our previous Pay Settlements to make pay awards based on staff position within their respective pay range (with those lowest in the pay range receiving the highest pay awards). Our Pay Policy also sets out rules for salaries on appointment which limits starting salaries to the grade minimum up to the grade midpoint; this has the effect of limiting differences in pay between existing staff and new starters which also has the potential to negatively impact our pay gaps.
We note that the CMA’s median pay gap continues to compare favourably against the median pay gap for the rest of the Civil Service. However, our mean pay gap has increased, and whilst the Civil Service average mean pay gap has also increased, the CMA now has a greater mean pay gap than the average for the Civil Service. In 2022, the Cabinet Office reported that the Civil Service mean pay gap was 8.5% and the median pay gap was 11.3%[footnote 2].
Bonus pay
Bonus pay, which is also calculated as mean and median, is based on bonus payments paid to staff throughout the 2021 to 2022 financial year and up to 31 March 2022.
As this covers a full year period, this calculation may include employees who are not ‘full pay relevant’ employees but will not include employees who left the CMA before 31 March 2022.
At the CMA, usually bonus pay includes any performance related pay (PRP). These are payments based on performance management outcomes for the previous financial year. In the case of staff in grades AO to Grade 6, these payments are negotiated annually with our recognised trade unions. For SCS staff, there are separate arrangements which are centrally set by government each year. However, due to the ongoing COVID-19 pandemic, on an exceptional basis for the 2021 to 2022 pay award for staff at grades AO to Grade 6 it was agreed that there would not be a link between performance ratings and non-consolidated payments. An organisational award was paid instead.
In addition, staff in grades AO to Grade 6 have a Staff Recognition Scheme which provides non-consolidated cash awards between £25 and £750. Any scheme awards made during the 2021 to 2022 financial year are also included in bonus pay calculations.
It should be noted that bonus calculations must also include ‘Pivotal Role Allowances’. These are payments, approved by a subgroup of the Civil Service Board and Chief Secretary to Treasury, aimed at retaining SCS staff in highly specialised roles and those delivering high-risk, major projects within the Civil Service. The allowances were paid to a small number of SCS staff in the 2021 to 2022 financial year on completion of project milestones.
In the 2021 to 2022 financial year, 79.4% of men received a bonus payment compared with 68.6% in 2020 to 2021. The percentage of women who received a bonus increased to 81.1% in 2021 to 2022 when compared with 67.7% in 2020 to 2021. These increases can largely be attributed to the fact that organisational awards were awarded in 2021 to 2022.
The following table shows the mean bonus gap (which is the difference between the average bonus pay between men and women) and the median bonus gap (which is the difference between the median of the bonus pay of men and women):
Figure 5: CMA Gender Mean and Median Bonus Gaps for 2021 to 2022
| Measure | 2021 to 2022 | 2020 to 2021 | 2019 to 2020 |
|---|---|---|---|
| Mean bonus gap | 26.6% | 41.2% | 29.3% |
| Median bonus gap | 0.0% | 57.3% | -2.5% |
The bonus pay gaps have significantly reduced from 2020 to 2021.
The reduction in the bonus pay gap can be attributed to the different pay award approach taken in 2021 to 2022, where an organisational award was made for grades AO to Grade 6. Organisational awards were made as a flat rate, non-consolidated payments, and the rates were calculated based on 2 elements: an underpin value of £550 plus an amount that was tiered by grade. Organisational awards were not pro-rated for working pattern nor time spent in role, and were based on the grade for which staff received a performance rating for the 2020 to 2021 performance round.
The following table shows the mean and median gender bonus gaps for 2021 to 2022 broken down by grade.
Figure 6: CMA Gender Mean and Median Bonus Gaps by grade for 2021 to 2022
| Civil service grade | Mean bonus gap* | Median bonus gap* |
|---|---|---|
| AO | 59.3% | 86.1% |
| EO | 13.0% | 6.2% |
| HEO | -11.5% | 0.0% |
| SEO | 0.3% | -10.9% |
| Grade 7 | 4.7% | 0.0% |
| Grade 6 | 4.0% | 8.2% |
| SCS PB1 | 6.3% | 0.0% |
| SCS PB2 and PB3 | 5.9% | 0.0% |
| All staff | 26.6% | 0.0% |
*Where we have a negative percentage, this means that the bonus pay of female staff is higher than the bonus pay of male staff.
The table shows there is a very high mean and median bonus gap at AO grade. As shown in Figure 2 we have 20 staff at AO grade, and a small number of these received bonus pay during the year. The size of this group has an impact on the bonus pay gaps.
Looking at the mean bonus gap analysis, the gap is attributable to the following factors:
-
although 50.7% women received staff recognition awards, the average recognition award received by men was 1.15% higher than women.
-
the grade distribution of men and women (where there is a higher proportion of men at more senior grades for example grade 7 and above) has had an effect, as organisational awards were calculated on the basis of an underpin plus an amount tiered by grade, with more senior grades receiving higher awards.
-
the value of bonuses for SCS staff is significantly higher than the staff in grades AO to Grade 6. This is due to the size of the ‘non-consolidated performance pay pots’ which are set centrally by government; eligible SCS staff share 3.3% of the previous year’s SCS paybill for bonuses, compared with 1.5% for staff at grades AO to Grade 6.
-
the inclusion of Pivotal Role Allowances in bonus calculations, as all recipients were male.
Pay by quartiles
The hourly pay quartiles are calculated by listing all employees in order of hourly pay and splitting them into 4 equal parts. The graph below shows the proportion of men and women that are in each pay quartile.
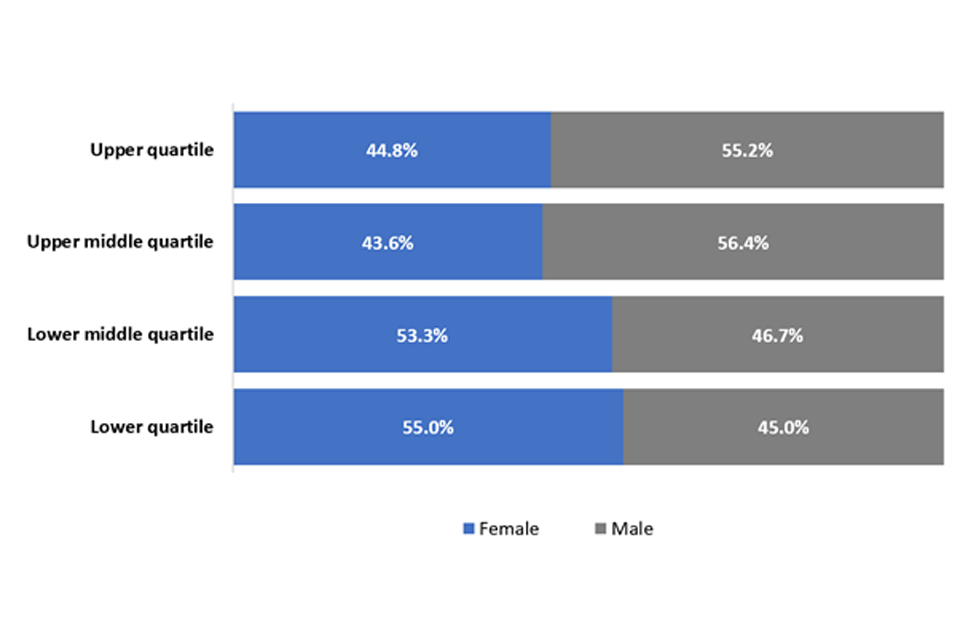
Figure 7: Proportion of staff by gender in each pay quartile for 2021 to 2022
Image description: A bar chart in which the vertical axis shows the pay quartile and the horizontal axis shows the percentage of female and male staff in each quartile. The charts shows that there is a higher percentage of male staff in the upper pay quartile; 55.2% male staff compared with 44.8% female staff. The upper middle quartile also has a higher percentage of male staff; 56.4% compared with 43.6% female staff. However, the lower quartile and lower middle quartile both have a higher percentage of female staff. 53.3% of staff in the lower middle quartile and 55.0% of staff in the lower quartile are female.
The pay quartile distribution shows that the proportion of female staff in the lower and lower middle quartiles is higher than male staff, as women, generally, make up a higher proportion of our junior grades. We note that female representation has increased in the lower quartile since last year, owing to a higher proportion of female joiners.
The upper quartile, which is mainly comprised of Grade 6 competition specialists and SCS staff, continues to have a higher proportion of male staff. Increasing female representation at senior grades, particularly the SCS, will improve the gender balance in the upper quartile.
Closing the gap – Actions for the CMA
As an employer, we are committed to promoting equality and diversity amongst our workforce. We take steps to ensure we are a great employer that values and welcomes the different ideas, skills, behaviours and experiences of our colleagues. We also aim to foster a culture that promotes wellbeing and mental health and provides support so all our colleagues can thrive.
We continue to take steps to minimise the gender pay gap and our approach to pay seeks to reward staff fairly, regardless of gender. We are committed to reducing, and eventually eliminating, the gender pay gap.
Our Equality, Diversity and Inclusion Strategy 2020 to 2024 describes how equality, diversity and inclusion are essential to the way that we operate, both as the UK’s competition authority and as an employer.
To deliver our Equality, Diversity and Inclusion Strategy 2020 to 2024, we have developed and published a detailed 2-year action plan that outlines how we will deliver the final 2 years of our 4 year EDI strategy.
Our Equality, Diversity and Inclusion Action Plan is focused on:
- recruitment and ‘growing our own’
- career progression and development
- improving senior representation
- pay and reward
- promoting a culture of inclusivity
As well as outlining our future actions, the plan sets out the initiatives we have already implemented, and will continue to deliver over the next 2 years.
Within each area we will be prioritising some top actions where we will particularly focus our energy to make the most difference, our ‘Accelerators’.
The CMA Board, Executive and Chief Executive are committed to our ambitious yet achievable plans that will deliver change, not just in our gender and ethnicity pay gaps, but more broadly so the CMA is a truly inclusive and representative place to work.
Declaration
The CMA confirms that all calculations have been carried out in line with the guidance and regulations, with all efforts made to ensure a robust and methodical approach to the production of our findings.
-
Source: Statistical Bulletin - Civil Service Statistics 2022 published July 2022 ↩
-
Source: Statistical Bulletin - Civil Service Statistics 2022 published July 2022 ↩