Further education and skills inspections and outcomes as at 28 February 2018: main findings
Published 28 June 2018

© Crown copyright 2018
This publication is licensed under the terms of the Open Government Licence v3.0 except where otherwise stated. To view this licence, visit nationalarchives.gov.uk/doc/open-government-licence/version/3 or write to the Information Policy Team, The National Archives, Kew, London TW9 4DU, or email: psi@nationalarchives.gov.uk.
Where we have identified any third party copyright information you will need to obtain permission from the copyright holders concerned.
This publication is available at https://www.gov.uk/government/statistics/further-education-and-skills-inspections-and-outcomes-as-at-28-february-2018/further-education-and-skills-inspections-and-outcomes-as-at-28-february-2018-main-findings
This release contains:
- provisional data for the most recent inspections and outcomes as at 28 February 2018
- provisional data for inspections conducted between 1 September 2017 and 28 February 2018
- revised data for inspections conducted between 1 September 2016 and 31 August 2017
The proportion of providers judged good or outstanding at their most recent inspection increased in 3 out of the 4 biggest provider groups.
The proportion of general further education colleges, sixth-form colleges and community learning and skills providers judged good or outstanding has increased since 31 August 2017, as shown in Figure 1.
Sixteen general further education colleges improved to good at inspection this year.
Out of the 20 general further education colleges that previously required improvement, 16 improved to good at inspection this year. This helped to increase the proportion of colleges judged good or outstanding at their most recent inspection, from 67% as at 31 August 2017 to 75% as at 28 February 2018, as shown in Figure 1.
The proportion of inspected independent learning providers (including employer providers) dropped to 66%.
Providers accessing the new apprenticeship funding have started to be added to the Ofsted systems, increasing the number of independent learning providers (including employer providers) by 18%. This increase has reduced the proportion of providers with an overall effectiveness judgement from 82% as at 31 August 2017 to 66% as at 28 February 2018.
Figure 1: Proportion of providers judged good or outstanding for overall effectiveness at their most recent inspection, by provider type
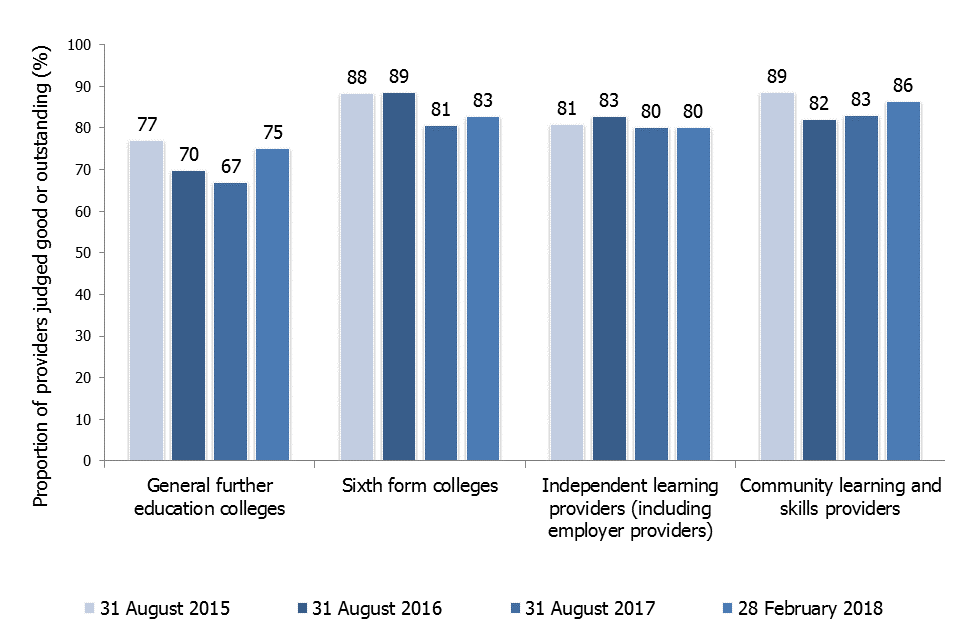
Bar chart displaying the proportion of further education and skills providers judged good or outstanding at their most recent inspection over time.
1. Introduction
1.1 In-year inspection outcomes
Between 1 September 2017 and 28 February 2018, 220 further education and skills providers were inspected. These included 68 colleges, 63 independent learning providers (including employer providers), 55 community learning and skills providers and 34 other further education and skills providers. Ofsted also contributed to 20 prison and young offender institution inspections, where the reports were published by Her Majesty’s Inspectorate of Prisons between 1 September 2017 and 28 February 2018.
The 220 inspections consisted of 127 full inspections and 93 short inspections (including those that converted to full inspections). These inspections can be broken down in to the following categories:
- 93 short inspections of previously good providers (including those that converted to a full inspection)
- 68 routine full inspections of providers previously judged requires improvement or inadequate
- 39 risk-assessed full inspections of previously good or outstanding providers
- 16 full inspections of providers that were inspected for the first time
- 4 full inspections of outstanding providers that were not exempt from inspection[footnote 1]
Of the 93 short inspections, 83 providers remained good and 10 short inspections converted to a full inspection. From these converted inspections, 3 providers improved to outstanding, one remained good, 5 declined to requires improvement and one declined to inadequate.
Overall, from the full and short inspections conducted between 1 September 2017 and 28 February 2018, 3% of the providers were judged outstanding, 70% good, 21% requires improvement and 6% inadequate. The overall proportion of providers judged good or outstanding was 73%, 10 percentage points higher than during the last reporting year (1 September 2016 to 31 August 2017).
Figure 2: Further education and skills providers’ full and short inspection outcomes, by reporting year

Chart displaying further education and skills inspection outcomes for this reporting year and last reporting year.
There are 2 contributing factors that have led to the higher proportion of providers judged good or outstanding:
- a difference in the composition of inspections for previously good providers
- a higher proportion of providers previously judged requires improvement improving at inspection this year
Last year there was nearly an equal split between risk-assessed and short inspections of previously good providers. This year, as the first cycle of short inspections are nearing an end (introduced on 1 September 2015), a much higher proportion of short inspections have been carried out.
Figure 3: Proportion of providers selected for inspection, by inspection type and reporting year

Chart displaying the proportion of providers selected for inspection, by inspection type and reporting year.
Outcomes from the risk-assessed full inspections of previously good providers were very similar to last year, with around 60% declining.
Short inspection outcomes were moderately higher, with 90% of the previously good providers remaining good, compared with 82% during the last reporting year.
The higher proportion of previously good providers remaining good from both full and short inspections at the mid-year point has contributed to the higher proportion of providers graded good or outstanding in this reporting year.
Figure 4: Proportion of providers previously judged good that improved, declined or stayed the same at their next inspection
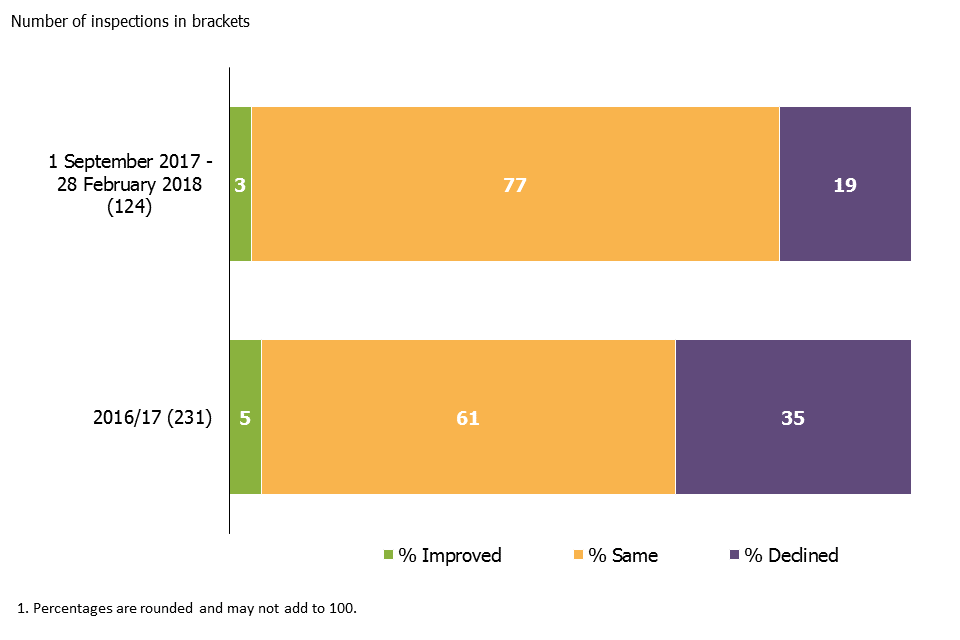
Chart displaying the proportion of providers previously judged good that improved, declined or stayed the same at their inspection this year.
There was also a higher proportion of providers previously judged requires improvement that improved to good at the mid-year point, which contributed to the higher proportion of providers graded good or outstanding in this reporting year compared with last year.
Figure 5: Proportion of providers previously judged requires improvement that improved, declined or stayed the same at their next inspection

Chart displaying the proportion of providers previously judged requires improvement that improved, declined or stayed the same at their inspection this year.
Across the different provider groups, just under three quarters of providers improved to good from requires improvement. The proportion of general further education (FE) colleges that improved was particularly noticeable, with four fifths improving.
1.2 In-year safeguarding judgements
Of the 220 providers inspected between 1 September 2017 and 28 February 2018, the overwhelming majority (214) had effective safeguarding arrangements in place for young people and learners. Six providers were judged not to have effective safeguarding arrangements in place: 5 independent learning providers (including employer providers) and one local authority provider.
In the 5 independent learning providers (including employer providers) that did not have effective safeguarding arrangements in place, inspectors found:
- a failure to implement safeguarding policies and procedures to protect learners
- leaders and managers had been slow in implementing the ‘Prevent’ duty
- learners were not equipped with the necessary knowledge to ensure they could keep themselves safe
1.3 Most recent inspection outcomes
As at 28 February 2018, there were 1,281 open and funded further education and skills providers recorded on the Ofsted systems, an increase of 10% compared with 31 August 2017.
Much of this increase was as a result of providers becoming in scope for inspection, having received apprenticeship funding. However, as at 28 February, only a small proportion of the providers receiving this type of funding had been included on our system. Many more providers are expected to be added over the months ahead, once their status is confirmed by the funding agency.
As a result of the increase, the proportion of providers that had been inspected dropped by 11 percentage points, from 88% as at 31 August 2017 to 77% as at 28 February 2018.
Of the 982 providers that had been inspected as at 28 February 2018, 15% were judged outstanding, 67% good, 16% requires improvement and 2% inadequate.
Figure 6: Overall effectiveness of further education (FE) and skills providers at their most recent inspection, as at 28 February 2018
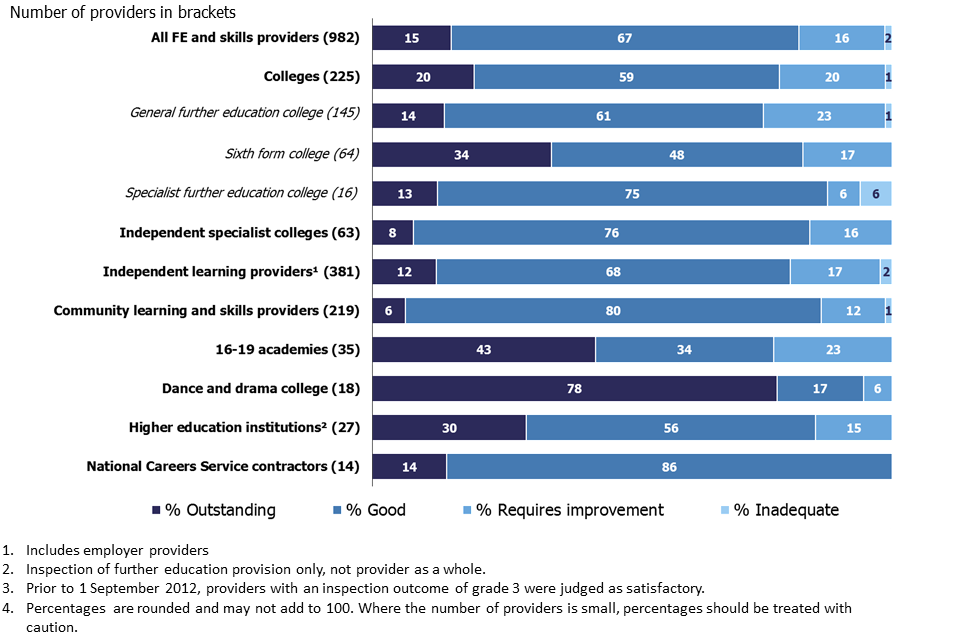
Chart displaying the overall effectiveness of further education and skills providers at their most recent inspection as at 28 February 2018, by provider type.
The overall proportion of providers judged good or outstanding as at 28 February 2018 was 82%, 3 percentage points higher than as at 31 August 2017.
Three out of the 4 largest provider groups saw an increase in the proportion of providers judged good or outstanding. General further education colleges had the largest increase at 8 percentage points, whereas independent learning providers (including employer providers) remained the same (see Figure 1).
2. Main findings
2.1 General further education colleges
Between 1 September 2017 and 28 February 2018 the number of general further education (FE) colleges decreased by 8, from 189 to 181. This was as a result of 8 mergers each between 2 colleges and/or other FE providers. The most recent inspection outcomes for the providers involved were:
- 5 mergers between providers both judged good
- one merger between a college judged good and a college judged requires improvement
- one merger between a college judged good and a college judged inadequate
- one merger between colleges both judged requires improvement
Colleges that have officially closed as a result of a merger will no longer be reported on separately in the Official Statistics. As at 28 February 2018, 36 of the 181 general FE colleges had not yet been inspected: one new college and 35 colleges that had been through the merger process.
Between 1 September 2017 and 28 February 2018, 49 general FE colleges were inspected. There were 37 full inspections and 12 short inspections (including one that converted to a full inspection). Overall, 2% of the general FE colleges were judged outstanding, 76% good, 18% requires improvement and 4% inadequate. The overall proportion of providers judged good or outstanding was 78%, 31 percentage points higher than during the last reporting year.
Figure 7: General further education college full and short inspection outcomes, by reporting year
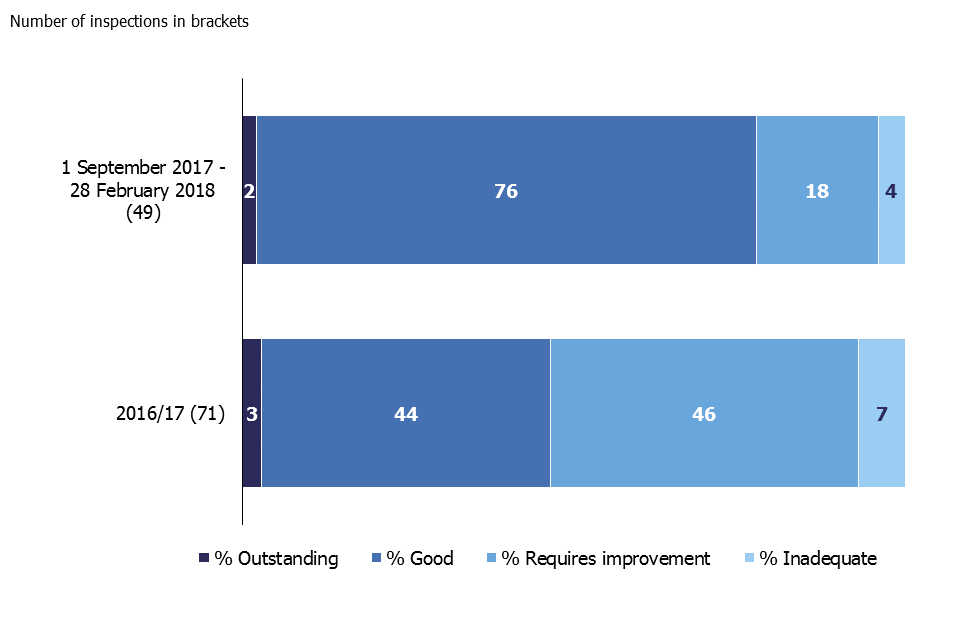
Chart displaying inspection outcomes for general further education colleges for this reporting year and last reporting year.
There are 2 contributing factors which have led to a much higher proportion of general FE colleges judged to be good this year.
At the mid-year point, the same number of short inspections had been carried out as there were for the whole of the last reporting year (12), with the outcomes being very similar across both years. However, as the short inspections made up a higher proportion of all inspections conducted between 1 September 2017 and 28 February 2018, they had a greater influence on the proportion judged good overall.
There was also a lot of colleges that improved at inspection this year. Between 1 September 2017 and 28 February 2018, 20 general FE colleges that required improvement were inspected, the same number as during the last reporting year. Last year, 7 out of the 20 colleges managed to improve. This year 16 out of the 20 colleges improved.
Table 1: General further education college inspection outcomes between 1 September 2017 and 28 February 2018, by previous overall effectiveness and type of inspection

Table displaying inspection outcomes of general further education colleges between 1 September 2017 and 28 February 2018, by previous overall effectiveness and type of inspection.
The much higher proportion of good general FE colleges at inspection so far this year has increased the proportion judged good or outstanding at their most recent inspection by 8 percentage points: from 67% as at 31 August 2017 to 75% as at 28 February 2018 (see Figure 1).
2.2 Sixth-form colleges
As at 28 February 2018 there were 66 sixth-form colleges, 13 less than the 79 that were reported as at 31 August 2017. This decrease can mostly be attributed to sixth-form colleges converting to become 16 to 19 academies, an ongoing trend as reported in our previous official statistics.
There were 11 sixth-form colleges that converted to become 16 to 19 academies (3 were judged to be outstanding, 6 good, one required improvement and one had not been inspected), and a further 2 sixth-form colleges merged with general further education colleges (one good and one requires improvement).
The sixth-form colleges that have officially closed as a result of a merger will no longer be reported on separately in the Official Statistics. All but 2 of the 66 sixth-form colleges had been inspected as at 28 February 2018.
Between 1 September 2017 and 28 February 2018 15 sixth-form colleges were inspected. There were 10 full inspections and 5 short inspections (including one that converted to a full inspection). Overall, one sixth-form college was judged outstanding, 10 good and 4 requires improvement.
Outcomes from the short inspections and full routine inspections of previously requires improvement and inadequate colleges were broadly similar to last year.
During the last reporting year a greater number of risk-assessed inspections of sixth-form colleges previously judged good or outstanding were carried out: 7 out of 10 declined to requires improvement or inadequate. So far this year there have been 4 risk-assessed inspections and 2 declined to requires improvement.
At the mid-year point, the number of inspections is too small to comment on any changes in proportions between this year and last year. However, overall the inspection outcomes were weighted towards improvement rather than decline, which increased the proportion of colleges judged good or outstanding at their most recent inspection by 2 percentage points: from 81% as at 31 August 2017 to 83% as at 28 February 2018 (see Figure 1).
The sixth-form colleges that were removed from the aggregated statistics, either because they academised or merged, had no impact on the 83% of sixth-form colleges judged good or outstanding at their most recent inspection. If added back in to the data set, the proportion of colleges judged good or outstanding would remain at 83%.
2.3 16 to 19 academies
The number of 16 to 19 academies increased from 31 as at 31 August 2017 to 44 as at 28 February 2018. Most of this increase was as a result of 11 sixth-form colleges converting to become 16 to 19 academies. There was also a net increase of 2 free schools. As at 28 February 2018, 80% of the 16 to 19 academies had been inspected.
Between 1 September 2017 and 28 February 2018 6 16 to 19 academies were inspected:
- 2 risk-assessed full inspections of academies previously judged good, both of which declined to requires improvement
- 2 routine full inspections of academies previously judged requires improvement, of which one improved to good and one remained requires improvement
- 2 short inspections of previously good providers, one remained good and one inspection converted, with the provider judged outstanding
The proportion of 16 to 19 academies judged good or outstanding at their most recent inspection was 77% as at 28 February 2018, 4 percentage points higher than 31 August 2017. This increase has been caused by the sixth-form colleges converting to become 16 to 19 academies.
2.4 Independent learning providers (including employer providers)
The number of open and funded independent learning providers (including employer providers) increased by 18%, from 491 as at 31 August 2017 to 580 as at 28 February 2018.
The increase in the number of providers brought the proportion inspected down by 16 percentage points, from 82% as at 31 August 2017 to 66% as at 28 February 2018. This proportion is expected to continue to decrease, as more providers accessing apprenticeship funding have their status confirmed by the funding agency and are added to the Ofsted systems.
To mitigate the risk of many new and untested providers entering the market, monitoring visits have been introduced for a sample of new apprenticeship training providers. These visits will make 3 progress judgements based on:
- how much progress leaders have made in ensuring that the provider is meeting all the requirements of successful apprenticeship provision
- the progress leaders and managers have made in ensuring that apprentices benefit from high-quality training that leads to positive outcomes for the apprentices
- how much progress leaders and managers have made in ensuring that effective safeguarding arrangements are in place
As at 28 February 2018, one monitoring visit had been carried out, with the provider making insufficient progress across all 3 judgements.
Between 1 September 2017 and 28 February 2018 63 independent learning providers (including employer providers) were inspected. There were 33 full inspections and 30 short inspections (including those that converted to full inspections). Overall, 2% were judged outstanding, 63% good, 22% requires improvement and 13% inadequate.
Table 2: Independent learning providers (including employer providers) inspection outcomes between 1 September 2017 and 28 February 2018, by previous overall effectiveness and type of inspection

Table displaying inspection outcomes of independent learning providers between 1 September 2017 and 28 February 2018, by previous overall effectiveness and type of inspection.
As at 28 February 2018 the proportion of independent learning providers (including employer providers) judged to be good or outstanding at their most recent inspection was 80%, the same as at 31 August 2017. Independent learning providers continued to have a higher proportion of good or outstanding providers compared with employer providers, at 81% and 76% respectively.
There was a reduction in the proportion of independent learning providers (including employer providers) judged inadequate at their most recent inspection as at 28 February 2018, compared with 31 August 2017. This was largely caused by the majority of inadequate providers (9 out of 15) no longer being funded and being removed from Official Statistics. Of the 6 that remained open and funded, 2 were inspected during this reporting year: one improved to requires improvement and one remained inadequate.
Figure 8: Most recent overall effectiveness of independent learning providers (including employer providers), over time
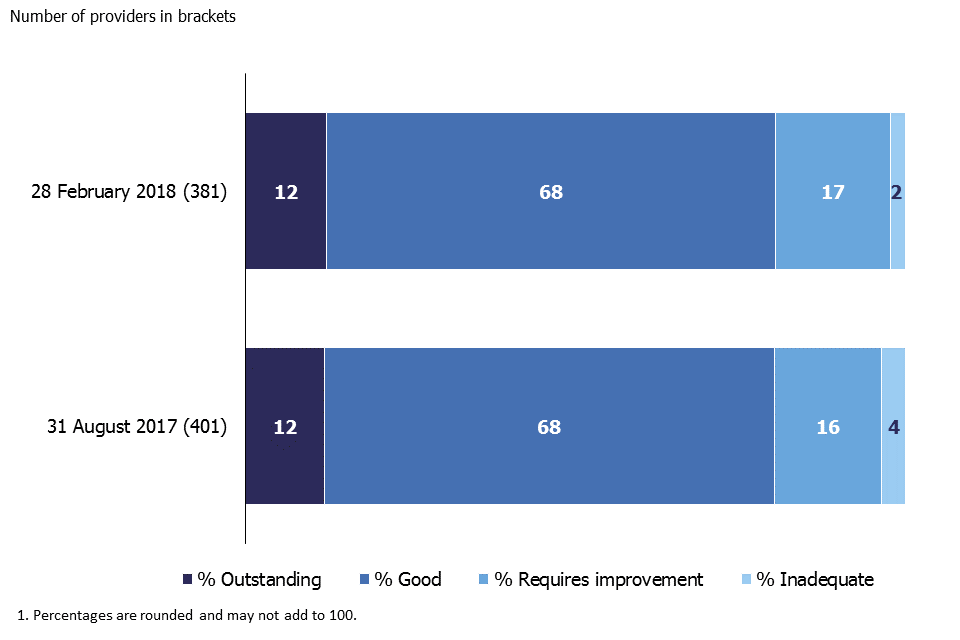
Chart displaying inspection outcomes of independent learning providers at their most recent inspection, over time.
2.5 Community learning and skills providers
The number of open and funded community learning and skills providers decreased between 1 September 2017 and 28 February 2018, from 225 to 221. All but 2 of the providers had been inspected as at 28 February 2018.
Between 1 September 2017 and 28 February 2018, 55 community learning and skills providers were inspected: 32 local authorities, 20 not for profit organisations and 3 specialist designated institutions.
There were 28 full inspections and 27 short inspections (including 2 that converted to a full inspection). Overall, 2% of the providers were judged outstanding, 73% good, 20% requires improvement and 5% inadequate. The overall proportion of providers judged good or outstanding was 75%, 4 percentage points lower than during the last reporting year.
Between 1 September 2017 and 28 February 2018 nearly double the number of community learning and skills providers improved to good (13) than declined to requires improvement or inadequate (7).
Table 3: Community learning and skills inspection outcomes between 1 September 2017 and 28 February 2018, by previous overall effectiveness and type of inspection
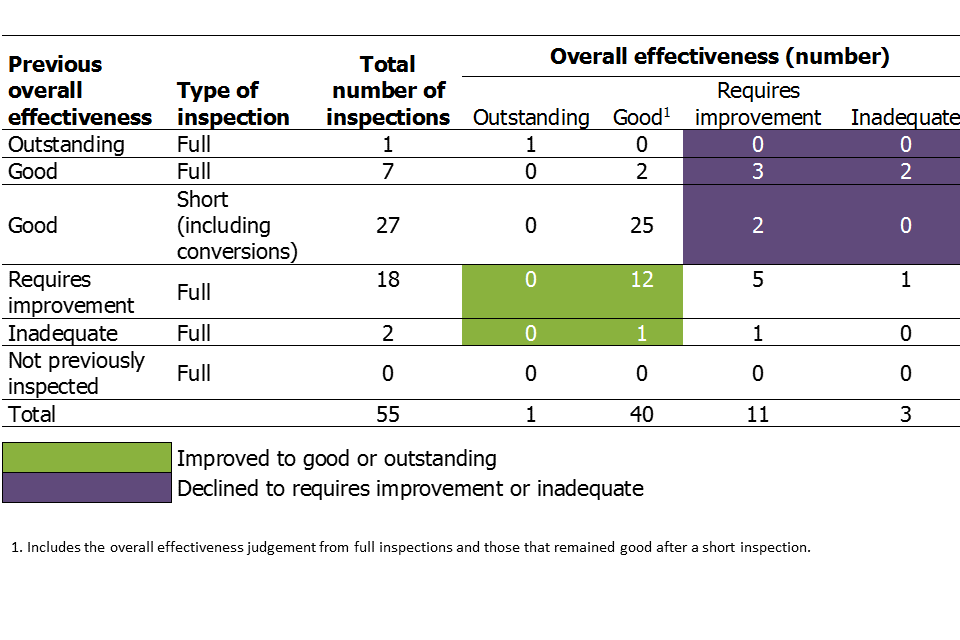
Table displaying inspection outcomes of community learning and skills providers between 1 September 2017 and 28 February 2018, by previous overall effectiveness and type of inspection.
All 3 of the provider types that make up the community learning and skills providers group saw more providers improving to good or outstanding than declining to requires improvement or inadequate, although the local authorities had the largest difference:
- 8 local authorities improved to good, compared with 4 that declined to requires improvement or inadequate
- 4 not for profit organisations improved to good, compared with 3 that declined to requires improvement or inadequate
- one specialist designated institution improved to good, none declined
Unlike the other provider groups, community learning and skills providers had a lower proportion of previously good providers remain good at inspection this year compared with last year. Along with a lower proportion of providers that previously required improvement improving to good compared with last year However, as the inspection outcomes overall were weighted towards improvement rather than decline, they still had a positive effect on the most recent outcomes.
The proportion of community learning and skills providers judged to be good or outstanding at their most recent inspection was 86% as at 28 February 2018, an increase of 3 percentage points compared with 31 August 2017 (see Figure 1).
2.6 Prisons and young offender institutions
As at 28 February 2018, there were 114 prisons and young offender institutions (YOIs). All of the prisons and YOIs had been inspected.
Ofsted contributed to 20 prison and YOI inspections where the reports were published between 1 September 2017 and 28 February 2018. Overall, 8 of the prisons and YOIs were judged good for overall effectiveness of learning and skills and work activities (overall effectiveness), 11 requires improvement and one inadequate.
For 7 of the 20 prisons and YOIs, this was the first time they had received an overall effectiveness judgement since it was introduced in March 2014.[footnote 2] Six out of the 7 were judged good and one was judged requires improvement.
Thirteen of the prisons and YOIs had been inspected before:
- 2 were previously judged good - both declined to requires improvement
- 8 were previously judged requires improvement - 2 improved to good, 5 remained requires improvement and one declined to inadequate
- 3 were previously inadequate - all of them improved to requires improvement
The in-year inspection outcomes had a positive effect on the most recent inspection outcomes for all prisons and YOIs. Overall, the proportion of prisons and YOIs judged good or outstanding for overall effectiveness at their most recent inspection increased by 3 percentage points: from 42% as at 31 August 2017 to 46% as at 28 February 2018.
Figure 9: Overall effectiveness of learning and skills and work activities (overall effectiveness) of prisons and young offender institutions at their most recent inspection, over time
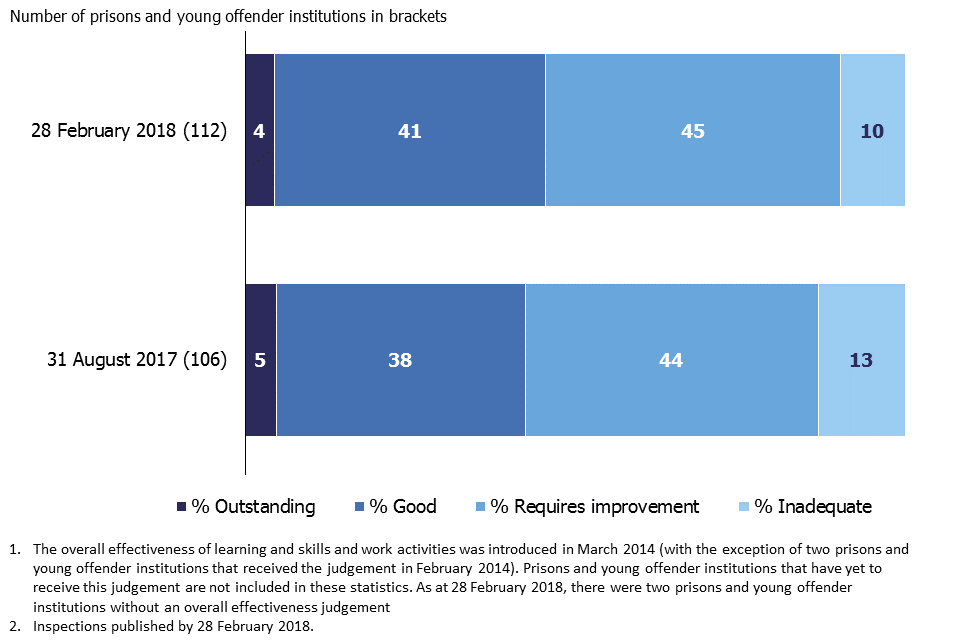
Table displaying inspection outcomes of community learning and skills providers between 1 September 2017 and 28 February 2018, by previous overall effectiveness and type of inspection.
2.7 Specialist further education colleges
Between 1 September 2017 and 28 February 2018, 4 specialist further education colleges were inspected. There were:
- 3 short inspections, which resulted in all of the colleges remaining good
- one full inspection, in which the provider improved from requires improvement to good
As at 28 February 2018, there were 16 open and funded specialist further education colleges, of which 2 were judged outstanding, 12 good, one requires improvement and one inadequate at their most recent inspection.
2.8 Independent specialist colleges
Between 1 September 2017 and 28 February 2018, 18 independent specialist colleges (ISCs) were inspected. There were:
- 7 short inspections, which resulted in all of the colleges remaining good
- 5 full inspections of colleges that previously required improvement; 3 improved to good and 2 remained requires improvement.
- 4 full inspections of colleges that were being inspected for the first time; 2 were judged good and 2 required improvement
- 2 full inspections of non-exempt previously outstanding providers; one remained outstanding, one declined to good
As at 28 February 2018, there were 80 open and funded ISCs, of which 63 had been inspected. Overall, 8% were judged outstanding, 76% good and 16% requires improvement at their most recent inspection. None were judged to be inadequate.
2.9 Higher education institutions
The number of higher education institutions (HEIs) included within these statistics has increased from 27 as at 31 August 2017, to 60 as at 28 February 2018. This increase has resulted from the Department for Education’s apprenticeship accountability statement in April 2017, which stated that Ofsted would start to inspect the quality of apprenticeships at levels 4 and 5. The policy is at an early stage of implementation, with further changes to the number of HEIs in scope for inspection expected as the year progresses.
Between 1 September 2017 and 28 February 2018, the further education provision being delivered in 10 HEIs was inspected. There were 7 short inspections, which resulted in the HEIs remaining good. There were 3 full inspections of providers previously judged good or outstanding, of which one remained outstanding, one declined from outstanding to good and one declined from good to requires improvement.
Of the 27 HEIs that had been inspected as at 28 February 2018, 8 were judged to be outstanding, 14 good and 3 required improvement the other 2 were no longer open and funded as at 28 February 2018. None of the HEIs were judged to be inadequate.
3. Revisions to previous release
3.1 In-year statistics
The statistics published in November 2017 reported on inspections carried out between 1 September 2016 and 31 August 2017, where the inspection report was published as at 30 September 2017. One short inspection of an independent learning provider that took place during this period was published after 30 September 2017. The provider remained good at inspection.
Whilst this addition does not affect the overall messages of the main findings, tables and charts, some percentages have been affected by one percentage point.
A revised provider level dataset for inspections carried out between 1 September 2016 and 31 August 2017 has been published alongside these Official Statistics.
3.2 Most recent inspection outcome statistics
The most recent inspection outcome statistics have been updated, dating back to 1 September 2015, to match our policy on college mergers:
A newly merged college will normally be inspected as a new provider within 3 years of the merger. This will normally be a full inspection. For inspection purposes, regardless of the type of merger, all merged colleges will be viewed as ‘new’ colleges. A newly merged college will not carry forward any inspection grades from predecessor colleges. It will have no inspection grade until after the first full inspection.
This change has had an impact on the historic most recent statistics as at 31 August 2016 and 31 August 2017. Revised provider level datasets for both of these dates have been published alongside these Official Statistics.
For the most recent statistics as at 31 August 2016, 8 general FE colleges and one sixth-form college had their inspection histories removed from our statistics. Whilst this change does not affect the overall messages of the main findings, tables and charts as at 31 August 2016, some percentages have been affected by one percentage point.
For the most recent statistics as at 31 August 2017, 28 general FE colleges and one sixth-form college had their inspection histories removed from our statistics. The vast majority of the overall messages within the main findings, tables and charts as at 31 August 2017 are not affected, but some percentages have been changed by one percentage point. The biggest change was in the proportion of general FE colleges judged good or outstanding, which decline by 2 percentage points from 69% to 67%, as reported in our main findings published in November 2017.
The short inspection referred to in the above section (on in-year statistics) has also created a small amendment to the most recent statistics, as the provider’s latest inspection as at the 31 August 2017 was the short inspection, rather than a full inspection.
As this inspection was a short inspection at which the provider remained good, it did not have any impact on the tables or charts published.
In addition to this there was another short inspection that took place between 1 September 2015 and 31 August 2016, which had its inspection report withdrawn at the point of reporting. However, this has since been republished and as such is now included. This short inspection did not impact on the statistics as the provider remained good.
Both amendments are available in the revised datasets published alongside these Official Statistics.
3.3 Prisons and young offender in-year statistics
In statistics on inspections published between 1 September 2015 and 31 August 2016, one prison was incorrectly recorded as good for overall effectiveness, when it had been judged inadequate. This change decreases the proportion judged good from 36% to 33%, and increases the proportion judged inadequate from 12% to 14%. A revised table for inspection outcomes between 1 September 2015 and 31 August 2016 is published alongside these Official Statistics.
3.4 Prisons and young offender institutions most recent inspection outcome statistics
In the most recent statistics as at 31 August 2017, published in November 2017, one prison was incorrectly not included. This was due to 2 prisons sharing a site, with only one prison being including in the most recent statistics. The prison was judged requires improvement at its most recent inspection.
Additionally the prison mentioned above (in the in-year statistics) was recorded as good in the most recent statistics, when it should have been recorded as inadequate.
Whilst these changes do not affect the overall messages of the main findings, tables and charts, some percentages have been affected by one percentage point
Revisions to data in this publication are published in line with Ofsted’s revisions policy for official statistics.
4. Notes
Please note for the statistics as at 28 February 2018, a different methodology has been applied for the most recent inspection outcome statistics, compared with the methodology published in our quality report.
For a small number of providers that were funded as at 28 February 2018, their funding was not confirmed by the Funding Agency until after March 2018. Therefore they were not included within the Official Statistics data cut. However, in the interests of transparency the decision was taken to include these providers. This change improves the coverage of the data and makes it more accurate. This is a one-off change, with the expectation of reverting back to the published methodology for the next publication.
4.1 Full inspections
Providers judged outstanding at their most recent inspection are not normally subject to routine inspection.[footnote 3] However, an outstanding provider may be risk assessed to receive a full inspection where its performance declines or there is another compelling reason, such as potential safeguarding issues. Providers judged good for overall effectiveness at their most recent inspection will usually be inspected within the 3 years from September 2015. This will normally be a short inspection (see below) but may be a risk-assessed full inspection where information suggests that this is the most appropriate course of action, for example if the provider’s performance has declined. A provider judged to require improvement at their most recent inspection will normally have a full re-inspection within 12 to 24 months of its previous inspection. Ofsted will monitor providers judged as inadequate and re-inspect them within 15 months of publication of their last full inspection report.[footnote 4]
4.2 Short inspections
Providers awarded a grade of good for overall effectiveness at their previous inspection will usually receive a short inspection.
A short inspection will determine whether the provider continues to provide a good standard of education/training for learners and whether safeguarding is effective.
A short inspection will not make individual graded judgements and will not change the provider’s overall effectiveness grade.
The lead inspector can choose to convert the short inspection to a full inspection where:
- there is insufficient evidence to confirm that the provider remains good
- there are concerns that there is evidence that the provider may no longer be good, which may include concerns about safeguarding
- if there is sufficient evidence of improved performance to suggest that the provider may be judged outstanding
If the inspection is converted to a full inspection, inspectors will make the full set of graded judgements. As a result of the converted inspection the provider could improve, decline or remain the same
The quality report for these official statistics contains an explanation of the methodology used and the relevant inspection frameworks, along with other useful information.
5. Glossary
General further education colleges
General further education colleges offer a range of education and training opportunities for learners aged from 14 years upwards, including adults. They include tertiary colleges, which specialise in land based education and training.
Sixth-form colleges
A sixth-form college is an educational institution where students aged 16 to 18 typically study for advanced school-level qualifications, such as A levels, or school-level qualifications such as GCSEs.
Specialist further education colleges
Specialist further education colleges are colleges who specialise in the provision of agricultural, horticultural or art, design and technology courses.
Independent specialist colleges
Independent specialist colleges provide education and training for students with complex learning difficulties and/or disabilities, whose learning needs cannot be met by their local college or provider.
Independent learning providers (including employer providers)
Independent learning providers are companies which provide government funded education. The category includes employer providers who only offer government funded training to their own employees.
Community learning and skills providers
Community learning and skills providers include local authorities, charities, voluntary, not for profit companies and community organisations, specialist designated institutions and community interest companies. Their provision is diverse in character and aims to meet the needs and interests of a wide range of communities. Courses include: those that lead to a qualification; programmes leading to qualifications whilst in employment (such as apprenticeships); provision for informal adult learning; and provision for social and personal development. Community learning and skills providers were previously categorised as adult and community learning providers.
16 to 19 academies
These are state-funded, non-fee-paying schools independent of local authorities which cater for pupils aged 16 to 19.
Dance and drama colleges
Colleges that specialises in delivering dance and drama courses.
Higher education institution
Where higher education institutions (such as universities) offer further education courses and/or level 4 or 5 apprenticeships, these are subject to inspection by Ofsted.
National Careers Service contractors
The National Careers Service provides information, advice and guidance for those aged 13 and over across England. The service is delivered in 12 geographical regions by area based prime contractors and a national contact centre by a national contractor. These National Careers Service contractors are subject to an Ofsted inspection.
Prisons and youth offender institutions
Ofsted undertakes inspections in prisons and youth offender institutions in partnership with Her Majesty’s Inspectorate of Prisons (HMIP). Ofsted inspectors HMI evaluate the quality of learning and skills in prisons, including young offender institutions and secure units for young people and provision in community settings. Ofsted does not publish inspection reports for prisons and young offender institutions – these reports can be found on the HMIP website.
6. Further information
6.1 Contact for comments or feedback
If you have any comments or feedback on this publication, please contact Sarah Pearce on 03000 130 632 or Sarah.Pearce@ofsted.gov.uk.
6.2 Acknowledgements
Thanks to the following for their contribution to this statistical release: Stuart Lloyd, John Hadler and Kieran Rudge.
-
The following provider types are not exempt from routine inspection: higher education institutions offering further education, local authority providers, independent specialist colleges and dance and drama colleges. ↩
-
Two of the prisons were awarded an overall effectiveness judgement in late February 2014. ↩
-
The following types of provision are still subject to routine inspection when they have been judged outstanding: higher education institutions offering further education; local authority providers; independent specialist colleges; dance and drama colleges; and learning and skills provision in prisons. ↩
-
Full re-inspections or re-inspection monitoring visits may not happen in certain circumstances, for example where a provider’s funding contract has been terminated. ↩