Further education and skills inspections and outcomes as at 28 February 2017
Published 28 June 2017

© Crown copyright 2017
This publication is licensed under the terms of the Open Government Licence v3.0 except where otherwise stated. To view this licence, visit nationalarchives.gov.uk/doc/open-government-licence/version/3 or write to the Information Policy Team, The National Archives, Kew, London TW9 4DU, or email: psi@nationalarchives.gov.uk.
Where we have identified any third party copyright information you will need to obtain permission from the copyright holders concerned.
This publication is available at https://www.gov.uk/government/statistics/further-education-and-skills-inspections-and-outcomes-as-at-28-february-2017/further-education-and-skills-inspections-and-outcomes-as-at-28-february-2017
This release contains:
- provisional data for the most recent inspection outcomes as at 28 February 2017
- provisional data for inspections conducted between 1 September 2016 and 28 February 2017
The proportion of providers judged good or outstanding at their most recent inspection has declined in 3 out of the 4 biggest provider groups
The proportion of general further education colleges, sixth form colleges and independent learning providers (including employer providers) judged good or outstanding has declined since 31 August 2016.
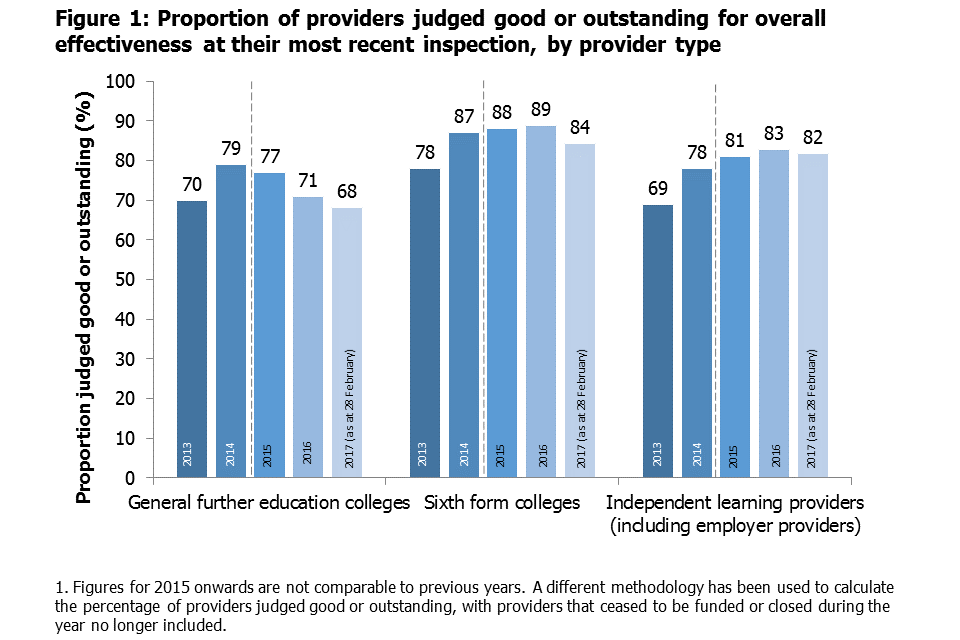
Figure1
All of the previously inadequate general further education colleges inspected this year improved
Over the first 6 months of 2016/17, the 3 previously inadequate general further education colleges inspected improved, 2 to requires improvement and one to good.
The proportion of good or outstanding community learning and skills providers has increased by one percentage point
This was driven by improvement, with 8 out of the 11 providers that previously required improvement or were inadequate, improving to be judged good for overall effectiveness.
1. Introduction
In-year inspection outcomes
Between 1 September 2016 and 28 February 2017, 201 further education and skills providers were inspected. This included 62 colleges, 70 independent learning providers (including employer providers) and 39 community learning and skills providers. Ofsted also contributed to the inspections of 21 prisons and young offender institutions, where the reports were published between 1 September 2016 and 28 February 2017.
The 201 inspections consisted of 151 full inspections and 50 short inspections (including conversions). These inspections can be broken down in to the following categories:
- 71 risk assessed full inspections of previously good or outstanding providers
- 50 short inspections of previously good providers
- 54 full re-inspections of previously requires improvement or inadequate providers
- 26 full inspections of new providers (those that were inspected for the first time)
The short inspections resulted in 39 providers remaining good, with 11 short inspections converting to a full inspection. From these converted inspections 5 providers improved to outstanding, 3 remained good and 3 declined to requires improvement.
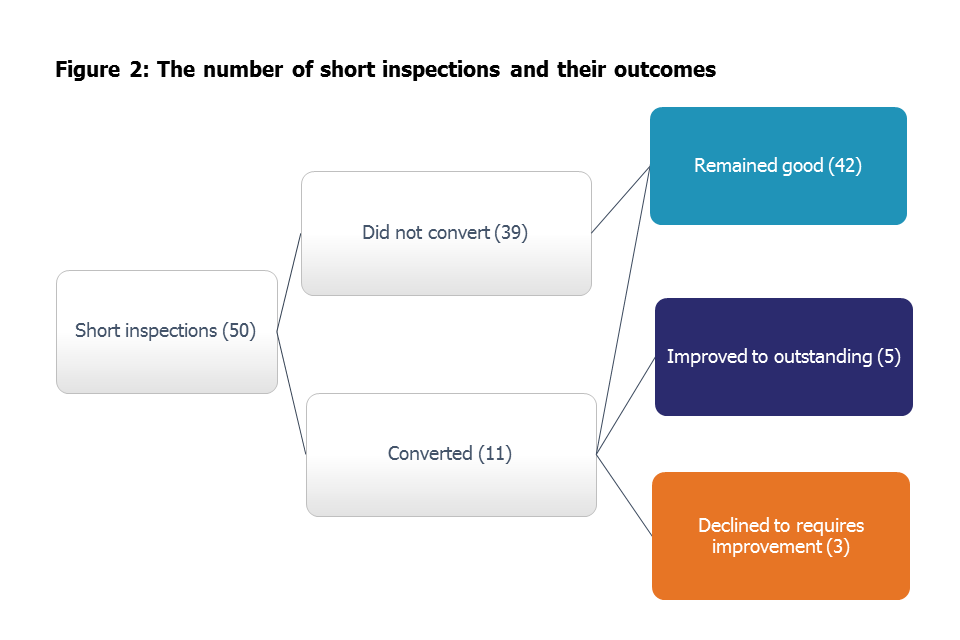
Figure2
Overall, 6% of the providers were judged to be outstanding, 56% good, 29% requires improvement and 8% inadequate.
Most recent inspection outcomes
As at 28 February 2017, there were 1,198 open and funded further education and skills providers, of which 89% had been inspected. This is down from 91% as at 31 August 2016, largely due to the increase in new independent learning providers that have yet to be inspected[footnote 1].
The proportion of all further education and skills providers judged to be good or outstanding at their most recent inspection was 80% as at 28 February 2017. This is a decline of one percentage point compared with the position as at 31 August 2016. Three of the 4 biggest provider groups saw the proportion of providers judged good or outstanding decline between 31 August 2016 and 28 February 2017 (see Figure 3).
Independent learning providers (including employer providers) had the largest number of previously good or outstanding providers decline over the first 6 months of 2016/17. However, as they are the group with the largest number of providers, the number declining had a small effect on the proportion judged good or outstanding, which dropped by one percentage point.
Conversely sixth form colleges had a smaller number of colleges decline, but as they are a much smaller group of providers, this had a bigger effect on the proportion judged good or outstanding, which declined by 4 percentage points. Despite having the largest percentage point decline, sixth form colleges had the highest proportion of providers judged good or outstanding, out of the 4 biggest provider groups, as at 28 February 2017.
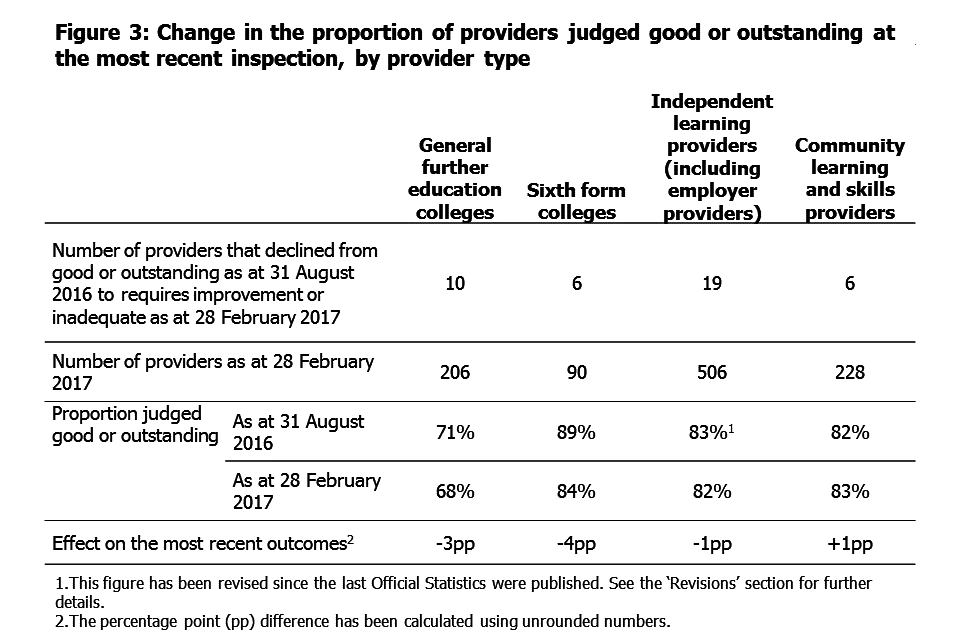
Figure3
Within each of the 4 largest provider groups there were also a number of providers that improved from requires improvement or inadequate to good. There were:
- 4 general further education (FE) colleges
- 2 sixth form colleges
- 12 independent learning providers (including employer providers)
- 8 community learning and skills providers
Out of the 4 biggest provider groups, community learning and skills providers were the only group to have more providers improve than decline over the first 6 months of 2016/17.
As at 28 February 2017, 15% of further education and skills providers were judged to be outstanding at their most recent inspection (160 providers). Since the Education Act 2011 came in to force, most of the providers judged to be outstanding have been exempt from routine inspection[footnote 2] and are only inspected if there is a cause for concern[footnote 3].
2. Main findings
General further education colleges
Since the 31 August 2016, there have been 2 mergers (affecting 4 colleges) and the addition of one new college in London, giving a total of 206 general FE colleges as at 28 February 2017. All of the general FE colleges have been inspected, with the exception of the new college[footnote 4].
Over the first 6 months of the reporting year, between 1 September 2016 and 28 February 2017, 40 general FE colleges were inspected. There were 33 full inspections and 7 short inspections. The proportion judged to be good or outstanding was 40%, 11 percentage points lower than 2015/16. None of the colleges were judged to be outstanding during this period.
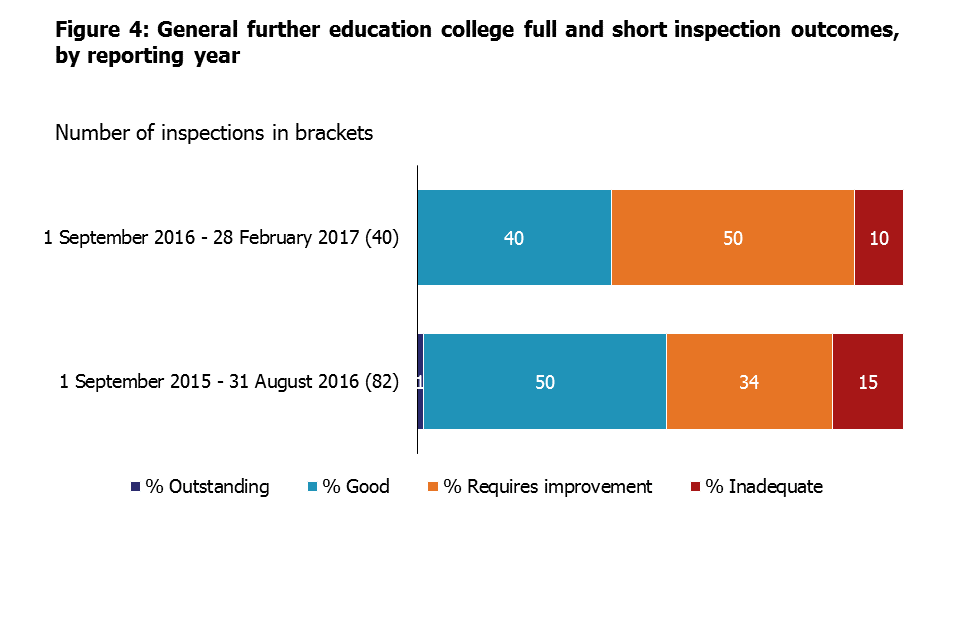
Figure4
A higher proportion of re-inspections of colleges previously judged requires improvement or inadequate were carried out compared with 2015/16. So far this year more of the colleges that previously required improvement have remained requires improvement at inspection.
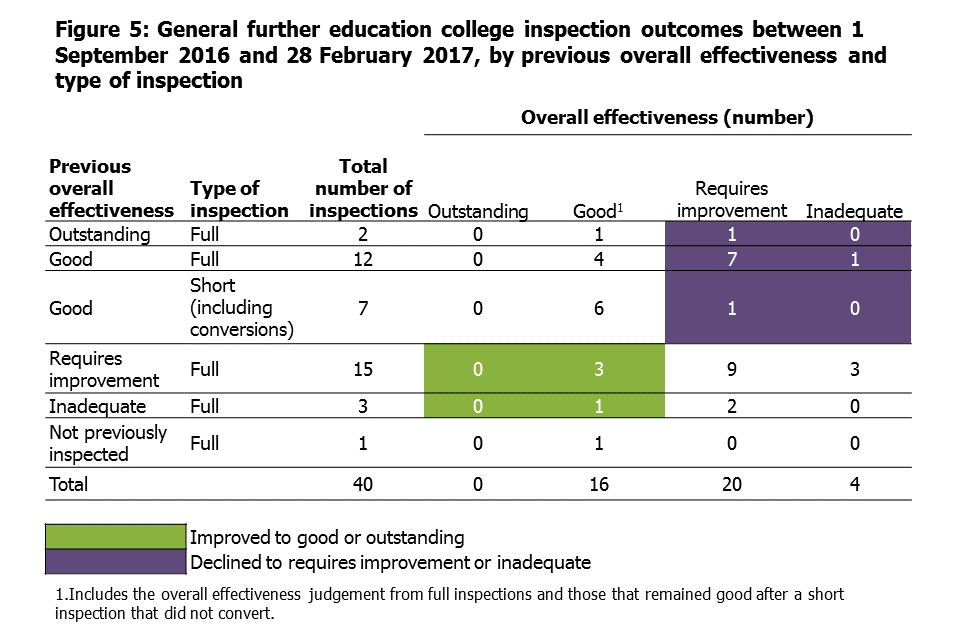
Figure5
Overall more general FE colleges declined to requires improvement or inadequate (10), than improved to be good or outstanding (4) over the first 6 months of the year. This had a negative effect on the proportion of general FE colleges judged to be good or outstanding at their most recent inspection.
As at 28 February 2017, the proportion of general FE colleges judged to be good or outstanding was 68%. This is down from 71% as at 31 August 2016, continuing the downward trend reported over the last 2 years (see Figure 1). The mergers and addition of a new college, mentioned at the start of this section, had a negligible effect on the percentage change.
Sixth form colleges
As at the 28 February 2017, there were 90 sixth form colleges. These are the same 90 colleges that appeared in the last set of Official Statistics, as at 31 August 2016. All except one sixth form college has been inspected.
Over the first 6 months of the reporting year, between 1 September 2016 and 28 February 2017, 19 sixth form colleges were inspected. There were 11 full inspections and 8 short inspections. Overall, 63% of the colleges were judged to be good or outstanding, which was 6 percentage points lower than 2015/16.
All of the sixth form colleges that received a short inspection either remained good (6[footnote 5] out of 8) or improved to be outstanding (2 out of 8). Three quarters of the colleges that were risk assessed to receive a full inspection declined (6 out of 8).
Over the first 6 months of 2016/17 more sixth form colleges declined to requires improvement or inadequate (6), than improved to be good or outstanding (2). This had a negative effect on the most recent inspection outcomes for the 90 sixth form colleges.
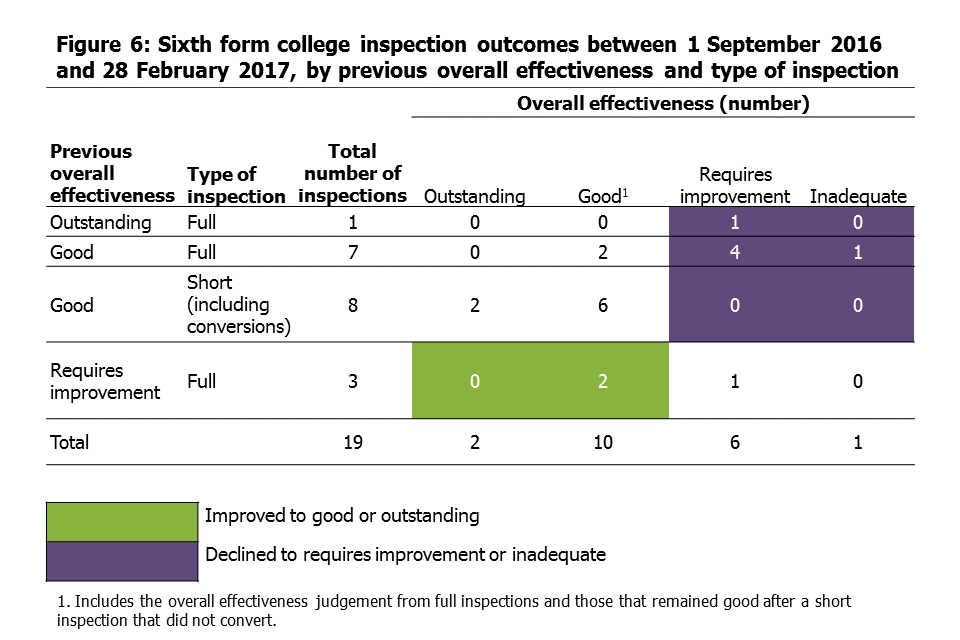
Figure6
The percentage judged good or outstanding declined for the first time in 3 years, by 4 percentage points; from 89% as at 31 August 2016, to 84% as at 28 February 2017 (see Figure 1).
Independent learning providers (including employer providers)
There were 506 open and funded independent learning providers (including employer providers) as at 28 February 2017. This represents a 6% increase since 31 August 2016, when there were 477 providers.
Breaking this down by the 2 different provider types within the group:
- independent learning providers – 433 providers as at 28 February 2017, up from 402 as at 31 August 2016, an increase of 8%
- employer providers – 73 providers as at 28 February, down from 75 as at 31 August 2016, a decrease of 3%
The increase was mainly as a result of ‘adult loans only’ funded providers being included in scope for Ofsted inspections from September 2016. This large increase over a small period of time meant that a fifth of independent learning providers (including employer providers) were yet to receive their first inspection as at 28 February 2017.
Between 1 September 2016 and 28 February 2017, 70 independent learning providers (including employer providers) were inspected. There were 55 full inspections and 15 short inspections. The proportion of providers judged to be good or outstanding was 57%, 16 percentage points lower than for 2015/16.
A higher proportion of previously good providers that were risk assessed for a full inspection declined this year when compared with last year.
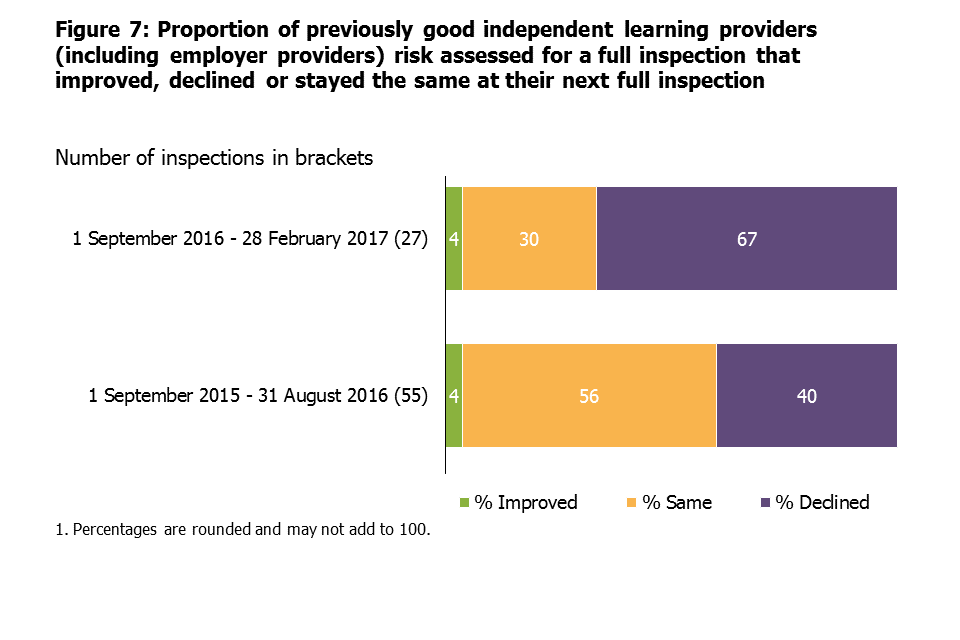
Figure7
Twenty providers declined to requires improvement or inadequate over the first 6 months of the year[footnote 6] , from both full risk assessed inspections and converted short inspections. This was greater than the number that improved to be good or outstanding (12).
Overall this had a one percentage point effect on the proportion of providers judged to be good or outstanding at their most recent inspection, which declined from 83%[footnote 7] as at 31 August 2016 to 82% as at 28 February 2017 (see Figure 1).[footnote 8]
Community learning and skills providers
As at 28 February 2017 there were 228 community learning and skills providers. This represents a 3% decrease since 31 August 2016, when there were 235 providers.
Breaking this down by the 3 different provider types within the group:
- local authority providers – 138 providers as at 28 February 2017, down from 140 as at 31 August 2016, a decrease of 1%
- not for profit organisations – 79 providers as at 28 February 2017, down from 84 as at 31 August 2016, a decrease of 6%
- specialist designated institutions – 11 providers as at 28 February 2017, no change from 31 August 2016
Eight community learning and skills providers left the sector over the first 6 months of 2016/17. Reasons included mergers, contracts being transferred to other providers and funding ceasing. Six of the providers that left were judged to be good at their most recent inspection.
All but 2 of the 228 community learning and skills providers had been inspected by 28 February 2017.
Between 1 September 2016 and 28 February 2017, 39 community learning and skills providers were inspected. There were 24 full inspections and 15 short inspections. The proportion judged to be good or outstanding was 77%, which was 7 percentage points higher than 2015/16. None of the providers were judged to be outstanding during this period.
Eight out of the 11 providers that previously required improvement or were inadequate, improved to be judged good for overall effectiveness. This included all 5 not for profit organisations.
As the overall number of providers improving to be good or outstanding (8) was slightly higher than those declining (6), the proportion of providers judged to be good or outstanding at their most recent inspection increased by one percentage point, from 82% as at 31 August 2016 to 83% as at 28 February 2017 (see Figure 8).
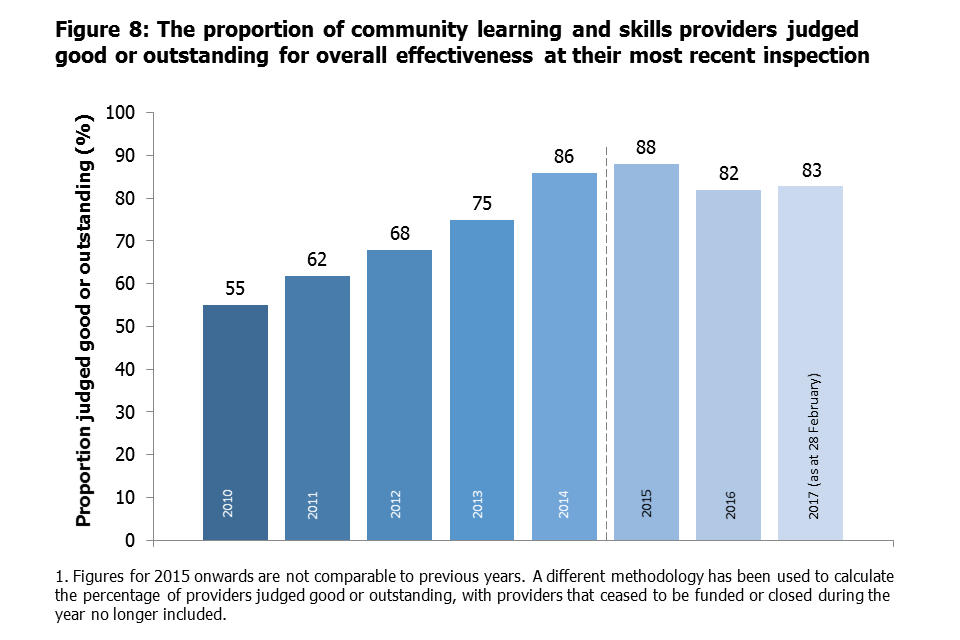
Figure8
Prisons and young offender institutions
As at the 28 February 2017, all of the 113 prisons and young offender institutions had been inspected. Of these, 85% had received an overall effectiveness judgement since its introduction in March 2014[footnote 9].
Ofsted contributed to the inspections of 21 prisons and young offender institutions, where the reports were published between 1 September 2016 and 28 February 2017.
The proportion judged to be good or outstanding for overall effectiveness was 67%, which was 26 percentage points higher compared with 2015/16. Inspection outcomes across all the judgements were much higher when compared with last year.
Overall the proportion of prisons judged good or outstanding for overall effectiveness at their most recent inspection has increased by 5 percentage points - from 35% as at 31 August 2016 to 41% as at 28 February 2017.
This increase was caused by 14 prisons, which received an overall effectiveness judgement for the first time, now being included in the most recent statistics. There was a balanced picture of improvement and decline for those with a previous overall effectiveness judgement, which did not impact on the proportion judged to be good or outstanding.
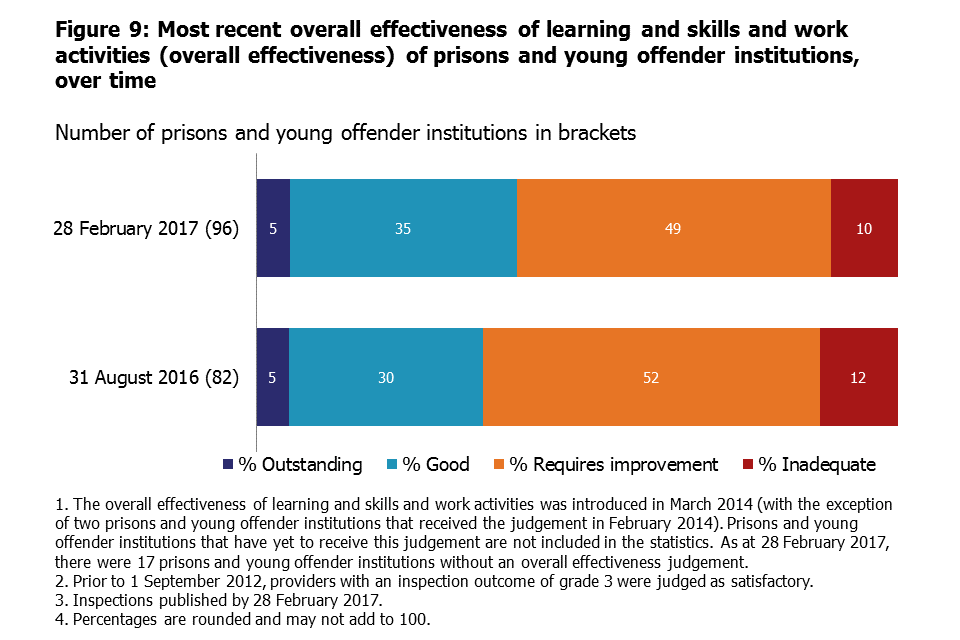
Figure9
3. Revisions
General further education colleges
One specialist further education college was incorrectly included as a general further education college within the most recent statistics as at 31 August 2016, published on 24 November 2016. This revision does not affect the data, tables or charts published.
The number of general further education colleges reported in the official statistics key findings decreases by one. The percentages remain unchanged.
Independent learning providers (including employer providers)
One independent learning provider was incorrectly included within the most recent statistics as at 31 August 2016, published on 24 November 2016.
The revision has the following impact to the most recent statistics as at 31 August 2016:
- within the data, tables and charts published, the total number of all further education and skills providers and the number judged requires improvement both decrease by one - the percentages remain unchanged
- within the data, tables and charts published, the total number of independent learning providers (including employer providers) and the number judged requires improvement both decrease by one - the percentages remain unchanged
- the number of independent learning providers reported in the official statistics key findings decreases by one - the percentages remain unchanged
- the proportion of independent learning providers (including employer providers) judged good or outstanding, as reported in the official statistics key findings and the Ofsted Annual Report for 2015/16, increase by one percentage point from 82% to 83%
Prisons and young offender intuitions
In the Ofsted Annual Report for 2015/16, we reported that 80 prisons and young offender institutions had been awarded an overall effectiveness judgement as at 31 August 2016, of which 53% required improvement and 13% were inadequate.
These figures have been revised for 31 August 2016, to 82 prisons and young offender institutions with an overall effectiveness judgement, of which 52% required improvement and 12% were inadequate. The proportion judged good or outstanding remains unchanged.
4. Notes
From the 31 August 2015, the most recent inspection outcomes include providers wholly or partly funded by the Education and Skills Funding Agency, or their predecessor funding agencies, at that point in time. For 31 August 2014 and before, the most recent inspection outcomes include:
- providers wholly or partly funded by the Skills Funding Agency or the Education Funding Agency at that point in time
- providers who had lost funding or closed during the corresponding reporting year
Full inspections
Providers judged outstanding at their most recent inspection are not normally subject to routine inspection.[footnote 10] However, an outstanding provider may be risk assessed to receive a full inspection where its performance declines or there is another compelling reason, such as potential safeguarding issues.
Providers judged good for overall effectiveness at their most recent inspection will usually be inspected within the 3 years from September 2015. This will normally be a short inspection (see below) but may be a risk assessed full inspection where information suggests that this is the most appropriate course of action, for example if the provider’s performance has declined.
A provider judged to require improvement at their most recent inspection will normally have a full re-inspection within 12 to 24 months of its previous inspection.
Ofsted will monitor providers judged as inadequate and re-inspect them within 15 months of publication of their last full inspection report[footnote 11].
Short inspection
Providers awarded a grade of good for overall effectiveness at their previous inspection will usually receive a short inspection.
A short inspection will determine whether the provider continues to provide a good standard of education/training for learners and whether safeguarding is effective.
A short inspection will not make individual graded judgements and will not change the provider’s overall effectiveness grade.
The lead inspector can choose to convert the short inspection to a full inspection where:
- there is insufficient evidence to confirm that the provider remains good
- there are concerns that there is evidence that the provider may no longer be good, which may include concerns about safeguarding
- if there is sufficient evidence of improved performance to suggest that the provider may be judged outstanding
If the inspection is converted to a full inspection, inspectors will make the full set of graded judgements. As a result of the converted inspection the provider could improve, decline or remain the same
The quality report for these official statistics contains an explanation of the methodology used and the relevant inspection frameworks, along with other useful information, such as where to find previously published further education and skills official statistics.
In 2016, the National Statistician published new guidance covering management information and official statistics.
If you have any comments or feedback on this publication, please contact Sarah Pearce on 03000 130 632 or Sarah.Pearce@ofsted.gov.uk
Acknowledgements
Thanks to the following for their contribution to this statistical release: Stuart Lloyd, Marc McGreavy and Paul Grainger.
-
New providers will normally be inspected within 3 years. ↩
-
With the exception of higher education institutions offering further education, local authority providers, independent specialist colleges, dance and drama colleges and learning and skills provision in prisons. ↩
-
For example where the performance of a provider declines or there is another compelling reason, such as potential safeguarding issues. ↩
-
The merged colleges have yet to be inspected as a new entity. ↩
-
This includes one short inspection that converted to a full inspection, with the sixth form college judged to be good for overall effectiveness. ↩
-
This includes one provider that lost funding after their inspection and therefore was not included within the most recent statistics as at 28 February 2017. ↩
-
This figure has been revised since the last Official Statistics were published. See the ‘Revisions’ section for further details. ↩
-
Providers that were inspected for the first time or reappeared in the statistics as they had regained funding, along with those leaving the sector, had a negligible effect on the decline, as there was a roughly equal split between those judged good or outstanding and those judged to be requires improvement or inadequate. ↩
-
Two of the prisons were awarded an overall effectiveness judgement in late February 2014. ↩
-
The following types of provision are still subject to routine inspection when they have been judged to be outstanding: higher education institutions offering further education; local authority providers; independent specialist colleges; dance and drama programmes; and learning and skills provision in prisons. ↩
-
Full re-inspections or re-inspection monitoring visits may not happen in certain circumstances, for example where a provider’s funding contract has been terminated. ↩