Fostering in England 2015 to 2016: key findings
Published 28 February 2017

© Crown copyright 2017
This publication is licensed under the terms of the Open Government Licence v3.0 except where otherwise stated. To view this licence, visit nationalarchives.gov.uk/doc/open-government-licence/version/3 or write to the Information Policy Team, The National Archives, Kew, London TW9 4DU, or email: psi@nationalarchives.gov.uk.
Where we have identified any third party copyright information you will need to obtain permission from the copyright holders concerned.
This publication is available at https://www.gov.uk/government/statistics/fostering-in-england-1-april-2015-to-31-march-2016/fostering-in-england-2015-to-2016-key-findings
This release covers:
- the numbers and profile of foster carers and foster places and placements, in both local authority (LA) and independent fostering agencies (IFA)
- data relating to types of foster care, registrations, de-registrations, to fostered children, and a range of other subjects
- the period between 1 April 2015 and 31 March 2016
There has been little change in the number of fostering households and children in foster care.
There were 44,320 approved fostering households as at 31 March 2016, less than a 1% fall from the previous year (44,625). There were 51,805 children and young people in placement on 31 March 2016, the same as last year’s figure.
There was a large drop in applications to be foster carers.
The reported number of applications fell by one third. There were 11,460 applications in 2015 to 2016, compared to 16,920 the previous year.
There are more approved family and friends households this year.
There has been a 13% increase in the number of family and friends households from 4,145 on 31 March 2015 to 4,665 in 2016.
A large minority of children who went missing had no Return Home Interview (RHI).
Of the 3,055 children who went missing, 46% did not have an RHI (1,405).
More care leavers stayed living with their former foster carers.
Although the number of care leavers went up 17% to 4,025, the number who stayed living with their former foster carers increased by a higher rate (22%) to 2,190.
Children were more likely to experience a change in educational placement if they also experienced an unplanned ending.
Of the children who experienced at least one unplanned ending, 12% also experienced an education placement change, compared to 4% of those who had no unplanned endings.
1. Introduction
This statistical release covers local authority (LA) fostering agencies and independent fostering agencies (IFAs) in England in the year 1 April 2015 to 31 March 2016. It includes data about fostered children, foster carers, recruitment, and capacity of providers.
This release uses data returned to Ofsted by the agencies, and so may reflect both changes that have happened in the sector and changes that have happened in how this is being recorded and reported by the agencies.
As the data collection does not indicate the location of foster carers and children, IFAs cannot be neatly attached to regions; therefore, any regional analysis refers only to LA fostering agencies within that region.
Following the introduction of the Ofsted URNs into the Department for Education’s (DfE) statutory SSDA903 data return for all looked after children, the Ofsted fostering dataset was reviewed to reduce duplication of data being collected and to make the data more accurate. As a result, a total of 40 data items were removed from the fostering dataset collection, relating to characteristics of children, children’s placement types, and education. The original intention was to include data from the SSDA903 data collection in this report, but, unfortunately, the data was not available in time to be included in this release.
The data collection also changed from being at aggregate level to being at household and child level for key data items, based on those placed as at 31 March, looking back over the previous 12 months. As a result there is limited comparability with previous years for these data items:
- child data: collected primarily only for children in placement with the agency as at 31 March 2016; apart from a small number of data items collected at aggregate level, data on children who left the agency during the year was not collected
- primary placement offer: collected at household rather than agency level
- reasons children went missing: collected as one primary reason per child, rather than per incident
Agencies were also asked to supply the child’s local authority identifier, so that data could be matched from the DfE return. A supplementary release will explore this data. View the full text of the questions in the 2015 to 2016 survey.
2. Fostering households and carers
On the surface, the fostering picture seems little changed from the previous year, but there is perceptible movement beneath. Overall there were very slightly fewer fostering households as at 31 March 2016 compared to the previous year. The exception to this was family and friends households, which increased leading to an increase in the number of approved places in the LA sector. The provision of short breaks-only households continued to fall. The majority of short-term, short breaks-only, and long-term/permanent placements were offered by LAs while IFAs offered most emergency, parent and child, and multi-dimensional treatment placements.[footnote 1] IFAs were more likely to have larger households than LAs with half of all newly approved LA households being approved for one child only. LAs had more fostering places than last year but fewer of them were filled as at 31 March 2016.
2.1 Fostering households
- there were 44,320 approved fostering households as at 31 March 2016, a small decrease of less than 1% from the previous year (44,625)
- the number of family and friends households, though, rose to 4,665 on 31 March 2016, an increase of 13% (4,145) from 2015[footnote 2]
- as at 31 March 2016 there were 1,850 households who exclusively provided short breaks, a decrease of 8% from 2,000 in 2015
2.2 Types of placements[footnote 3]
- over half of all long-term fostering households (or 18,890) active at 31 March 2016 were providing short-term care as their primary designation and over two fifths (15,025 households) were offering either permanent or long term placements[footnote 4]
- in addition to 1,850 households who exclusively provide short breaks, 390 long-term fostering households were also providing short breaks as a primary placement offer
- two thirds of long-term fostering households offering short term placements as a primary offer (12,555) were in the LA sector. The majority of households offering either long term or permanent placements (8,280 households) were also in the LA sector
- looking at the placement offer in each sector, 47% of all IFA long-term households offered permanent or long term placements in comparison with 38% of LA households
- three quarters of long-term households (415 households) which provided multi-dimensional treatment placements as a primary offer were in the IFA sector
The following sections, unless specified otherwise, include analysis of all fostering households and foster carers excluding family and friends households, temporarily approved connected people households, and short breaks-only carers. The analysis of those three distinctive types of foster care is provided at the end of this chapter.
2.3 Capacity
- in total, the highest proportion of long-term households were approved for two children (14,525 households), followed by 31% of households approved for three or more children (11,475 households) and 29% approved for one child (10,465 households)
- IFAs were more likely to have larger households than LAs: 39% of IFA households were approved for three or more children (5,645 households) compared to 26% of LA households (5,825 households). Both sectors saw a three percentage point increase from last year. (Chart 1)
- of the newly approved households in 2015 to 2016, 25% of IFA households were approved for three or more children in comparison with 15% of LA households. Of LA households approved during 2015 to 2016 50% were approved for one child[footnote 5]
Chart 1: Capacity of long-term fostering households as at 31 March 2016 by sector

Chart 1
2.4 Occupancy[footnote 6]
- in total, there were 83,175 approved fostering places in England as at 31 March 2016, a 3% increase from the same point in the previous year. For LAs the number rose by 5% from 49,080 in 2015 to 51,665 in 2016 and for IFAs it decreased by less than 1% from 31,585 to 31,510[footnote 7]. The rise in number of places in the LA sector could be attributed to the increase in the number of family and friends households
- as at 31 March 2016, 61% of fostering places were filled and 23% were vacant. The remainder were not available[footnote 8]. The percentage of places that were filled decreased from 64% in 2015 to 61% in 2016. The change was similar in both sectors. (Chart 2)
- there were more vacancies in 2016 (19,480), than in the previous two years
Chart 2: Occupancy by sector as at 31 March
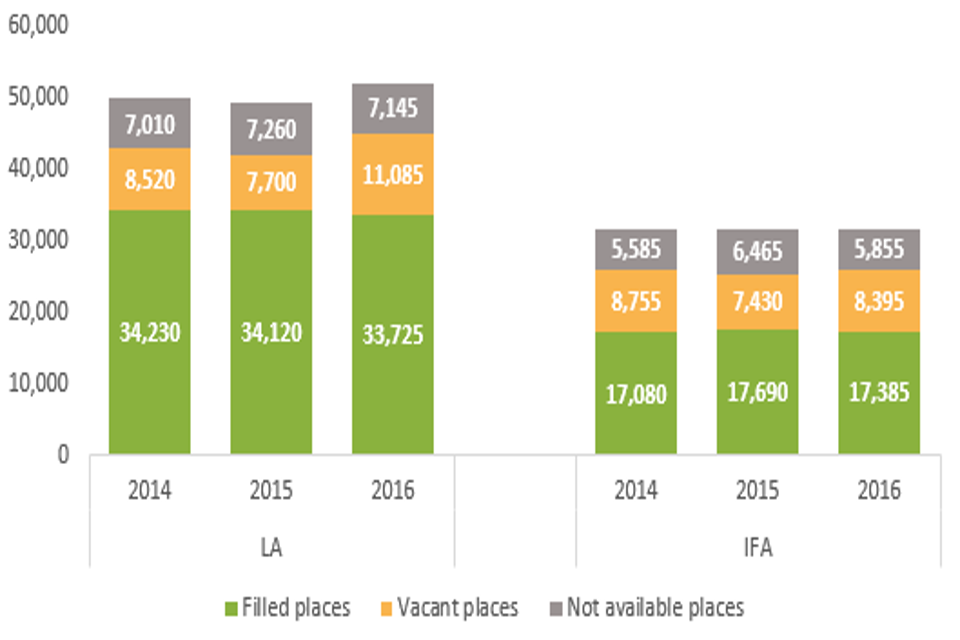
Chart 2
3. Foster carer profile
There was a slight fall in the overall number of foster carers as at 31 March 2016. Most carers were White, but increasing numbers of carers from minority ethnic groups were approved to foster, mostly in the IFA sector. More carers had completed their post-approval training across all household types than in the previous year.
3.1 Approved foster carers
- similar to the previous year, the number of approved foster carers decreased by less than 1% from 62,625 at 31 March 2015 to 62,365 at 31 March 2016
- there were slightly fewer long-term foster carers approved, as well as those who provide short breaks-only family and friends households
3.2 Ethnicity
- most long-term foster carers were White: 84% compared to 85% in the previous year, slightly below the national level among the adult (aged 25 and older) population in the 2011 census (88%)[footnote 9] (Chart 3)
- nine local authorities reported having no long-term foster carers from minority ethnic groups but all reported placing minority ethnic children with their fostering service[footnote 10]
Chart 3: Ethnicity of long-term foster carers by sector, as at 31 March 2016
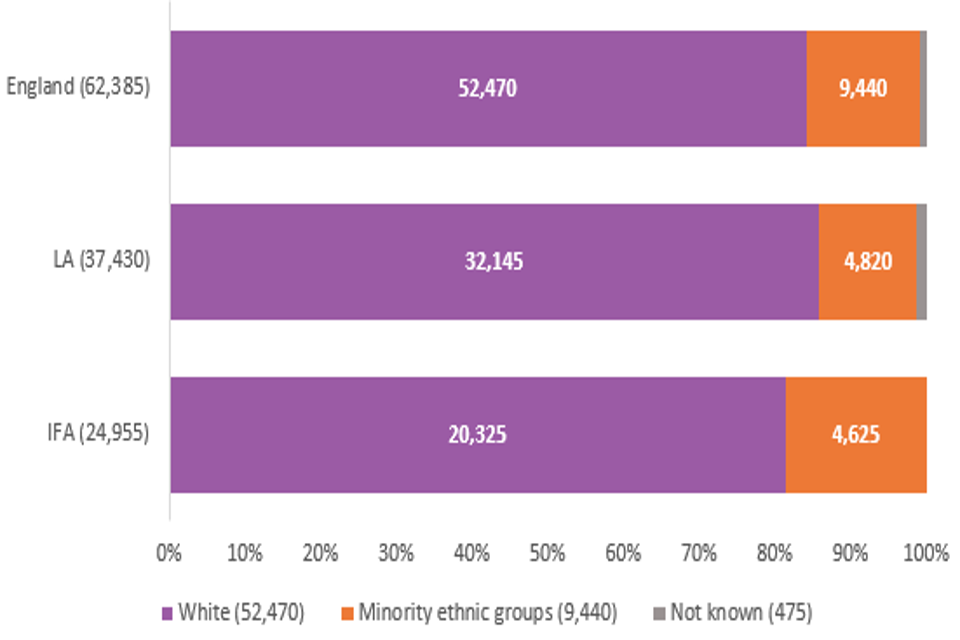
Chart 3
- of those foster carers approved in 2015 to 2016, 83% were White and 15% were from minority ethnic groups[footnote 11]
- in the LA sector, 85% of newly approved carers were White, in comparison with 82% in IFAs
3.3 Post approval training
- there has been an increase in the proportion of foster carers, of all types, who had completed their Training, Support and Development (TSD) workbooks at some point since their approval. The biggest increase was for IFA short breaks carers where 64% were reported to have completed their training as at 31 March 2016, 26 percentage points higher than in the previous year. (Chart 4)
Chart 4: Percentage of approved carers with completed workbooks, 2012 to 2016
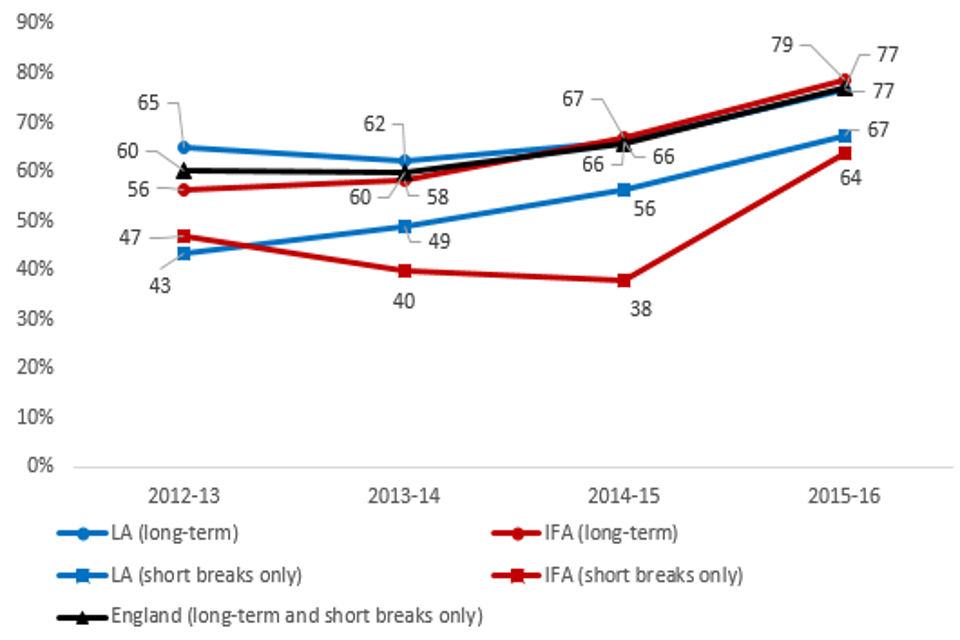
Chart 4
4. Recruitment and retention
There was a small fall in initial enquiries compared to the previous year, continuing a trend over the past few years. There were considerably fewer applications reported than in the previous year: a drop of one third. Fewer applications were considered and completed in the year, but, perhaps as a result, a greater proportion resulted in approval than in the previous years. More fostering households were approved than were de-registered in 2015 to 2016. White applicants whose applications were completed in the year were more likely to get approved than those from minority ethnic groups, and were less likely to withdraw their applications. Fewer fostering households ceased to provide foster care in 2015 to 2016 than in the previous year with vast majority of de-registrations being initiated by foster carers. There were fewer households and fewer carers for short-break provision.
4.1 Overview of recruitment in the year
- the number of initial enquiries continued to fall: there was a decrease of 2% (from 103,355 in 2014-15 to 101,795 in 2015 to 2016). The number of applications fell by one third. The agencies reported 11,460 applications in 2015 to 2016, compared to 16,920 the previous year
- it should be noted, however, that the drop in applications could be partially explained by the fact that almost one quarter of agencies (105) did not submit data about their prospective households. While some agencies might not have recruited any foster carers, 69 agencies (16% of the total) had approved 10% or more of their households during the year which suggests they were actively recruiting in 2015 to 2016. These 69 agencies which did not report any prospective households accounted for around 9% of all approved households, so can only be the partial cause of the substantial fall
- as well as 4,650 long term fostering households approved in 2015 to 2016, agencies also approved 1,810 family and friends households, 1,515 connected people households and 185 short breaks-only households[footnote 12]
- more long-term fostering households were approved than de-registered within 2015 to 2016 leading to a net gain of 295 households.[footnote 13] Family and friends households saw a net gain of 525, while short break households experienced a net loss of 70 households[footnote 14] (Chart 5).
Chart 5: Net change in the number of households in 2015 to 2016
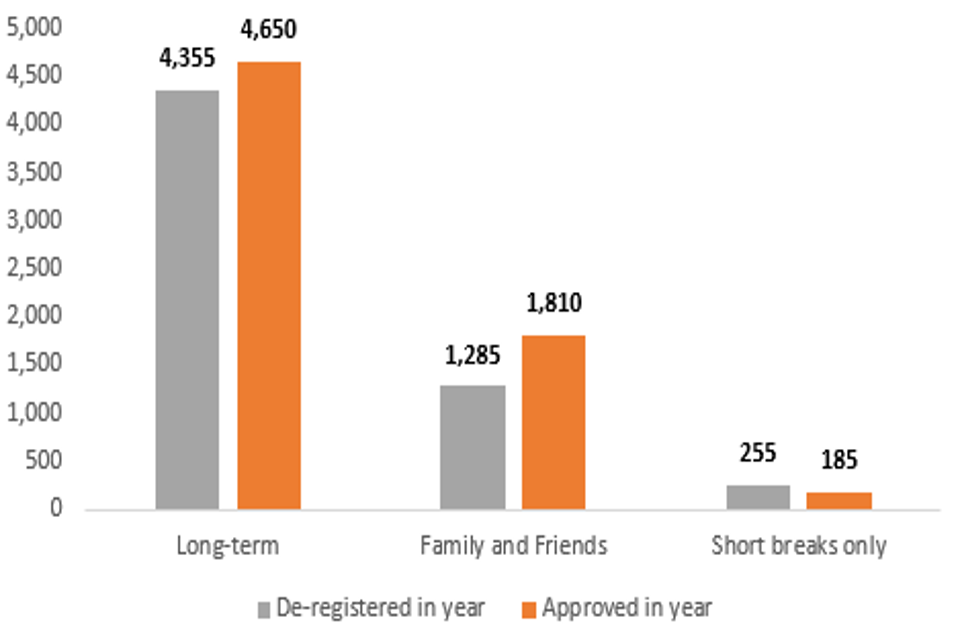
Chart 5
4.2 Application outcomes
- the number of applications that were completed during the year decreased from 12,795 in 2015 to 8,185 in 2016. At 71%, it was the lowest completion rate in the last four years but it could be a result of the overall fall in the number of applications reported this year
- with fewer applications reported to have been considered in year, a higher percentage of completed applications resulted in approval: 57% were approved in 2015 to 2016 in comparison with 44% in 2014-15. This is the highest approval rate for completed applications in the last four years (Chart 6)
- both sectors saw a large increase in approved applications: for LAs, this was an increase from 48% in 2014-15 to 57% in 2015 to 2016, while IFAs increased from 40% to 56%
Chart 6: Applications completed and approved in year
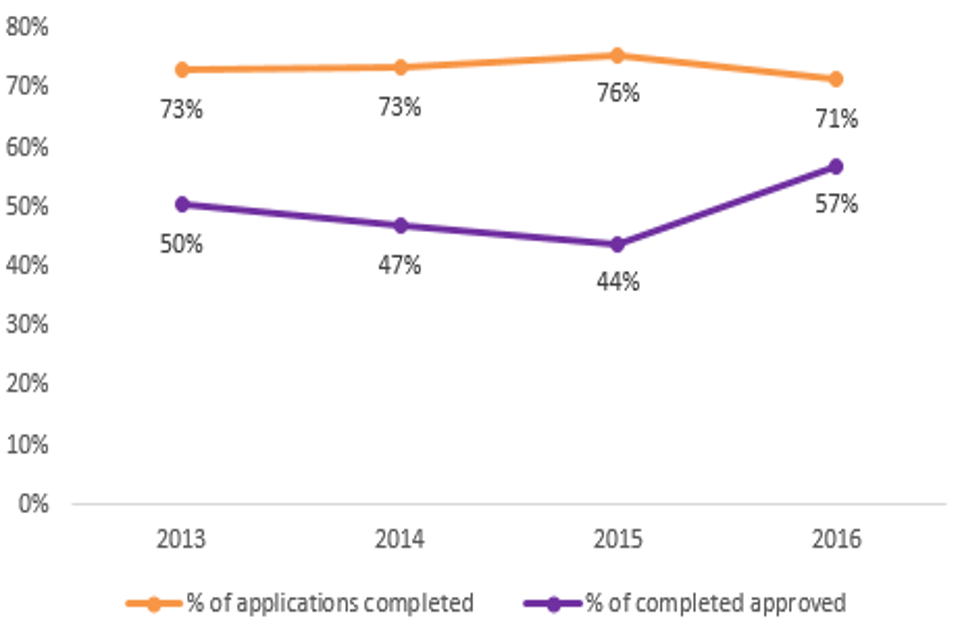
Chart 6
- a smaller percentage of applications completed in 2015 to 2016 were rejected or withdrawn by the service (overall, 13% in comparison with 23% in 2014-15). This was a big change from the last year when a quarter of IFA applicants were rejected or withdrawn by the IFA agencies and almost one fifth by LAs.
- thirty percent of applications (2,485) were withdrawn by applicants, compared to 34% (4,295) the previous year. This fall was mostly accounted for by IFA applications (Chart 7)
Chart 7: Applications considered and completed in year as at 31 March
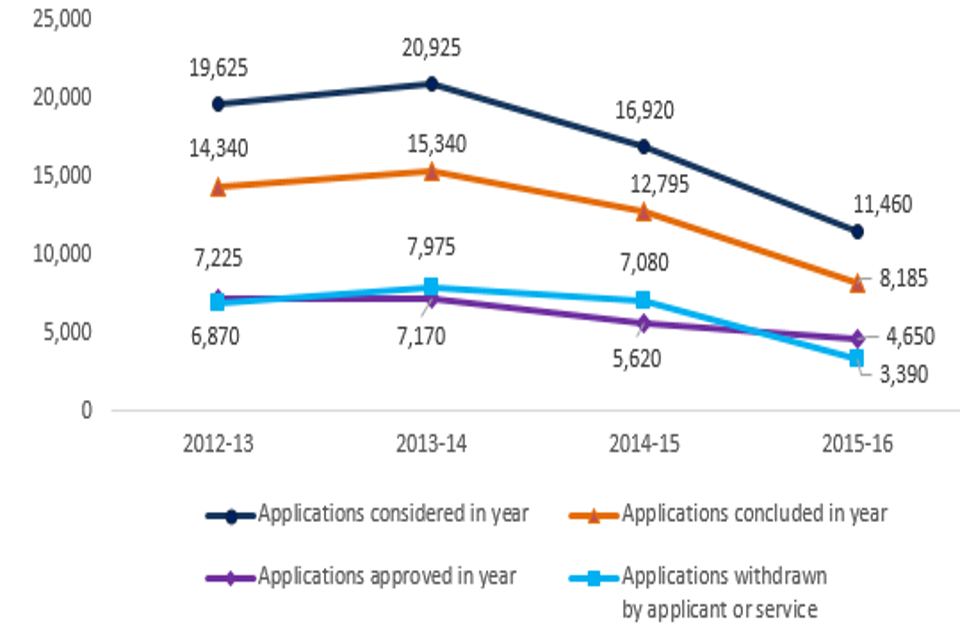
Chart 7
- for White applicants, whose applications were completed during 2015 to 2016, 64% were approved and 10% withdrawn by the service. For minority ethnic applicants, 58% were approved and 13% had their applications withdrawn by the service. Applicants from minority ethnic groups were also more likely to withdraw themselves from the process, 27% in comparison with 25% of White applicants
4.3 De-registration of fostering households
For the first time this year Ofsted collected household level data on de-registrations and the following analysis focuses on the reasons for de-registrations for long-term and short breaks-only households.
- overall, de-registrations decreased by 14% from 2014-15 (5,380) to 2015 to 2016 (4,610)[footnote 15]. This drop could be partially explained by the fact that a number of agencies did not report any de-registrations in 2015 to 2016
- there were 43 agencies (10% of all agencies) which did not report any de-registrations in 2015 to 2016 but reported three or more de-registrations in 2014-15; these accounted for 2,555 of 40,560 (6%) approved long-term households
- there was an equal split between the LA and IFA sector in terms of de-registrations of long-term fostering households in 2015 to 2016. However, within short breaks-only households, 90% of de-registrations were in the LA sector
- the majority of de-registrations (74%) were initiated by the foster carers themselves; for LAs the proportion at 82% remained in line with the previous year (83%)
- slightly more LA households de-registered to transfer to another fostering service (4% in 2015 to 2016 in comparison with 3% in 2014-15). Most of those moving to another service, though, were IFA carers (Chart 8)
Chart 8: De-registrations of long term and short breaks-only households by reason and sector, 2015 to 2016
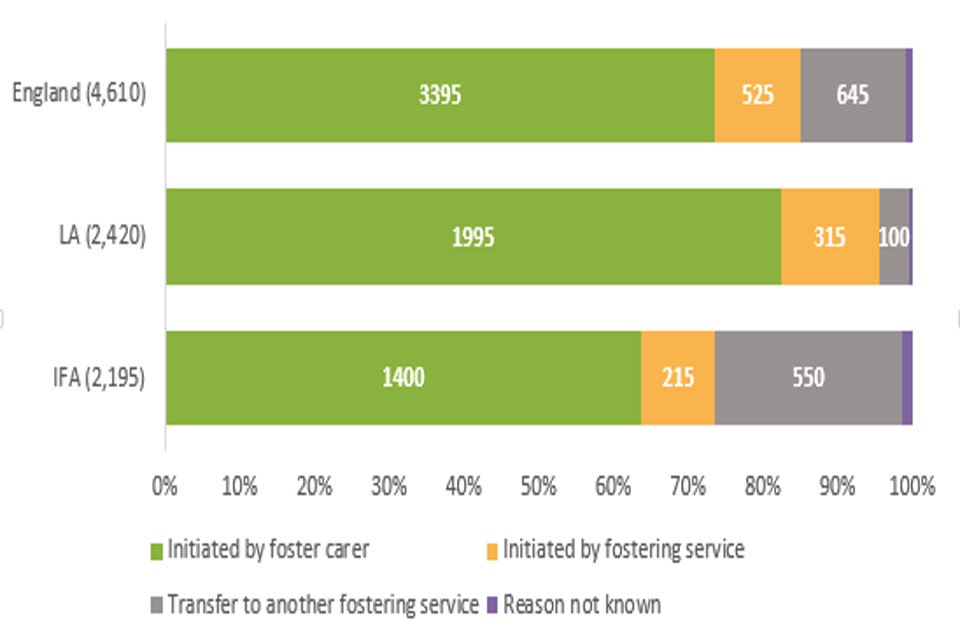
Chart 8
4.4 Retention
- short breaks households were approved for the longest period on average before de-registration (7.7 years), followed by long-term fostering households (5.9 years), and family and friends and connected people households (1.7 years). This is likely due to family and friends and connected people households being approved to look after the specific child they know for a short period of time (Chart 9)
Chart 9: The aggregated period of service before de-registration in 2015 to 2016 by household type
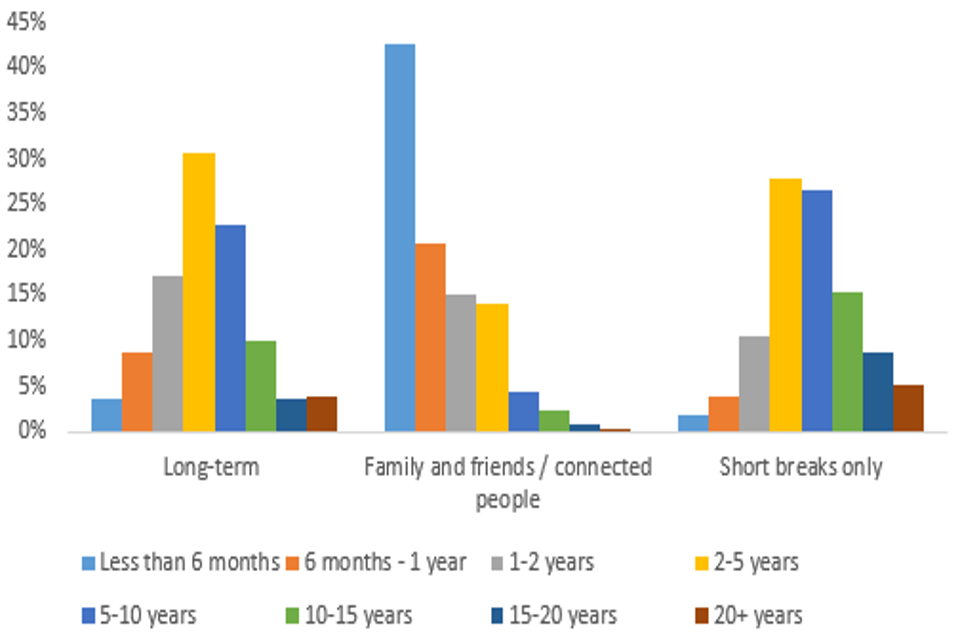
Chart 9
5. Family and friends/temporarily approved connected people
- the agencies reported there were 5,985 family and friends and connected people households as at 31 March 2016, an increase of 4% from 5,735 on 31 March 2015. These households made up 13% of all active fostering households as at 31 March 2016. The increase in the number of family and friends households could possibly be linked to LAs trying to reduce the cost of in house fostering
- family and friends and connected people households were made up of 9,525 foster carers. 85% of carers were White and 10% were from minority ethnic groups
- the agencies reported 3,325 households approved in 2015 to 2016, an increase of 42% on 2014-15 when 2,335 family and friends and connected people households were approved[footnote 16]
6. Short breaks households
- the agencies reported 1,850 households which were approved to provide short breaks only, as at 31 March 2016, a decrease from last year (2,000)[footnote 17]
- the majority of short breaks households (89% or 1,655) were in the LA sector with only 11% (195) in IFAs; a small change from the last year when 13% of short breaks households were registered with IFAs
- the number of short breaks carers decreased from 3,020 in 2015 to 2,795 in 2016. The number of short breaks carers in IFAs continued to decrease from 395 in 2015 to 295 in 2016 and there were fewer short breaks carers working for LA agencies (2,500), a decrease of 5% on the previous year
- LA short breaks-only households made up 6% of all LA households while IFA short breaks-only households constituted only 1% of all IFA households
- of the short breaks-only foster carers 91% were White and 8% were from minority ethnic groups. Of newly approved carers in 2015 to 2016 93% were White and only 5% were from minority ethnic groups
7. Children and young people
As a child in foster care, you were more likely to be placed with a local authority than with an independent fostering agency (IFA). Although the ethnicity breakdown of fostered children is very similar to the breakdown for all children in England, children from minority ethnic groups made up a slightly bigger percentage of fostered children than of all children. In 2015 to 2016, a greater proportion of fostered children were disabled than in any previous year of the collection.
7.1 Number of children fostered[footnote 18]
- in total, agencies reported 51,805 children and young people in placement on 31 March 2016; very similar to 2015[footnote 19],[footnote 20]
- two thirds of these were in LA fostering places (34,395), and the remainder (17,410) were placed through independent fostering agencies, in line with 2015
7.2 Characteristics of children
Ethnicity
- around 77% of fostered children were White, with 22% of children belonging to minority ethnic groups; again, this was in line with 2015
- children from minority ethnic groups were therefore slightly under-represented compared to the DfE’s figures for all children looked after (24% of whom are from minority ethnic groups), and very slightly over-represented compared to the national figures (according to the 2011 census, 21% of children in England are from minority ethnic groups)[footnote 21],[footnote 22],[footnote 23]
Disability
- just under 10% of children were reported to be disabled (4,855 children). Although this was a small (3 percentage points) increase from 7% in the previous year, it was the largest increase since the collection started[footnote 24]
- IFAs reported slightly higher percentages of children with disabilities (11% or 1,890) compared to 9% (2,960) for LAs
7.3 Children’s experiences
Children’s experiences include education, unplanned endings, Staying Put, and physical restraint. As a child, you were more likely than not to Stay Put with your former foster carers after turning 18. Children were also more likely to experience physical restraint if they were placed with an IFA than an LA; but this might be partially because children with higher needs are more likely to be placed with IFAs.
Placement stability[footnote 25]
- in total, 2,910 children experienced unplanned endings and stayed with the same agency[footnote 26]. The majority of these children (75% or 2,175 children) were placed with LA fostering agencies at the time of the unplanned ending. These figures, however, may be partly explained by the change in the method of data collection this year. Children experiencing unplanned endings while placed with LA carers are more likely to be placed with another LA carer in the same agency; children placed with IFA carers, however, may be more likely to be moved by their LA either to in-house carers, or to a different IFA
- in total, these 2,910 children experienced 3,490 unplanned endings. The majority of children (86% or 2,495) experienced a single unplanned ending, though there were a small number of children (15) who experienced five or more unplanned endings
- overall, children were slightly more likely to experience an unplanned ending at the foster carers’ request (55% or 1,610) than for other reasons[footnote 27], [footnote 28]
- a higher percentage of White children with unplanned endings experienced these at the foster carers’ request: 57%, compared to 49% of children from minority ethnicities with unplanned endings[footnote 29]
- around 20% of children (590) experienced at least one move within 24 hours of the decision to end the placement early.
- white children were slightly less likely than children from minority ethnic groups to move within 24 hours of the unplanned ending: 19% (435 of 2,230) compared to 23% (155 of 660)
Education[footnote 30]
- a total of 2,295 children experienced at least one educational placement change as a result of a fostering placement change during 2015 to 2016. Children in IFA placements made up a higher percentage of children experiencing an educational placement change (47%) than they did of all children (34% of fostered children were in IFA placements). Although detailed reasons for changes of educational placement are not collected, the higher percentage for IFAs may be because children are more likely, due to their level of need that the IFA placement meets, to be placed further away to find an IFA placement, and therefore outside of their original educational area[footnote 31]. Consequently, they are more likely to change educational placement should the IFA placement end (Chart 10)
Chart 10: Percentage of children placed, compared to percentage experiencing an educational placement change, by sector as at 31 March 2016
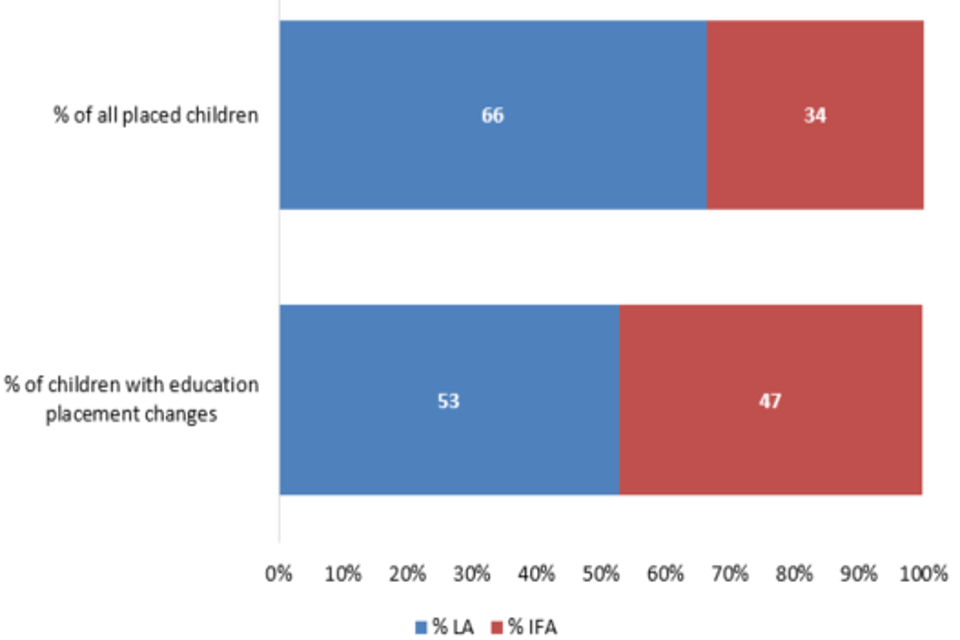
Chart 10
- a higher percentage of children who had an unplanned ending also had a change of educational placement (12%) compared to children with no unplanned endings who had a change of educational placements (4%)
Staying put[footnote 32]
- a total of 4,025 young people in foster placements became 18 during the year 2015 to 2016 (a 17% increase from 3,435 the previous year)
- of these 4,025 care leavers, 54% (2,190) were still living with their former foster carers in 2015 to 2016, an increase from 2014-15 of 22% (1,790). This is in line with the findings of the Association of Directors of Children’s Services (ADCS) Safeguarding Pressures research project, and the percentage is also in line with the DfE SSDA903 returns[footnote 33], [footnote 34]
- the percentage of young people who “Stayed Put” with IFA carers rose by five percentage points from the previous year. This took it closer to the LA percentage, and to the 2013-14 level of 54%, so 2014-15 may have been an isolated dip (Chart 11)
Chart 11: Percentage of care leavers who remained with former foster carers after becoming 18, by sector, 2014 to 2016
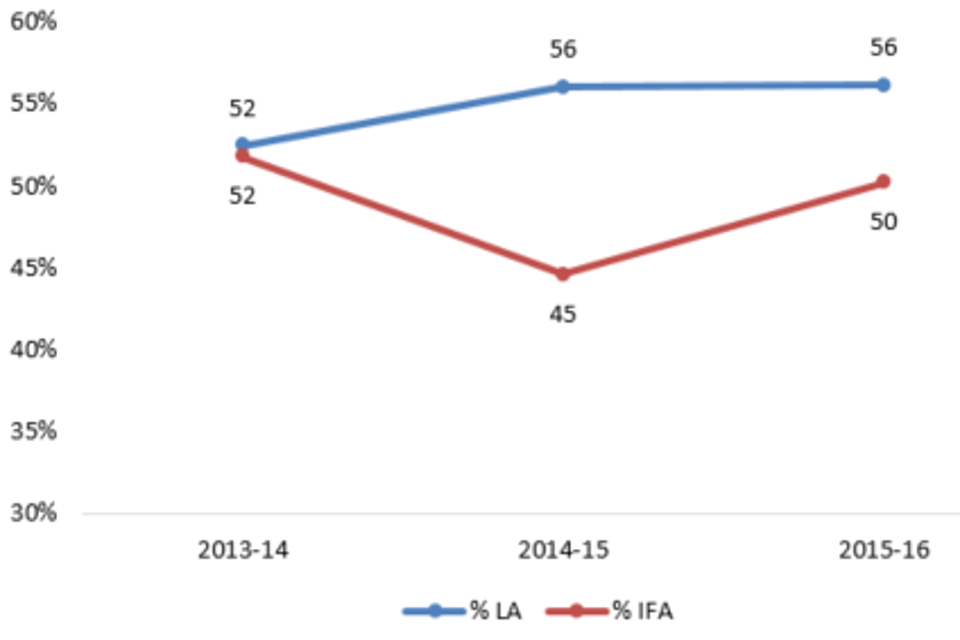
Chart 11
Restraint
- in 2015 to 2016, there were 1,040 incidents of physical restraint, in line with the previous year. These affected 580 children and young people, which equated to an average of 1.8 incidents per child who experienced restraint.
- the number of children experiencing restraint once again diverged between the two sectors, as happened in each year except 2014-15: the number in LA foster care dropped by 13% from 155 to 135 children, while in IFAs it rose by 7% from 415 to 445. The preponderance of IFA placed children experiencing restraint may, again, be a result of the level and particular nature of the child’s need being met by those IFAs
8. Safeguarding
Safeguarding includes child sexual exploitation, going missing, and allegations of misconduct. In a lot of ways, safeguarding had not changed from 2015: children were no more likely in 2016 than in 2015 to be at risk of or subject to child sexual exploitation; and children still most commonly went missing due to contact (or avoiding contact) with family and friends. There were also some changes, including IFA investigations into allegations being quicker than those by LAs, and more likely to result in no further action. For the first time, we also know about Return Home Interviews (RHI): children were more likely than not to have at least one RHI if they went missing.
8.1 Child sexual exploitation
- In 2015 to 2016, there were 1,725 (3%) children and young people in foster care considered to be at risk of child sexual exploitation and 500 (1%) considered to be subject to child sexual exploitation, both in line with 2014-15
- There was a slight increase in the percentage of children placed through IFAs at risk of child sexual exploitation (from 4% to 5%). The percentage for LAs remained stable at around 3%
- At a regional level, the percentage of children at risk of child sexual exploitation varied from 6% in the South West to 1% in the West Midlands. The ADCS Safeguarding Pressures research also indicates that some of the areas with highest numbers of children at risk were coastal towns[footnote 35] (Map 1 in underlying data tables)
- Ten local authorities reported that, of the children placed with their own approved foster carers on 31 March 2016, none were known to be either at risk of or subject to child sexual exploitation[footnote 36].
8.2 Children going missing
- in 2015 to 2016, a total of 3,055 children (6% of all fostered children) went missing, a total of 10,640 times, which equated to an average of 3.5 missing incidents per missing child[footnote 37]
- the percentage of children going missing across England has not changed from 2014-15, while the percentage in LA placements has increased from 4% to 5%. The percentage of children going missing from IFA placements has dropped from 10% to 7%, though this may be an isolated dip, or a result of the change in data collection
- black and Black British children were slightly over-represented in missing figures compared to all fostered children: 7% of fostered children were Black/Black British, but accounted for 10% of all missing children
- just over 50% of all missing children went missing primarily due to contact, including avoiding contact, with family and friends (1,610, 53%)[footnote 38] (Chart 12)
Chart 12: Number of children missing by primary reason, by sector, 2016
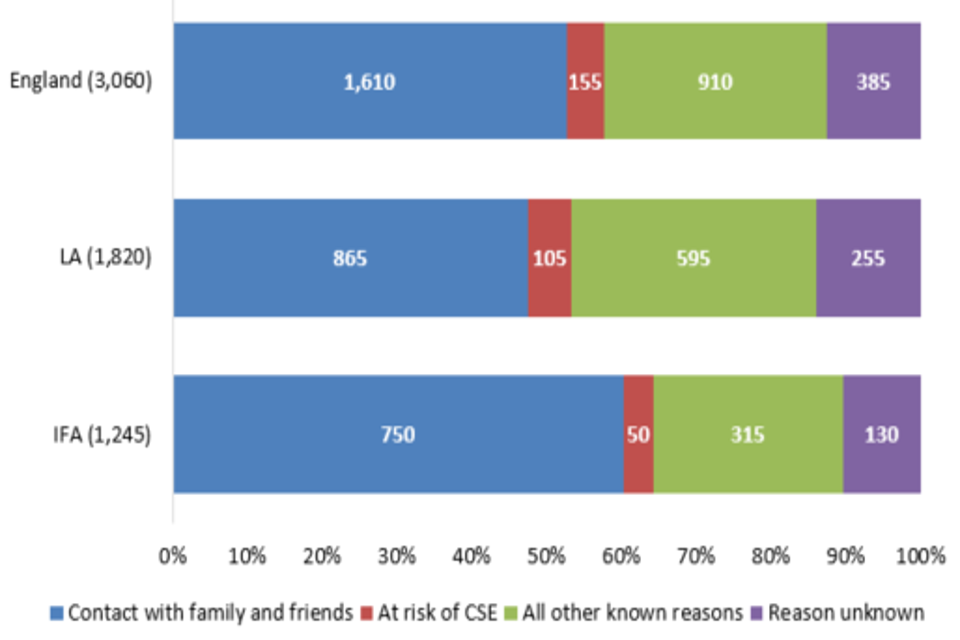
Chart 12
- The majority of those missing (85% or 2,605) were missing for less than one week. The DfE also reported the majority of all missing Children Looked After being missing for less than a week, though their percentage was higher at 97% (41,650 of 43,000 children)[footnote 39]
- IFAs had a higher percentage of children missing for a total period of less than 24 hours, compared to LAs (Chart 13).
Chart 13: Children missing by total duration, by sector, 2016
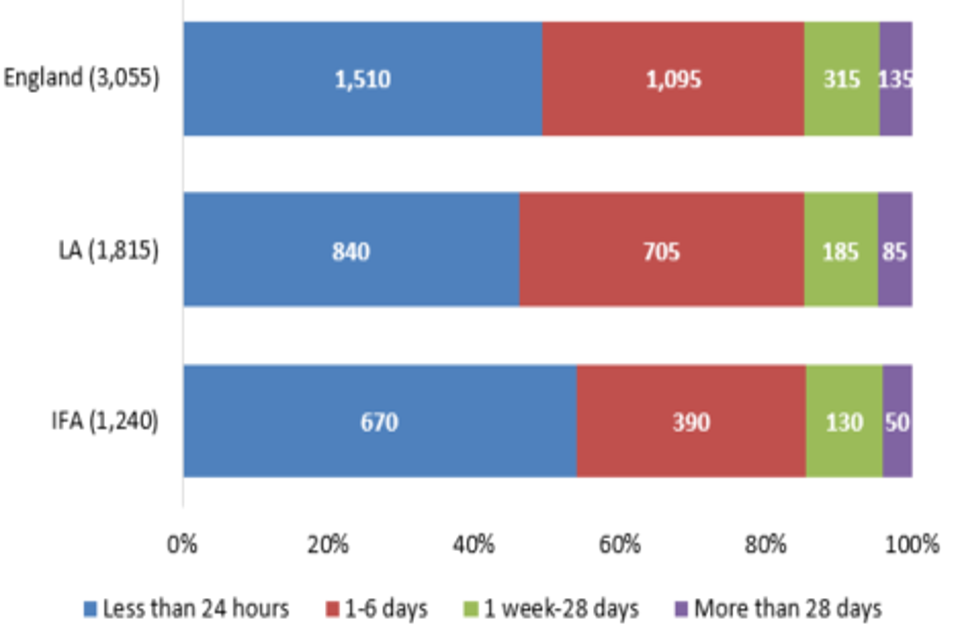
Chart 13
- a total of 4,135 RHI took place, covering around 40% of missing incidents[footnote 40]
- These RHI were conducted for 1,650 children who went missing, around 55% of the 3,055 total missing children. Those children who had an RHI had an average of 2.5 per child
- children fostered through LAs were more likely to have at least one RHI (61%, compared to 43% of children fostered through IFAs)
- Ofsted also coordinates a survey of children in foster care every year, which includes a question about children who go missing having a chance to talk to someone independent on their return. Although the percentage of children who said they did get a chance was higher (66%) than those who did not, only 170 children responded to the question. The percentage of children in children’s homes was higher, at 81% (of 454 children)[footnote 41]
- there were eight LAs which reported that no children in placement with the LAs’ approved foster carers on 31 March 2016 received return home interviews[footnote 42]
- children who went missing due to being asylum seekers were least likely to have an RHI (25 of 35), followed by children with a reported reason for going missing of “unknown” (61% or 235). Children missing due to substance misuse were most likely to have an RHI (only 18% of this group had no RHI, 10 of 55 children)[footnote 43]
8.3 Missing and child sexual exploitation – links to children’s experiences
With data available at child level for the first time, it is possible to do some analysis relating to the links between children going missing and/or being at risk of child sexual exploitation and other factors in their lives.
- not all children at risk of sexual exploitation went missing during the year. Some, though, having gone missing in the previous year, will have been identified as being as risk because they went missing
- a higher percentage of children at risk of child sexual exploitation went missing, than of children not at risk of child sexual exploitation: 40% of children at risk of child sexual exploitation had at least one missing incident, compared to 5% of children not at risk. The link between missing and child sexual exploitation risk was also highlighted in the recent Her Majesty’s Inspectorate of Constabulary (HMIC) investigation of the Metropolitan Police Service, whose missing policy includes classifying all children at risk of child sexual exploitation as missing (rather than absent) if they are away from home, resulting in a police investigation to find the child[footnote 44]
- there was also a higher percentage of children at risk of child sexual exploitation going missing for reasons related to their child sexual exploitation risk, with 15% of children at risk of child sexual exploitation going missing for this reason, compared at 2% of children not at risk
- a lower percentage of children at risk of child sexual exploitation than of those not at risk went missing for unknown reasons (9% compared to 14%), possibly because they were already at higher risk, so might be more likely to receive more attention on their return
- there was also a higher percentage of children at risk of child sexual exploitation who also went missing who had at least one RHI, compared to children not at risk of child sexual exploitation who went missing. However, when looking at children at risk of child sexual exploitation who also went missing, by their primary reason for going missing, children who went missing because of their risk of child sexual exploitation had the lowest percentage of missing incidents with an RHI: 37% of these incidents had an RHI, compared to 44% when looking at all missing incidents (Chart 14)
Chart 14: Missing children and Return Home Interviews, compared by child sexual exploitation risk, 2016
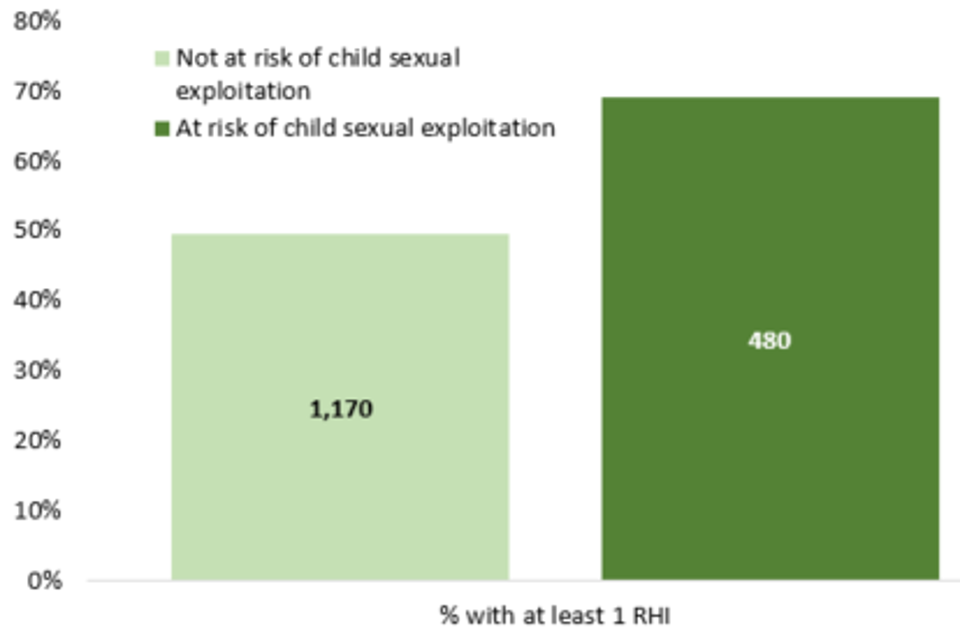
Chart 14
- a higher percentage of children at risk of child sexual exploitation, and of children who went missing, had unplanned endings, compared to children who either were not at risk of child sexual exploitation or did not go missing (Chart 15)
Chart 15: Unplanned endings, compared by child sexual exploitation risk, and by missing, 2016
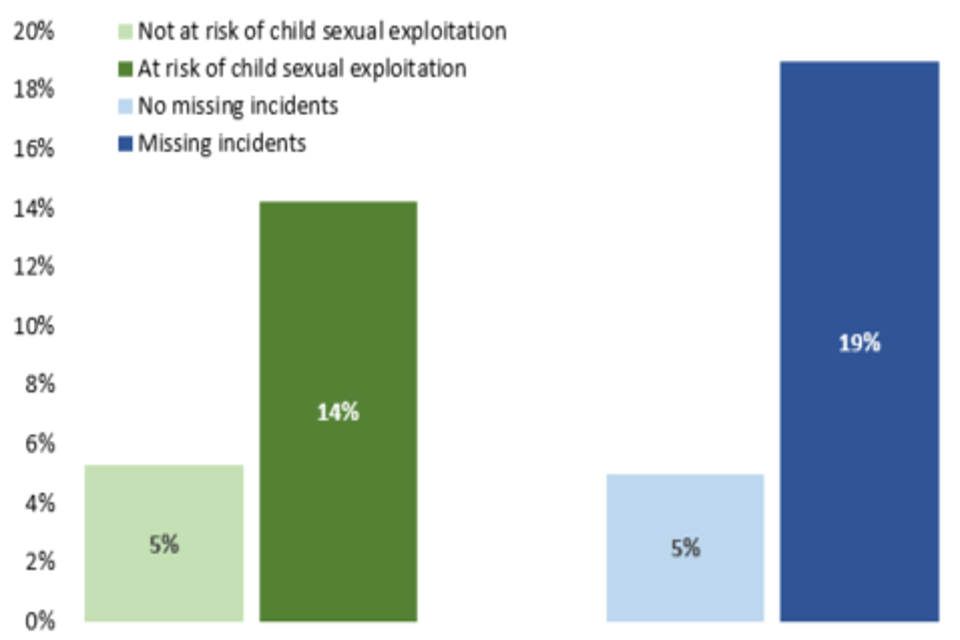
Chart 15
- for children who either went missing or were at risk of child sexual exploitation, a slightly higher percentage of their unplanned endings were at the foster carers’ request (60% of children who went missing and of those who were at risk of child sexual exploitation, compared to around 55% of children who did not go missing or have a risk of child sexual exploitation)
- a higher percentage of children in these two groups also had educational placement changes, compared to children not in one of these two groups (Chart 16)
Chart 16: Education placement changes, compared by child sexual exploitation risk, and by missing, 2016
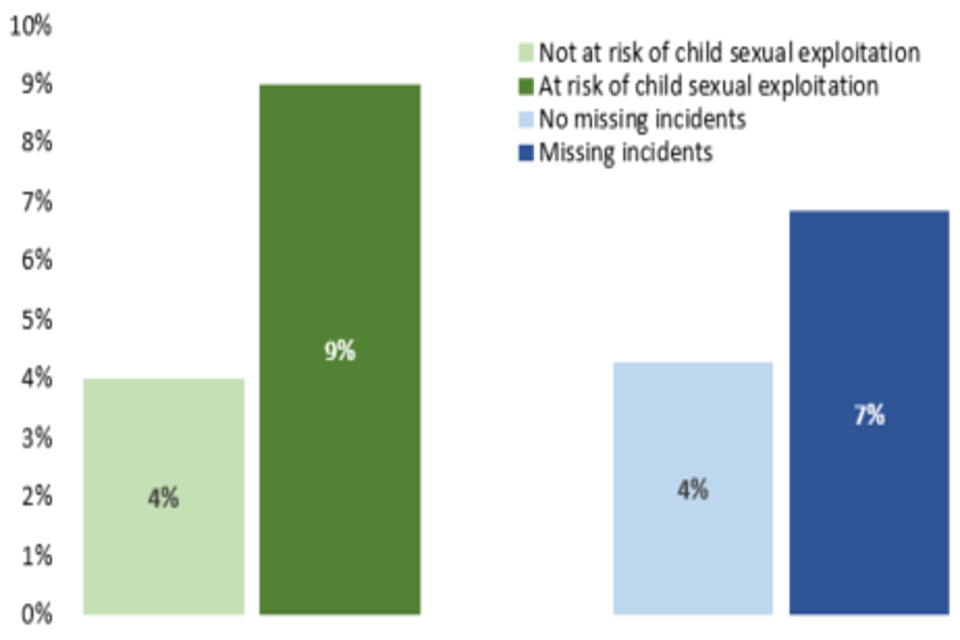
Chart 16
8.4 Allegations of abuse[footnote 45]
- during 2015 to 2016, there were 2,450 allegations made against foster carers. Just under two thirds of these (63% or 1,550) were made by fostered children
- Although the total number of allegations increased by 1% (from 2,420 to 2,450) from 2014-15, these came from a smaller number of children: the number from children decreased by 5% (from 1,640 to 1,550)
- the number of allegations from other sources increased by 15% (from 785 to 900). Most of this was accounted for by LAs, where the number increased by 19% (from 560 to 665)
- allegations against IFA foster carers were more likely to come from fostered children (75%) than in LAs, where the gap between allegations by fostered children (56%) and other sources (44%) was much smaller
- over half of all allegations were related to physical abuse, with allegations of sexual abuse being least common, much the same as in 2014-15
- however, there has been a shift in outcomes from 2014-15 to 2015 to 2016, with allegations being more likely this year (20%) than last (17%) to result in continued monitoring
- continued monitoring was also more common for LAs (23% of allegations), than for IFAs (15%)
- as well as allegations against LA foster carers being more likely to result in continued monitoring, they also took longer to conduct the investigations
- just under 50% of all LA investigations took less than 21 working days (47%) compared to over 50% of those conducted by IFAs (59%) (Chart 17)
Chart 17: Timescale for investigations of allegations by sector, 2016
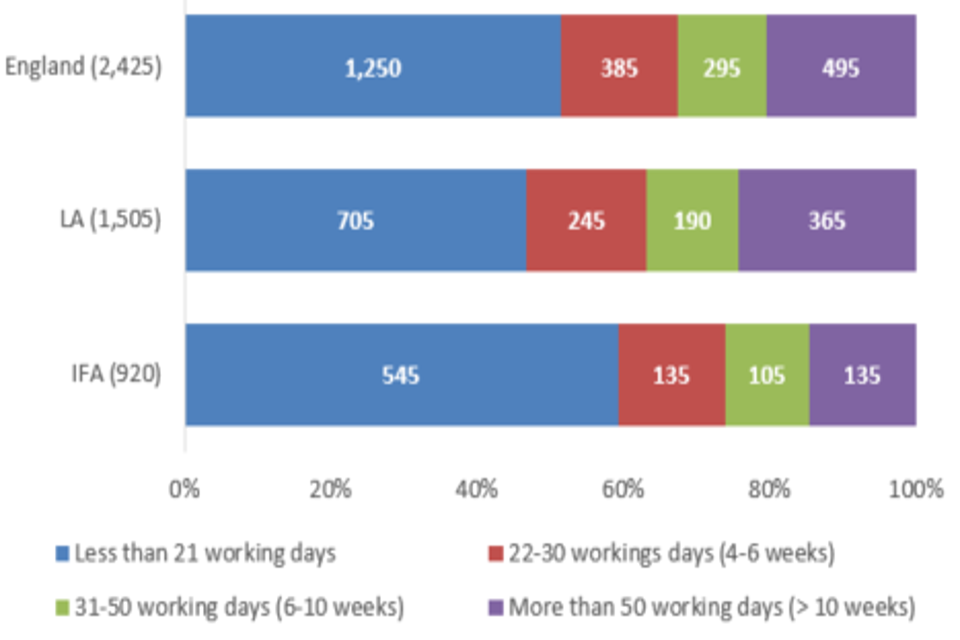
Chart 17
9. Revisions to previous release
This is the first release of this data for the period 1 April 2015 – 31 March 2016. This data is fixed point in time data and will not be revised.
10. Notes
The aggregated data at England, total LA, and total IFA levels, and at individual LA and regional total levels, is available in Excel format on the Ofsted website www.gov.uk/government/collections/childrens-social-care-statistics under the heading ‘Fostering in England’. An explanation about key uses of this data and further contextual information and the arrangements for quality assurance is provided in the accompanying Quality and Methodology report. The Quality and Methodology report can be found at the following webpage: www.gov.uk/government/collections/childrens-social-care-statistics under the heading ‘Fostering in England’. The report also provides information about strengths and limitations of the statistics.
11. Glossary
A full definition of the terms below is available within the Dataset Excel file, available here: www.gov.uk/government/statistics/fostering-in-england-1-april-2015-to-31-march-2016.
If you have any comments or feedback on this publication, please contact Adam King on 03000 130020 or socialcaredata@ofsted.gov.uk
-
The numbers of households offering long term placements and those offering permanent placements were combined together as those two types of placements are very similar on a practical level. However, it should be noted that slightly more IFA households indicated long term fostering as a primary offer, than LA households. ↩
-
Another sub-group is temporarily approved “connected people” households; households approved to provide foster care for particular children that they know, but approved for a very short time. The number of this group decreased from 1,590 in 2015 to 1,320 in 2016. IFAs do not generally approve family and friends/ connected people households, however IFAs have reported having 20 households of these categories. ↩
-
Ofsted introduced changes to the fostering dataset collection in 2015 to 2016, so that data was collected at fostering household instead of fostering agency level, including a primary and any additional placement offers. As a result, data is not comparable in this item to previous years. Unless otherwise indicated, only primary placement offer has been used for this analysis. ↩
-
This analysis only looks at long-term fostering households; family and friends, connected people, and short break-only households were excluded as these are single choice placements. ↩
-
For 165 households approved in 2015 to 2016 the agencies did not provide the data on maximum number of children the fostering households were approved to care for. ↩
-
The 2015 to 2016 fostering dataset collection asked for data on all fostering households registered with the agency during 2015 to 2016 and the number of children placed in each household on 31 March 2016. This analysis includes all household types apart from short breaks only to make it comparable with last year’s figures. ↩
-
The fostering agencies did not provide data for 21 households on the maximum number of children that may be accommodated in these households, however they provided data on the number of filled and vacant places for 14 of these 21 households. Also a number of households had exemptions in place which allowed them to accommodate more children than they were approved for. As a result a slightly larger number of places were reported as filled, vacant or unavailable (83,590) than the number of approved places (83,175). ↩
-
Not available places included those occupied by care leavers under “Staying Put” arrangements and those only available for siblings. Places were also unavailable for reasons relating to foster carers (for example, on hold due to personal and medical reasons) or the needs of children already in placement, for example, a requirement for solo placements. ↩
-
Office for National Statistics (ONS) 2011 census, www.nomisweb.co.uk/census/2011/DC2101EW/view/2092957699?rows=c_age&cols=c_ethpuk11 ↩
-
Knowsley, North East Lincolnshire, North Somerset, Redcar and Cleveland, Rutland, Sefton, Shropshire, St Helens, West Berkshire. Knowsley reported 13% of carers with ethnicity marked as ‘unknown’. However, it should be noted that the proportion of minority ethnic residents in the adult (aged 25 and older) population in those LAs does not exceed 5%. ↩
-
2% of new carers were reported, in majority by LA agencies, with ethnicity marked as ‘unknown’. ↩
-
Ofsted did not collect recruitment data for family and friends and connect people households, because they do not go through the two stage recruitment process, so these types of households were not included in application outcomes analysis. ↩
-
Although there was a net gain of 295 households in 2015 to 2016, there were 305 fewer long-term fostering households reported at 31 March 2016 than at the same time last year. The reason for this difference can be accounted for by the change in the cohort of the agencies completing the survey this year: a number of agencies de-registered during the year therefore they did not complete the data collection; the other reasons are changes in the household types (for example long-term households becoming short breaks only) as well as inconsistencies in data recording. ↩
-
Temporary approved connected people households were excluded from this analysis as they only provide temporary fostering for up to 16 weeks to a specific child. ↩
-
The agencies reported the reasons for de-registration for 99% of those households (45 de-registrations were reported without the reason). Family and friends and connected people households were excluded from this analysis as these types of households are approved to care for a specific child(ren) and usually for a short period of time (under 16 weeks for connected people households) so including them in the analysis is likely to skew the data. ↩
-
Ofsted did not collect recruitment data for family and friends or temporarily approved fostering households as the approval process is different than for long-term foster carers, therefore it is not known how many of these two types of households withdrew or were rejected in the process. ↩
-
Although there was a net loss of 70 short breaks households in 2015 to 2016, the difference between the numbers of households at 31 March this year and the last year is greater as the cohort of agencies has changed. A number of fostering agencies de-registered and registered in year which could have impacted on number of short break households reported this year. ↩
-
The 2015 to 2016 fostering dataset collection asked for data on all children still in placement on 31 March 2016, looking back at the 12 months before this date (or whatever portion of the year the child was in placement with the agency). This was a change from previous years, when data was collected about all children in placement at any point during the year, and so the numbers are not comparable between years. However, where possible, we have compared percentages as an indication of how the current data compares to previous years. As the quality report explains in more detail, we are aware that some agencies have likely provided information about children who were in placements during the year but left the agency before 31 March. As we are unable to distinguish between the two groups, we have included all children for the purposes of this report, unless stated otherwise. ↩
-
The DfE reported that there were 70,440 children looked after in total as at 31 March 2016; 74% (51,850) were fostered. Of the remainder: 11% (7,600) were in secure units, children’s homes or hostels; 5% (3,810) were placed with parents; 4% (3,040) were in other community placements; 4% (2,940) were placed for adoption; and 3% were in residential schools, other residential settings, or other placements not specified. (Children looked after in England (including adoption) year ending 31 March 2016 Table A2, available here: www.gov.uk\government\statistics\children-looked-after-in-england-including-adoption-2015-to-2016)) ↩
-
The DfE reported a slightly higher figure for both years: 51,850 in 2016, and 51,590 in 2015. Source: Children looked after in England (including adoption) year ending 31 March 2016 Table A2, available here: www.gov.uk\government\statistics\children-looked-after-in-england-including-adoption-2015-to-2016 ↩
-
Please see www.ons.gov.uk/peoplepopulationandcommunity/culturalidentity/ethnicity/adhocs/005378ct05702011censussexbyagebyimd2004byethnicgroup for the full 2011 census data breakdown. ↩
-
Children looked after in England (including adoption) year ending 31 March 2016 Table A1, available here: www.gov.uk\government\statistics\children-looked-after-in-england-including-adoption-2015-to-2016 ↩
-
The difference between fostered children and all children looked after maybe be partially explained by the over-representation of children from minority ethnic groups in other types of looked after placement, including secure units, young offender institutes and prison; and independent living. Child looked after placements as at 31 March 2015, Ofsted: [www.gov.uk/government/statistics/children-looked-after-placements-as-at-31-march-2015](https://www.gov.uk/government/statistics/children-looked-after-placements-as-at-31-march-2015] ↩
-
This was also higher than the 7% for all children reported in the 2014-15 Family Resources Survey, published June 2016, available here: www.gov.uk/government/statistics/family-resources-survey-financial-year-201415. This is the most up-to-date data on disabled children in England available at the time of publication. ↩
-
Data on unplanned endings is not comparable to previous years, as this year’s data was collected at child and incident level, while in previous years it was only collected at incident level. ↩
-
Because data is collected only on children still in placement with the agency as at 31 March 2016, unplanned endings are only counted here if the child remains placed with the same agency e.g. they move from one fostering household to another, both approved by the same agency. Unplanned endings where a child changed agency as a result (for example, moving from an IFA fostering household to an LA fostering household) were not counted. ↩
-
A total of 1,455 children (50%) experienced unplanned endings for other reasons; because some children experience unplanned endings for more than one reasons, the total percentage does not equal 100%. When looking at incidents, 53% (1,860) were at the foster carers’ request, and 47% (1,630) for other reasons. ↩
-
Agencies are asked to report the number of unplanned endings at the foster carers’ request (which could include an issue in the carers’ life such as a death, as well as because the carer no longer feels the placement is the best fit for the child); and the number for other reasons (which is a catch-all for anything else and might include a change in the child’s circumstances, or a decision by the social worker, for example) ↩
-
Percentages will not always total 100%, as some children experience unplanned endings at both the foster carers’ request and for other reasons, and so are counted in both groups. ↩
-
In 2015 to 2016, only data on children with an educational placement change was collected. ↩
-
When comparing the number of educational placement changes by sector, the two have moved progressively closer over the last three years, and in 2015 to 2016, 53% (1,210) of educational placement changes were for children placed with LAs, compared to 47% (1,080) for children placed with IFAs. ↩
-
Please refer to the glossary for a full definition of the Staying Put scheme. ↩
-
www.adcs.org.uk/safeguarding/article/safeguarding-pressures-phase-5 Safeguarding Pressures Phase 5 – Report p. 62 ↩
-
However, the DfE reported a substantially different number of both young people becoming 18 (2,670) and as a result staying with their former foster carers (1,440); the reasons for this difference are not clear. Children looked after in England (including adoption) year ending 31 March 2016 Table F1d, available here: www.gov.uk/government/statistics/children-looked-after-in-england-including-adoption-2015-to-2016 ↩
-
Safeguarding Pressures report p.65; www.adcs.org.uk/safeguarding/article/safeguarding-pressures-phase-5 ↩
-
The 10 local authorities were: Enfield, Kingston upon Thames, Lancashire, Middlesbrough, Nottingham, Peterborough, Rutland, Torbay, Wandsworth, and Westminster. An additional seven LAs reported children subject to child sexual exploitation but none at risk: Derby, Greenwich, Hillingdon, Shropshire, Staffordshire, Telford and Wrekin, and Windsor and Maidenhead. ↩
-
This was slightly lower than the 9% for all looked after children reported by the DfE; however, their figure is likely to be impacted by including all types of placements. DfE data on children missing from foster placements is not available. The DfE also reported a higher average number of incidents per missing child (5.0). Children looked after in England (including adoption) year ending 31 March 2016 Table G1, available here: www.gov.uk\government\statistics\children-looked-after-in-england-including-adoption-2015-to-2016 ↩
-
The fostering form includes the following options for recording the primary reason a child went missing: Bullying; involvement in offending behaviour; substance misuse; contact with, including avoiding contact with, family and friends; alleged abuse within the foster home; they are an asylum seeker; suspected to be at risk of child sexual exploitation; any other known reason; reason unknown. Reasons marked with * are included in “All other known reasons” in Chart 3. ↩
-
Children looked after in England (including adoption) year ending 31 March 2016 Table G1, available here: www.gov.uk/government/statistics/children-looked-after-in-england-including-adoption-2015-to-2016 ↩
-
For the first time this year, Ofsted collected data on how many return home interviews (RHI) were conducted. ↩
-
www.gov.uk/government/publications/social-care-questionnaires-2016-what-children-and-young-people-told-ofsted ↩
-
These eight LAs were: Barnet, Buckinghamshire, Croydon, Hackney, Kingston upon Thames, Lewisham, Walsall, and Wokingham. In total, these LAs had 100 children reported missing at least once over the year, with Croydon reporting the highest number (55). ↩
-
Ofsted does not collect data on whether children were still missing at the time of the collection; this may account for some children who did not receive RHI, or whose reason for going missing was unknown, where this will change once they return to their foster carers. ↩
-
www.justiceinspectorates.gov.uk/hmic/publications/metropolitan-police-service-national-child-protection-inspection/ ↩
-
Data on complaints received, including source and whether they were upheld, is available in the underlying data tables. ↩