Forthcoming change: a new series for the price of charging an electric vehicle
Updated 5 November 2026

© Crown copyright 2026
This publication is licensed under the terms of the Open Government Licence v3.0 except where otherwise stated. To view this licence, visit nationalarchives.gov.uk/doc/open-government-licence/version/3 or write to the Information Policy Team, The National Archives, Kew, London TW9 4DU, or email: psi@nationalarchives.gov.uk.
Where we have identified any third party copyright information you will need to obtain permission from the copyright holders concerned.
This publication is available at https://www.gov.uk/government/publications/forthcoming-changes-and-previous-versions-of-tag/forthcoming-change-a-new-series-for-the-price-of-charging-an-electric-vehicle
Description: a new series for the price of charging electric vehicles
Unit: TAG data book (table A1.3.7)
Change announced: November 2026
Expected release date: December 2026
Description
In the transport analysis guidance (TAG) data book, we’re replacing the existing series used to proxy the price of charging an electric vehicle (EV) with 3 new series for cars, light goods vehicles (LGVs) and other goods vehicles (OGVs), better capturing the characteristics of the EV charging market.
Detail
TAG unit A1.3 (user and provider impacts) provides guidance on calculating vehicle operating costs, including fuel operating costs for different types of vehicles. These are reported in TAG data book’s table A1.3.7.
For EVs, fuel operating costs are proxied using the retail price of electricity for domestic use published by the Department for Energy Security and Net Zero (DESNZ).
This approach is simple and transparent, but it has important limitations, because it does not:
- distinguish between vehicle types, such as cars, LGVs, or OGVs
- reflect the different prices users may face depending on where, when and how they charge
To overcome these limitations, we have extended an existing total cost of ownership model developed by the Office for Zero Emission Vehicles (OZEV) and derived separate average EV charging price series for cars, LGVs and OGVs.
Note that by ‘charging price’ we refer to the unit rate faced by users, measured in pence per kilowatt-hour (kWh).
The model is built around the 3 main characteristics of the EV charging market:
- charging prices by location
- charging locations
- charging speeds
The following table presents the current and the 3 new series in 2023 prices and resource cost.
All 2023 prices and resource cost.
| Electricity (p/kWh) | Car (p/kWh) | LGV (p/kWh) | OGV(p/kWh) | |
|---|---|---|---|---|
| 2010 | 16.27 | 20.19 | 20.52 | 11.29 |
| 2011 | 17.34 | 21.23 | 21.36 | 11.78 |
| 2012 | 18.01 | 21.89 | 22.04 | 12.54 |
| 2013 | 18.82 | 22.69 | 22.74 | 13.12 |
| 2014 | 19.54 | 23.39 | 23.42 | 13.79 |
| 2015 | 19.17 | 23.03 | 23.32 | 14.23 |
| 2016 | 18.54 | 22.41 | 22.74 | 13.69 |
| 2017 | 19.46 | 23.31 | 23.43 | 13.98 |
| 2018 | 20.73 | 24.55 | 24.54 | 14.91 |
| 2019 | 22.18 | 22.53 | 24.04 | 15.22 |
| 2020 | 20.99 | 21.51 | 23.24 | 14.93 |
| 2021 | 22.88 | 22.79 | 24.77 | 16.12 |
| 2022 | 33.06 | 33.01 | 33.33 | 21.56 |
| 2023 | 35.94 | 39.54 | 36.57 | 20.53 |
| 2024 | 33.36 | 26.89 | 30.92 | 20.80 |
| 2025 | 30.63 | 27.50 | 30.24 | 20.02 |
| 2026 | 29.32 | 26.38 | 28.85 | 18.74 |
| 2027 | 27.16 | 24.97 | 27.73 | 17.24 |
| 2028 | 25.88 | 24.04 | 26.39 | 15.43 |
| 2029 | 24.96 | 23.64 | 26.12 | 15.07 |
| 2030 | 24.41 | 23.50 | 25.94 | 14.73 |
| 2031 | 23.47 | 23.25 | 25.98 | 14.81 |
| 2032 | 23.01 | 23.13 | 25.74 | 14.33 |
| 2033 | 22.47 | 22.97 | 25.49 | 13.88 |
| 2034 | 22.00 | 22.85 | 25.27 | 13.44 |
| 2035 | 22.29 | 23.27 | 25.62 | 13.58 |
| 2036 | 21.82 | 23.24 | 25.52 | 13.58 |
| 2037 | 21.45 | 23.13 | 25.10 | 13.10 |
| 2038 | 21.52 | 23.41 | 25.19 | 13.20 |
| 2039 | 21.67 | 23.72 | 25.32 | 13.34 |
| 2040 | 21.43 | 23.76 | 25.23 | 13.28 |
| 2041 | 21.58 | 24.02 | 25.29 | 13.32 |
| 2042 | 21.37 | 24.11 | 25.32 | 13.42 |
| 2043 | 21.20 | 24.10 | 25.14 | 13.22 |
| 2044 | 21.12 | 24.18 | 25.11 | 13.20 |
| 2045 | 20.90 | 24.14 | 24.97 | 13.06 |
| 2046 | 20.50 | 23.97 | 24.71 | 12.82 |
| 2047 | 20.46 | 24.00 | 24.63 | 12.72 |
| 2048 | 20.41 | 24.20 | 24.92 | 13.12 |
| 2049 | 20.34 | 24.20 | 24.82 | 13.01 |
| 2050 | 20.57 | 24.33 | 24.77 | 12.88 |
The following chart shows the current and the 3 new series.
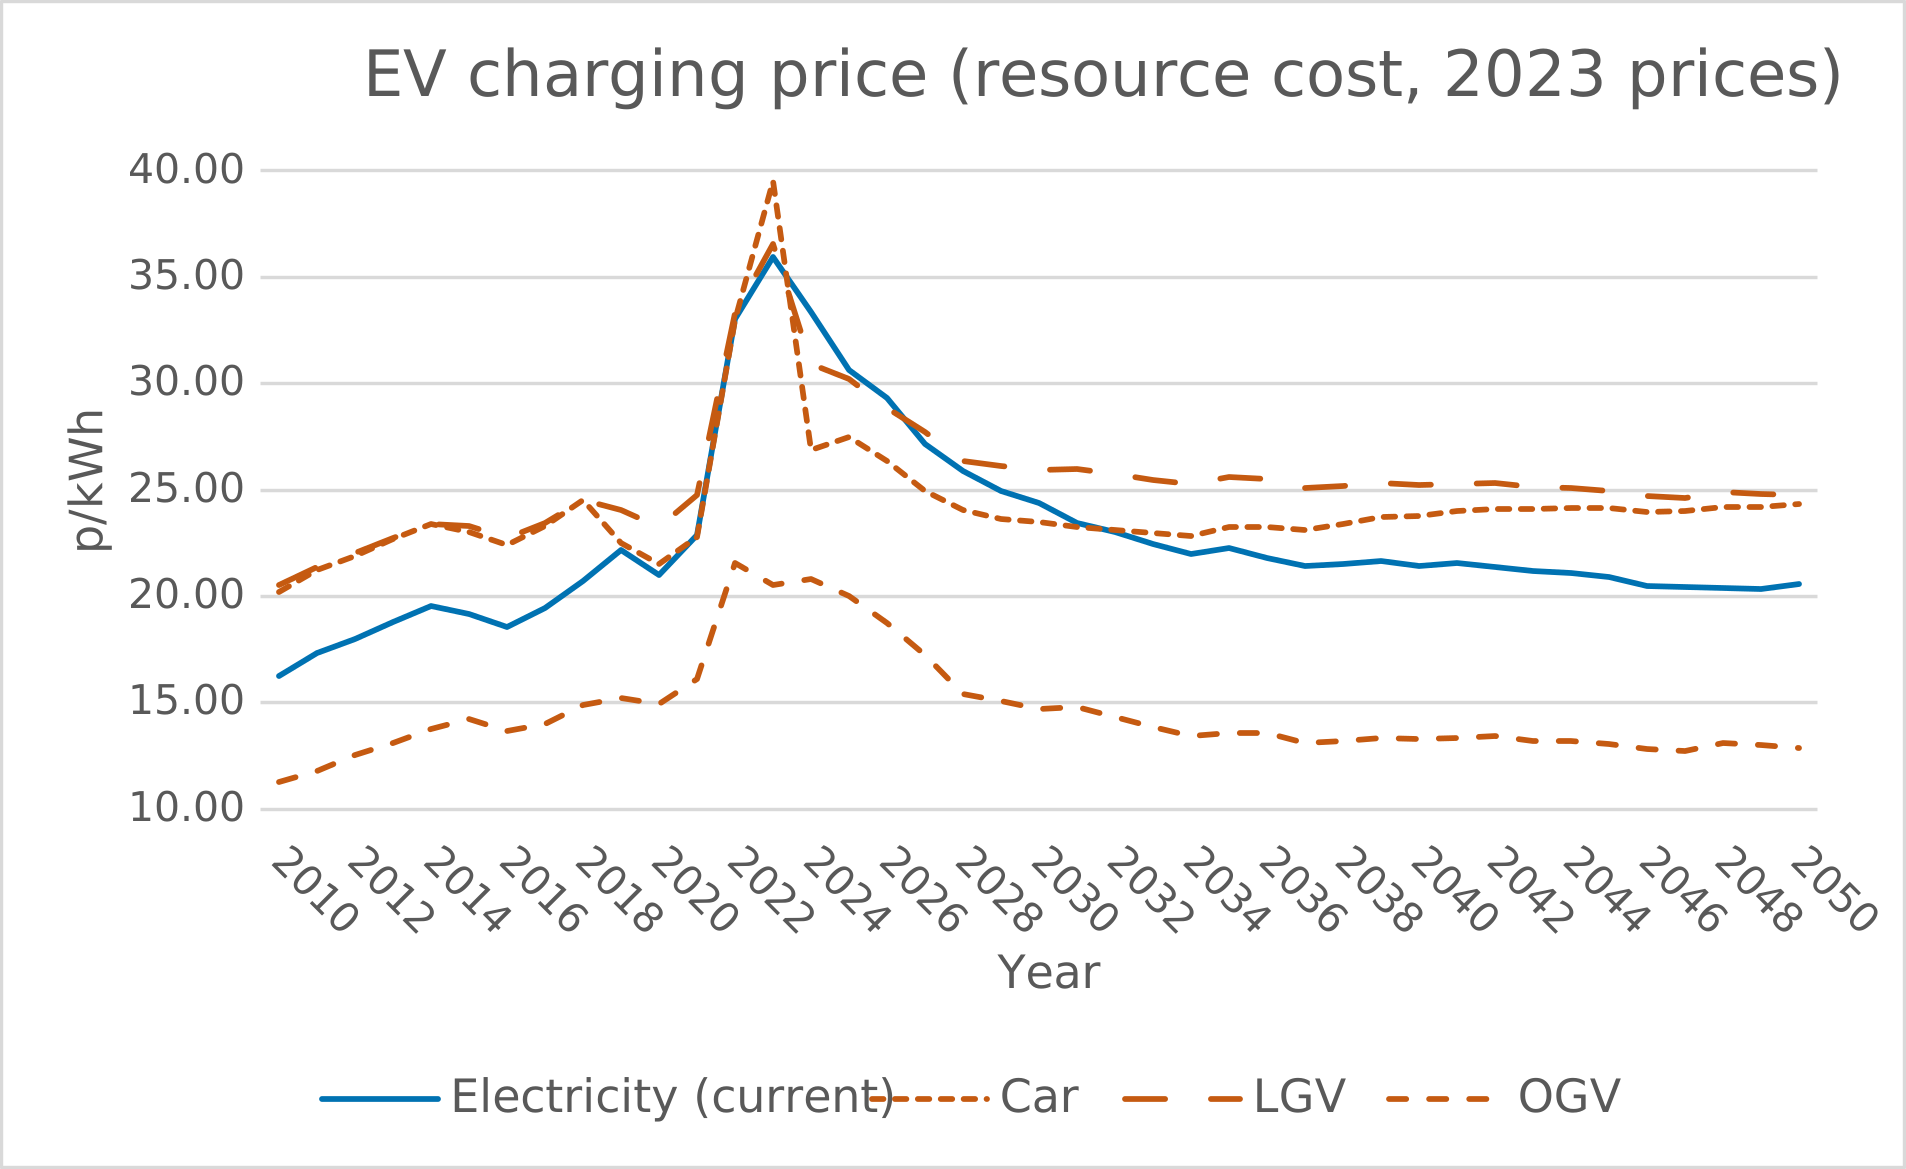
Chart: EV charging price (resource cost, 2023 prices)
The proposed car and LGV series remain relatively close to the current electricity series on average, while the proposed OGV series is materially lower. This is because OGVs are now assumed to be charged at a depot and therefore use DESNZ’s commercial electricity price series, rather than the domestic electricity series used currently in the TAG data book. The average difference between the domestic and commercial series is 8.66 pence.
The following table compares key summary statistics between the 4 series.
| All in p/kWh | Electricity (current) | Car (new) | LGV (new) | OGV (new) |
|---|---|---|---|---|
| Average 2010-2050 | 22.64 | 24.22 | 25.52 | 14.56 |
| Min. All in 2010 | 16.27 | 20.19 | 20.52 | 11.29 |
| Max. All in 2023, exc. OGV in 2022 | 35.94 | 39.54 | 36.57 | 21.56 |
| Average difference with electricity | 1.58 | 2.88 | -8.08 |
Along with a new series for the price of charging cars, LGVs and OGVs, we are introducing corresponding effective VAT rate series.
Currently, the electricity series in the TAG data book assumes VAT is charged at 5%. This is consistent with the current use of DESNZ retail electricity prices for domestic users.
The proposed model combines charging locations that attract different VAT rates. We assume home charging attracts the reduced VAT rate of 5% (or 0% between October 2026 and July 2027), while public charging attracts the standard VAT rate of 20%. For cars and LGVs, the final charging price in each year therefore reflects a different implied VAT rate, depending on the modelled mix of home and public charging and the prices associated with each location.
To reflect this, we calculate an ‘effective’ VAT rate for cars and LGVs. This is an average VAT rate weighted by the charging-location split and the charging price faced in each location. The effective VAT rate varies over time because the assumed mix of home and public charging varies over time. As a greater share of charging is assumed to take place publicly, the effective VAT rate increases. The following formula shows the calculation:

The effective VAT rate calculation applies only to cars and LGVs. OGVs are treated differently: they are assumed to be depot charged using DESNZ’s commercial electricity price series, and we assume this attracts the standard 20% VAT rate throughout the series.
The following table shows the proposed effective VAT rate series.
| Year | Current VAT treatment (electricity) (%) | Proposed new VAT treatment (car) (%) | Proposed new VAT treatment (LGV) (%) | Proposed new VAT treatment (OGV) (%) |
|---|---|---|---|---|
| 2010 | 5.00 | 10.03 | 15.64 | 20.00 |
| 2011 | 5.00 | 9.90 | 15.54 | 20.00 |
| 2012 | 5.00 | 9.82 | 15.51 | 20.00 |
| 2013 | 5.00 | 9.74 | 15.45 | 20.00 |
| 2014 | 5.00 | 9.66 | 15.41 | 20.00 |
| 2015 | 5.00 | 9.70 | 15.48 | 20.00 |
| 2016 | 5.00 | 9.77 | 15.52 | 20.00 |
| 2017 | 5.00 | 9.67 | 15.43 | 20.00 |
| 2018 | 5.00 | 9.56 | 15.35 | 20.00 |
| 2019 | 5.00 | 10.11 | 15.88 | 20.00 |
| 2020 | 5.00 | 10.23 | 15.98 | 20.00 |
| 2021 | 5.00 | 10.13 | 16.04 | 20.00 |
| 2022 | 5.00 | 9.25 | 15.44 | 20.00 |
| 2023 | 5.00 | 8.77 | 14.88 | 20.00 |
| 2024 | 5.00 | 10.40 | 16.53 | 20.00 |
| 2025 | 5.00 | 10.06 | 16.31 | 20.00 |
| 2026 | 5.00 | 9.40 | 16.12 | 20.00 |
| 2027 | 5.00 | 8.54 | 15.91 | 20.00 |
| 2028 | 5.00 | 10.58 | 16.64 | 20.00 |
| 2029 | 5.00 | 10.86 | 16.80 | 20.00 |
| 2030 | 5.00 | 11.12 | 16.91 | 20.00 |
| 2031 | 5.00 | 11.48 | 17.10 | 20.00 |
| 2032 | 5.00 | 11.71 | 17.20 | 20.00 |
| 2033 | 5.00 | 11.95 | 17.30 | 20.00 |
| 2034 | 5.00 | 12.17 | 17.40 | 20.00 |
| 2035 | 5.00 | 12.31 | 17.46 | 20.00 |
| 2036 | 5.00 | 12.55 | 17.51 | 20.00 |
| 2037 | 5.00 | 12.72 | 17.51 | 20.00 |
| 2038 | 5.00 | 12.86 | 17.51 | 20.00 |
| 2039 | 5.00 | 12.98 | 17.50 | 20.00 |
| 2040 | 5.00 | 13.15 | 17.52 | 20.00 |
| 2041 | 5.00 | 13.24 | 17.51 | 20.00 |
| 2042 | 5.00 | 13.38 | 17.54 | 20.00 |
| 2043 | 5.00 | 13.49 | 17.54 | 20.00 |
| 2044 | 5.00 | 13.58 | 17.55 | 20.00 |
| 2045 | 5.00 | 13.68 | 17.56 | 20.00 |
| 2046 | 5.00 | 13.79 | 17.58 | 20.00 |
| 2047 | 5.00 | 13.84 | 17.58 | 20.00 |
| 2048 | 5.00 | 13.93 | 17.61 | 20.00 |
| 2049 | 5.00 | 13.98 | 17.61 | 20.00 |
| 2050 | 5.00 | 13.97 | 17.58 | 20.00 |
Contact
For further information on this guidance update, please contact:
Transport Appraisal and Strategic Modelling (TASM) Division
Department for Transport
First floor, Great Minster House
33 Horseferry Road
London
SW1P 4DR