
Copernicus Evaluation Programme Interim Report - Technical Annex
Published 3 August 2026

© Crown copyright 2026
This publication is licensed under the terms of the Open Government Licence v3.0 except where otherwise stated. To view this licence, visit nationalarchives.gov.uk/doc/open-government-licence/version/3 or write to the Information Policy Team, The National Archives, Kew, London TW9 4DU, or email: psi@nationalarchives.gov.uk.
Where we have identified any third party copyright information you will need to obtain permission from the copyright holders concerned.
This publication is available at https://www.gov.uk/government/publications/evaluation-of-the-uks-participation-in-the-copernicus-programme/copernicus-evaluation-programme-interim-report-technical-annex
Annex A: List of acronyms
| AIT | Assembly, Integration and Test |
| AWS | Amazon Web Services |
| C3S | Copernicus Climate Change Service |
| CCI | Climate Change Initiative |
| CCM | Copernicus Contributing Mission |
| CDSE | Copernicus Data Space Ecosystem |
| CEDA | Centre for Environmental Data Analysis |
| CEMS | Copernicus Emergency Management Service |
| CEOS | Committee on Earth Observation Satellites |
| CHIME | Copernicus Hyperspectral Imaging Mission for the Environment |
| CIMR | Copernicus Imaging Microwave Radiometer |
| CMIN25 | Council of Ministers 2025 |
| CO2M | Copernicus Anthropogenic Carbon Dioxide Monitoring |
| CRISTAL | Copernicus Polar Ice and Snow Topography Altimeter |
| CROME | Crop Map of England |
| CSC‑4 | Copernicus Space Component 4 |
| DG DEFIS | Directorate-General for Defence Industry and Space |
| DIAS | Data and Information Access Services |
| DiD | Difference-in-Difference |
| DSIT | Department for Science, Innovation and Technology |
| ECMWF | European Centre for Medium-Range Weather Forecasts |
| EGMS | European Ground Motion Service |
| EEA | European Environment Agency |
| EO | Earth Observation |
| EOIP | Earth Observation Investment Package |
| ERS | European Remote Sensing Satellite |
| ERS EO | European Resilience from Space to Earth Observation |
| ESA | European Space Agency |
| EU | European Union |
| EUMETSAT | European Organisation for the Exploitation of Meteorological Satellites |
| GEO | Geostationary Earth Orbit |
| GEOSS | Global Earth Observation System of Systems |
| GVA | Gross Value Added |
| IRIS² | Infrastructure for Resilience, Interconnectivity and Security by Satellite |
| LEO | Low Earth Orbit |
| LiDAR | Light Detection and Ranging |
| MAP | Multi-Angular Polarimeter (instrument) |
| MFF | Multiannual Financial Framework |
| NPL | National Physical Laboratory |
| PBEO | Project Board – Earth Observation Programme (ESA) |
| PSM | Propensity Score Matching |
| QE | Quasi-Experimental (design) |
| RAL | Rutherford Appleton Laboratory |
| R&D | Research and Development |
| ROSE-L | Radar Observatory System for Europe in L-band |
| SPAN | Space Academic Network |
| St3TART-FO | St3TART Follow-On |
| TBE | Theory-Based Evaluation |
| TRUTHS | Traceable Radiometry Underpinning Terrestrial- and Helio-Studies |
| UK | United Kingdom |
| UKSA | UK Space Agency |
| UN | United Nations |
| US | United States |
| VfM | Value for Money |
| VHR | Very High Resolution |
| VPN | Virtual Private Network |
| WtP | Willingness-to-Pay |
Annex B: Overview of the Copernicus Programme
Copernicus is a European Union-led programme, established in 2014, which provides wide-ranging EO data and services to governments, industry and research stakeholders globally. The European Commission has entrusted several organisations to design, operate, and deliver the Copernicus programme. Key entrusted entities include ESA, EUMETSAT, ECMWF, and JRC.
The Copernicus programme operates dedicated Sentinel missions:
- Sentinel-1 delivers all-weather radar imagery for land, ice, maritime, and emergency monitoring.
- Sentinel-2 provides high-resolution multispectral optical imagery for land cover, vegetation, agriculture, and inland waters.
- Sentinel-3 measures ocean and land parameters, including sea-surface temperature, ocean colour, and sea-level altimetry, supporting marine and climate services.
- Sentinel-4 provides atmospheric monitoring, including hourly observations over Europe from GEO.
- Sentinel-5 captures data on atmospheric composition, including air pollutants and greenhouse gases.
- Sentinel-5P ensures continuity of atmospheric composition data, serving as a precursor mission to Sentinel-5.
- Sentinel-6 delivers high-precision altimetry for long-term sea-level monitoring and ocean circulation analysis.
Six new Sentinel Expansion Missions are currently in development. Once operational, they will extend capability into priority areas such as CO₂ monitoring, polar observation, and high-resolution infrared imaging. The fleet of Sentinel satellites is supplemented by Copernicus Contributing Missions (CCMs), which provide data from commercial and national satellites. This includes very-high-resolution optical and radar data, altimetry, interferometric products, and atmospheric measurements that fill spatial, temporal, and thematic gaps. Around 30 CCMs are operated by national agencies, EUMETSAT, international partners, and commercial providers. The comprehensive data captured underpins six services: (1) Land Monitoring, (2) Marine Environment Monitoring, (3) Atmosphere Monitoring, (4) Climate Change, (5) Emergency Management Service, and (6) Security.
Most of the data and services are accessible to users globally, including in non-participant countries, through the open access policy. However, participating Member States benefit from access to restricted datasets and services (e.g., Copernicus Emergency Management Service, European Ground Motion Service), higher resolution, better download and bandwidth allowances, ability to task satellites, and cost savings from storage and archiving. Overall, the breadth of data and services offered makes Copernicus state-of-the-art and globally unrivalled. It is also notably Europe’s contribution to the Global Earth Observation System of Systems (GEOSS), bringing significant international visibility and recognition.
Copernicus is primarily funded by all 27 EU Member States, as well as the UK, Norway and Iceland, through Multiannual Financial Frameworks (MFF). For the 2021–2027 MFF, around £5 billion (€5.8 billion) was allocated to Copernicus. Under a 2023 bespoke deal between the UK and the EU, the UK rejoined the Copernicus programme in January 2024, from which it had previously withdrew following the UK’s 2021 EU exit. Since then, the UK has contributed an average of £133 million annually[footnote 1] to the programme, with announced commitments ending at the end of the MFF in late 2027.[footnote 2]
UK budgetary contributions in the current MFF helped address funding gaps. The UK’s additional funding provided £495 million (€576 million) to the space component, which helped secure the development of the expansion missions, Next Generation missions, and a third CO2M model.
Annex C: Methodology
This evaluation adopts a theory-based, mixed-methods approach to assess the impacts of the UK’s participation in the Copernicus programme from January 2024 onwards. The methodology is designed to generate credible, proportionate, and policy-relevant evidence on how UK participation contributes to outcomes across the core impact channels of contract wins, data use, and influence, relative to a counterfactual of non-participation.
The approach aligns with HM Treasury’s Magenta Book guidance for evaluating complex, multi-actor interventions, recognising that Copernicus is a large, international programme in which UK contributions interact with those of other participating states. In this context, the evaluation places emphasis on testing contribution and causal mechanisms through triangulated qualitative and quantitative evidence, rather than relying on a single attribution method.
This annex sets out the core methodology underpinning the evaluation. Quantitative analytical approaches are documented separately:
- Annex D sets out the methodology for Quasi-Experimental (QE) analysis;
- Annex E sets out the methodology for the Willingness-to-Pay analysis; and
- Annex F sets out the methodology for the Value for Money (VfM) analysis.
Theory of Change (ToC)
The evaluation is anchored by a revised Theory of Change (ToC), outlined below, that articulates how UK participation in the Copernicus programme is expected to generate outputs, outcomes, and impacts. The ToC provides a structured representation of the causal pathways linking UK inputs – financial contributions, policy, and engagement by UK organisations – to outcomes across three core impact channels: contract wins, data use, and influence.
Figure 1: Revised ToC
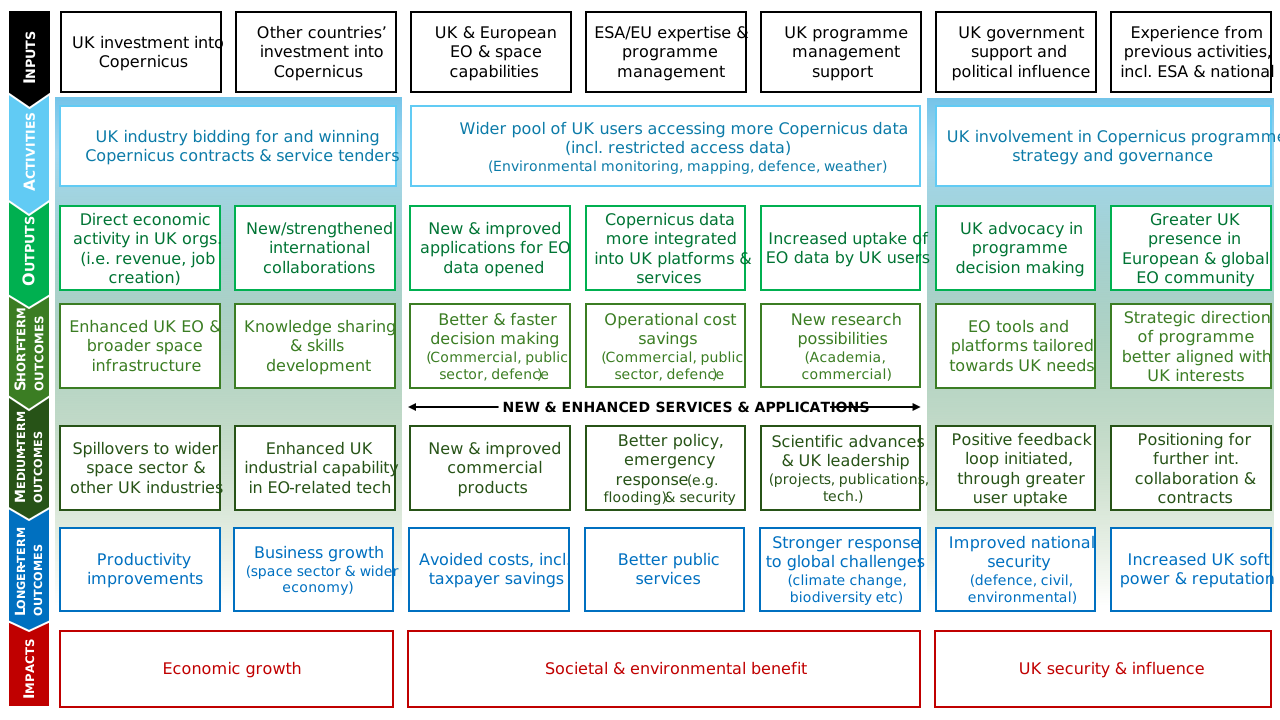
The ToC was developed drawing on existing programme documentation, earlier DSIT analytical work, and expert input, and was refined through engagement with policy and analytical stakeholders. It explicitly incorporates the assumptions, enablers, barriers, and external drivers that condition whether and how benefits materialise.
The ToC is treated as a live analytical framework, enabling refinement as new evidence emerges throughout the remainder of this evaluation. This is particularly important given the evolving nature of Copernicus activities over the evaluation period (Phase 1: July 2025 – March 2026) and the timing of the evaluation relative to future decisions on UK participation.
Evaluation questions and indicators
Evaluation questions were defined by DSIT and refined during the inception phase of the study. They guide the research and ensure that the evaluation’s key objectives are met. The table below presents the overarching evaluation questions for each impact channel. Detailed sub-questions and a corresponding list of indicators (including key performance indicators) were developed to support evidence collection and are also provided in an analytical plan.
| Contract wins |
|---|
| C1: What economic benefits stem from Copernicus contract wins? |
| C2: To what extent has the UK been successful, or hope to be successful, in winning contracts as part of the Copernicus programme? |
| C3: To what extent does Copernicus contribute to a strengthening of the UK’s national capabilities in EO and other relevant areas? |
| C4: To what extent do other sources of funding prepare and support UK entities to win Copernicus contracts? |
| C5: Does participation to Copernicus demonstrate good value for money for growing the EO sector in the UK? |
| Data use |
| D1: How does participation in the programme impact data access and usage, beyond free and open access to Copernicus data available to users from non-participating states? |
| D2: How does Copernicus data impact the welfare of UK citizens? And to what extent does this depend on UK participation? |
| D3: How and to what extent are data and services across the whole Copernicus programme used to support the provision of public services in the UK? |
| D4: How significant is UK participation to UK-based scientific research, particularly climate science? |
| D5: Does participation to Copernicus demonstrate good value for money for UK data users? |
| Influence |
| I1: To what extent does the UK influence priorities and direction of the programme? |
| I2: Does UK influence lead to benefits for the UK? |
| I3: How does UK participation shape the scale and output of the programme? |
| I4: What are the international collaboration benefits of participation? |
Defining the counterfactual
Defining a suitable counterfactual is challenging due to the complexity of the landscape and uncertainty about what might have occurred in the absence of the intervention, given the number of factors and actors involved. We have created a ‘counterfactual scenario’ for each of the three impact channels, which then underpin the assessment of additionality throughout the evaluation.
In order to set out the counterfactual scenarios, we leveraged evidence from interviews and documentation, and validated our assumptions through discussions with both DSIT and UKSA to ensure agreement.
Evidence collection
The evaluation draws on a qualitative and quantitative evidence base. Evidence collection was structured to ensure coverage, where possible, across all evaluation questions and indicators whilst maintaining proportionality.
Primary research
Primary evidence collection for this evaluation included:
- 100 semi-structured interviews with a wide range of stakeholders across UK industry, government, research, European institutions, and international actors; and
- A survey of UK Copernicus data users (142 complete responses and 17 partial responses) to capture patterns of data access, use, willingness-to-pay, and benefits.
- Presentations (with discussion / feedback opportunities) at various committee meetings and working groups, including with UKspace, EO SPAN, NCEO, Space Partnerships, and NCSP Climate Working Group.
Interview topic guides were developed and tailored to each stakeholder group, using relevant, non-leading, open-ended questions to collect evidence aligned with the indicators. All guides incorporated DSIT and UKSA feedback and were validated prior to use. Interviews were conducted virtually between September 2025 and February 2026.
A questionnaire was developed, refined following DSIT and UKSA feedback, and validated prior to launch. The survey was disseminated online via the Smart Survey platform and remained open for 6 weeks through November and December 2025. Organisations identified as UK data users were proactively invited by email. The survey was also promoted on LinkedIn and through intermediaries such as UKSA, DSIT, local space clusters, UKspace, and SPAN via social media, newsletters, and event outreach. Stakeholders could opt in by email or by completing a dedicated online form to access the survey. Multiple individuals from the same organisation were able to respond to capture different uses and perspectives.
Secondary research
Primary sources of evidence were complemented by desk-based review and analysis of secondary data, with over 60 different documents and datasets examined. This includes:
- Copernicus and EU programme documentation (e.g., business case, annual reports, data user uptake reports, association cost data);
- Existing monitoring and contracts data from DSIT, ECMWF, Mercator Ocean and ESA;
- Published and confidential evaluations and studies (e.g., EOIP, UK in ESA at CMIN22, Copernicus, EU Space Programme);
- Published statistics and data-use metrics; and
- Position papers from relevant stakeholders (e.g., UKspace, ESA PBEO).
All evidence sources were systematically mapped to evaluation questions and indicators to ensure sufficient coverage, transparency, consistency, and traceability between data collection and analytical conclusions.
Analysis and synthesis
Analysis
Quantitative analytical methods were used in this evaluation, including willingness-to-pay, quasi-experimental, and value-for-money analyses, as outlined in Annexes D to F.[footnote 3] The evidence was further analysed using complementary Theory-Based Evaluation (TBE) methods: Contribution Analysis (CA), Process Tracing (PT), and Outcome Harvesting (OH). These methods are applied in an integrated and proportionate way, consistent with HMT Magenta Book guidance for evaluating complex, multi-actor programmes.
Contribution analysis (CA)
CA provides the overarching analytical structure for the evaluation. We used it to assess whether UK participation in Copernicus has made a credible and plausible contribution to observed outcomes across the impact channels. CA is implemented by:
- Systematically testing each relevant ToC pathway against the available evidence;
- Triangulating qualitative and quantitative data to assess consistency with the expected mechanisms of change; and
- Explicitly considering and assessing alternative explanations, including other UK and EU funding programmes, global EO market developments, and macroeconomic or geopolitical factors.
Given the shared governance and delivery of Copernicus, CA is particularly well suited to distinguishing the UK’s marginal contribution within a wider international system, without overstating attribution.
Process Tracing (PT)
We used Process Tracing (PT) selectively to strengthen causal inference for specific, policy-relevant mechanisms where contribution claims are contested or where understanding “how” and “why” outcomes arise is critical.
PT focuses on identifying and testing causal fingerprints - pieces of evidence that confirm or refute hypothesised causal links within the ToC. This includes documentary and interview evidence, and records that shed light on whether UK participation influenced decisions, behaviours, or outcomes in practice. Process Tracing is applied proportionately, prioritising pathways where:
- Quantitative counterfactual evidence is weak or unavailable; and
- The evaluation needs to demonstrate UK added value, for example in relation to governance influence or the enabling role of participation for data use in public services.
Outcome Harvesting (OH)
Outcome Harvesting (OH) complements CA and PT by identifying emergent, unintended, or spillover outcomes that may not have been fully anticipated in the ToC. OH works by:
- Identifying outcomes through interviews, surveys, workshops, and documentary review;
- Verifying these outcomes using independent sources where possible; and
- Working backwards to assess the extent to which UK participation plausibly contributed to their realisation.
This approach is particularly valuable for a systemic programme such as Copernicus, where impacts may extend beyond formal contracts or predefined data uses, and where both positive and negative effects may emerge over time.
Synthesis and validation
Building on the analysis, we conducted four internal whiteboarding sessions to discuss emerging findings, challenge interpretations, identify evidence gaps, and plan how to present the evidence clearly and coherently. Findings were synthesised both within and across impact channels to assess cross-cutting issues such as additionality, benefit realisation dynamics, and high-level effects.
To strengthen credibility and guard against confirmation bias, findings were subjected to validation and challenge by an Expert Panel with deep technical, policy, and sectoral expertise in EO and Copernicus-related activities.
Additionally, selected emerging findings were shared and discussed with DSIT during the analysis phase to sense-check interpretation, ensure factual accuracy, and confirm alignment with programme context. This engagement informed refinement of conclusions but did not substitute for independent analytical judgement.
Annex D: Methodology – QE analysis
The QE analysis provides quantitative evidence on the direct economic impacts of winning Copernicus contracts on the subsequent commercial performance of UK based firms. The QE analysis contributes to the wider evaluation by providing robust, causal evidence aligned with the theory of change and has also informed the value for money assessment. The analysis addresses the following evaluation question: C1. What economic benefits stem from Copernicus contract wins?
UK Copernicus contract participation
Since 2014, more than 250 Copernicus contracts worth over £150 million (€200 million) have been awarded to 94 unique UK-based entities, primarily through ESA and ECMWF procurement mechanisms. Of this total, 66% of contract value has been awarded to private companies. Specifically, 60 UK-based private firms have received £114 million (€131 million) across multiple contracts. These firms form the treatment group for this analysis. This focus reflects the availability of longitudinal business data for private firms which enables the estimation of employment and turnover impacts.
Figure 2: Total number of unique contract winners by type, 2014-2025
| Year | Public | Private | Total |
|---|---|---|---|
| 2014 | 4 | 5 | 9 |
| 2015 | 4 | 10 | 14 |
| 2016 | 7 | 16 | 23 |
| 2017 | 8 | 14 | 22 |
| 2018 | 8 | 13 | 21 |
| 2019 | 5 | 13 | 18 |
| 2020 | 2 | 3 | 5 |
| 2021 | 9 | 5 | 14 |
| 2022 | 5 | 2 | 7 |
| 2023 | 3 | 2 | 5 |
| 2024 | 14 | 7 | 21 |
| 2025 | 13 | 9 | 22 |
Source: Source: ESA data on contract winners provided to the evaluation consortium by DSIT
Note: Copernicus Agreement between EU/ESA was signed in October 2014. Contracts won in the period of non-participations are ad-hoc arrangements (mainly with public organisations through ESA and Mercator).
Figure 3: Total number of unique contract winners by contract source, 2014-2025
| Year | Space (ESA) | Land (EEA) | Atmosphere and Climate (ECMWF) | Marine (Mercator) | Total |
|---|---|---|---|---|---|
| 2014 | 0 | 0 | 0 | 9 | 9 |
| 2015 | 8 | 0 | 6 | 0 | 14 |
| 2016 | 7 | 0 | 16 | 0 | 23 |
| 2017 | 7 | 1 | 14 | 0 | 22 |
| 2018 | 6 | 0 | 15 | 0 | 21 |
| 2019 | 4 | 1 | 13 | 0 | 18 |
| 2020 | 4 | 1 | 0 | 0 | 5 |
| 2021 | 6 | 0 | 6 | 2 | 14 |
| 2022 | 2 | 0 | 1 | 4 | 7 |
| 2023 | 1 | 1 | 0 | 3 | 5 |
| 2024 | 5 | 0 | 12 | 4 | 21 |
| 2025 | 3 | 0 | 12 | 7 | 22 |
Source: ESA data on contract winners provided to the evaluation consortium by DSIT
Note: Copernicus Agreement between EU/ESA was signed in October 2014. Contracts won in the period of non-participations are ad-hoc arrangements (mainly with public organisations through ESA and Mercator).
Figure 4: Total value of Copernicus contracts by type (€), 2014-2025
| Year | Private (€m) | Public (€m) | Total (€m) |
|---|---|---|---|
| 2014 | 0.1 | 2.0 | 2.1 |
| 2015 | 85.4 | 13.7 | 99.2 |
| 2016 | 8.2 | 11.5 | 19.7 |
| 2017 | 11.2 | 5.2 | 16.4 |
| 2018 | 5.7 | 4.6 | 10.3 |
| 2019 | 5.9 | 5.1 | 11.0 |
| 2020 | 0.4 | 2.2 | 2.6 |
| 2021 | 0.6 | 2.9 | 3.5 |
| 2022 | 0.7 | 2.3 | 2.9 |
| 2023 | 0.0 | 1.1 | 1.1 |
| 2024 | 5.0 | 8.5 | 13.5 |
| 2025 | 7.7 | 9.6 | 17.3 |
Source: ESA data on contract magnitudes provided to the evaluation consortium by DSIT
Note: Copernicus Agreement between EU/ESA was signed in October 2014. Contracts won in the period of non-participation are ad-hoc arrangements (mainly with public organisations through ESA and Mercator).
Figure 5: Total value of Copernicus contracts by contract source (€), 2014-2025
| Year | Space (ESA) | Land (EEA) | Atmosphere and Climate (ECMWF) | Marine (Mercator) | Total |
|---|---|---|---|---|---|
| 2014 | 0.00 | 0.0 | 0.0 | 2.1 | 2.1 |
| 2015 | 92.2 | 0.0 | 4.9 | 2.1 | 99.2 |
| 2016 | 9.3 | 0.0 | 8.3 | 2.1 | 19.7 |
| 2017 | 7.4 | 0.8 | 6.2 | 2.1 | 16.5 |
| 2018 | 3.3 | 0.0 | 4.9 | 2.1 | 10.3 |
| 2019 | 2.3 | 0.0 | 6.6 | 2.1 | 11.0 |
| 2020 | 0.3 | 0.1 | 0.0 | 2.1 | 2.6 |
| 2021 | 2.4 | 0.0 | 0.0 | 1.1 | 3.5 |
| 2022 | 0.9 | 0.0 | 0.6 | 1.5 | 2.9 |
| 2023 | 0.2 | 0.0 | 0.0 | 0.9 | 1.1 |
| 2024 | 7.6 | 0.0 | 3.4 | 2.4 | 13.5 |
| 2025 | 4.6 | 0.0 | 10.7 | 2.0 | 17.3 |
Source: Data on contract magnitudes provided to the evaluation consortium by DSIT (from ESA, Mercator, ECMWF, EEA)
Note: Copernicus Agreement between EU/ESA was signed in October 2014. Contracts won in the period of non-participation are ad-hoc arrangements (mainly with public organisations through ESA and Mercator).
Note: Mercator contract data for MFF2014 did not include a breakdown per year. We have assumed an even annual split across for 2014-2020. To maximise sample size, the assessment draws on the full historical sample of UK contract winners to inform potential post-re-association impacts. This historical sample offers a larger number of treated firms and a longer timer-series of post-treatment data.
Econometric approach
Copernicus contracts are awarded through competitive procurement and there is no mechanism to guarantee participating countries earn a certain ‘rate of return’ (unlike ESA’s geographical return mechanism for example). Firms can win contracts individually or as part of a wider consortium (which may include a mixture of UK based companies and companies based in other participating countries).
Firms that win contracts may differ systematically from non-winners even before treatment. For example, contract winners may be more specialised, more innovation-driven, or more concentrated in EO-related sectors. Simple comparisons of outcomes between winners and non-winners would therefore confound pre-existing firm characteristics with the potential effect of contract wins.
To address this challenge, the evaluation adopts QE methods to construct a credible counterfactual (i.e., an estimate of what would have happened to winners had they not won contracts). This allows observed differences in post-award performance to be more plausibly attributed to the contract itself rather than to underlying structural differences between firms. The QE analysis combines two complementary techniques:
- Propensity score matching (PSM) to match each UK winning firm with firms that have not won a Copernicus contract but otherwise appear to be similar based on pre-treatment characteristics such as size, age, sector, region, and innovation indicators (e.g. patents, R&D grants). This ensures that treated and comparison firms are as similar as possible before contracts are awarded.
- Difference-in-differences (DiD) to compare how outcomes evolve over time for matched treated and comparison firms before and after contracts are awarded. This controls for broader economic trends that affect both groups (e.g., COVID-19 pandemic).
Together, the PSM–DiD approach provides the most feasible and robust method for isolating the direct impacts of Copernicus contract wins given the available data and sample sizes. Other methods were assessed including staggered DiD and synthetic control groups but were discarded due to the limited number of treated firms winning contracts each year. Our QE analysis followed a structured sequence of steps to construct a credible counterfactual and estimate firm-level impacts. These steps are summarised below:
- Step 1: Identification of UK private firms that have won Copernicus contracts since 2014 (treatment group).
- Step 2: Definition of an appropriate pool of non-winning firms operating in comparable EO-related markets (comparison pool).
- Step 3: Assessment baseline comparability and data availability across treatment and comparison pools.
- Step 4: Matching of treated firms to similar non-treated firms using pre-treatment characteristics.
- Step 5: Estimation of longitudinal outcome differences between treated and matched comparison firms before and after contract award, as well as how dynamic effects evolve over time.
- Step 6: Carry-out sensitivity and robustness checks under alternative modelling choices.
Each of these steps is described in detail below.
Step 1. Construction of treatment group
The treatment group consists of UK-based private firms that have won at least one Copernicus contract since 2014. Contract award records provided by DSIT were matched to Beauhurst dataset. Beauhurst is a proprietary database covering startup and high-growth firms populated using web-crawling of various online sources and official fillings. Beauhurst’s geographic coverage is primarily focused on the UK (with limited coverage of Germany), making it one of the “richest available sources of data on UK businesses”[footnote 4]. The database classifies around 4.6 million companies and covers approximately 40% of all active UK companies, which together account for around 75% of UK employment and turnover (McCrea, 2024). Data quality is also high, as records are verified by an internal team of experts.
We use Beauhust dataset to obtain: (i) company identifiers (i.e. Companies House Registration Number), (ii) firm characteristics (e.g., sector and activity classifications, geographic locations, year of incorporation and cessation), (iii) R&D / innovation activity, and (iv) longitudinal performance data on selected outcomes (i.e. UK employment headcount and turnover). All 49 private sector Copernicus contract winners were successfully matched to the Beauhurst database. To boost analytical robustness and maximise relevance of findings to the UK’s EO supply chain (in line with the ToC), the core treatment sample excludes:
- Firms operating outside EO-relevant activities (e.g., accounting, marketing, graphic design, market research, event management);
- Very large firms, where contract values represent a small share of total business and suitable comparisons are scarce; and
- Sole traders, where financial reporting is incomplete.
The final sample includes 36 private contract winners (who collectively represent 33% of the total value of contracts awarded to private UK organisations). Alternative specifications that reintroduce these excluded groups are tested in sensitivity analysis (see Step 6).
Step 2. Identification of control group
A pool of potential comparison firms was drawn from Beauhurst, including information on their sector classifications and characteristics. Two alternative approaches were explored to identify firms operating in markets comparable to Copernicus contract winners:
- Manual sector-based selection, using EO-related sector classifications (SIC codes and proprietary Beauhurst industry categories) and keyword tagging. This resulted in a control population pool of 370 UK private companies.
- Automated similarity-based selection, using Beauhurst embedded machine-learning algorithm to identify similar companies to those that have won Copernicus contracts. This resulted in a control population pool of 289 UK private companies.
Descriptive analysis showed that the manual sector-based control population pool more closely aligns with treated firms in terms of observed characteristics. The manual sector-based comparison pool is therefore used as the primary source from which matched controls are selected. The automated similarity-based pool is retained for robustness testing (see Step 6).
Step 3. Baseline comparability and data availability checks
Before impact estimation, baseline outcome levels and trends are examined for treatment and comparison pools. These results confirm that:
- Contract-winning firms have higher baseline average employment and turnover than comparison firms;
- Growth trends differ substantially between groups prior to matching; and,
- Turnover data is less complete than employment data, particularly for smaller or inactive firms (see Figure 6 below). For example, in excess of 90% of potential control firms identified via Beauhurst’s algorithm are missing turnover data in each year.
Figure 6: Share of missing values by outcome and group, 2015-2024
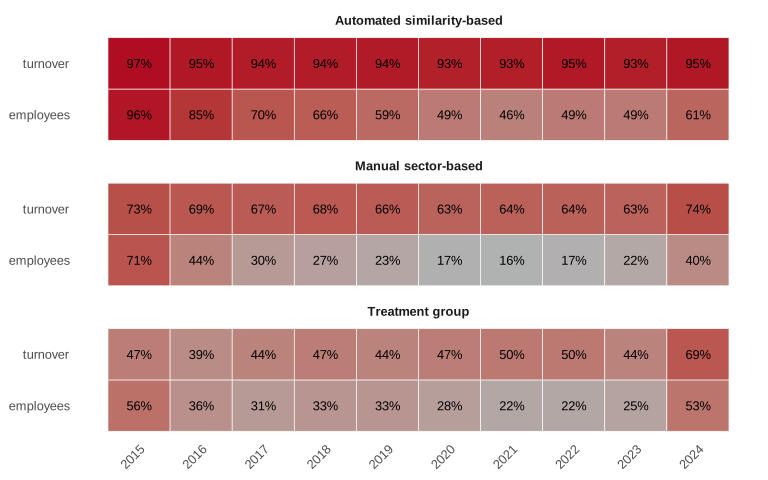
Source: Beauhurst
Note: Excludes large, sole traders and non-EO firms.
These checks confirm that simple comparisons would be misleading and justify the use of matching and longitudinal counterfactual methods. They also inform interpretation of later turnover results, which are estimated on a smaller effective sample due to missing data.
Step 4. Propensity Score Matching (PSM) specification
To construct a credible comparison group, each treated firm is matched to non-treated firms with similar pre-treatment characteristics using PSM. First, the probability of winning a Copernicus contract is estimated for all firms in the treatment group and manually selected comparison pool using a logistic regression model. This model uses only pre-treatment characteristics, ensuring that matching is based solely on information available before contract award.
The propensity score model is specified as:
P(Ti = 1) = β0 + β1 ln employmenti,t−1 + β2firm_agei + β3industry_groupi + β4region_groupi + β5UK_headquarteredi + β6pre_patenti + β7pre_fundingi + β8pre_granti
Where:
- ln employmenti,t−1 = Log of the firm’s employment in the last year before treatment (or earliest available year for controls).
- firm_agei = Age of the firm (in years) at the time of treatment, or the baseline year for controls.
- industry_groupi = Categorical variable firm’s grouped top-level industry (digital and non-digital)
- region_groupi = Categorical variable firm’s grouped region
- UK_headquarteredi = indicator equal to 1 if the firm’s headquarters is based in the UK.
- pre_patenti = Indicator equal to 1 if the firm has any patent before treatment (or before the baseline year for controls).
- pre_fundingi = Indicator equal to 1 if the firm has received funding before treatment (or before the baseline year for controls).
- pre_granti = Indicator equal to 1 if the firm has received grants before treatment (or before the baseline year for controls).
Each treated firm is matched to non-treated firms with similar estimated propensity scores. Balance diagnostic tests confirm that matching substantially reduces observable differences between treated and comparison firms prior to contract award. Most covariates no longer show statistically significant differences in average values after matching, and the procedure successfully removes large structural differences between treated and comparison firms. The eliminated structural differences include firm size, headquarter location, regional composition, industry grouping, and prior access to grants and external funding.
However, some residual differences remain (i.e., treated firms have slightly higher employment on average and have typically been established for longer than control firms). The ability to fully adjust for these differences is constrained by the limited availability of long-run pre-treatment data, as the Beauhurst database provides consistent longitudinal information only for approximately the last decade (2015–2024).
These residual imbalances mean that results should be interpreted with appropriate caution. In a future phase of the evaluation, access to Business Structure Database /ONS microdata will enable longer pre-treatment histories to be incorporated and a more robust counterfactual to be constructed.
The matched sample forms the basis for all subsequent impact estimation.
Figure 7: Balance checks between unmatched and matched treatment and control groups

Note: Each point on the chart represents the absolute mean difference in a specific firm characteristic between treated and comparison firms. The vertical dashed lines indicate common thresholds for acceptable balance (0.10). Points falling to the left of these lines show covariates where treated and comparison firms are sufficiently similar after matching, while points to the right indicate remaining imbalance.
Step 5. Difference-in-differences model specification
After matching, impacts are estimated by comparing how outcomes evolve over time for treated and matched comparison firms before and after the first Copernicus contract award. For each treated firm, the year of first contract win is treated as the intervention point. Outcomes in post-award years are compared with outcomes in pre-award years, relative to changes observed for matched comparison firms over the same period. This longitudinal comparison isolates post-contract differences in performance while controlling for time-invariant firms characteristics and economic-wide shocks affecting all firms.
Impacts are estimated using a difference-in-differences (DiD) model applied to the matched sample. For each outcome variable, the model compares changes in firm outcomes before and after the first Copernicus contract win for treated firms against changes observed over the same period for matched comparison firms.
The main model specification is as follows:
Yit = α + δDit + μi + Tt + εit
Where:
- Yit = Outcome of interest (e.g., employment, turnover) for firm in year .
- α = Constant.
- δ = Percentage change in outcome that is causally attributable to winning Copernicus contract.
- Dit = Treatment indicator equal to 1 for treated firms in all years at or after they receive their first Copernicus contract.
- μi = Firm fixed effects which control for all time-invariant firm characteristics (region, sector, etc.)
- Tt = Time fixed-effects which control for shocks common to all firms in year (Covid, macroeconomic shocks, disassociation period, etc.).
- εit = Error term
The coefficient δ represents the average post-award impact of winning a Copernicus contract. Separate models are estimated for employment and turnover. Standard errors are clustered at firm level to account for repeated observations over time.
To examine how impacts evolve over time after a contract win, a dynamic model is also estimated. Each firm’s first contract award year is treated as time zero. The model estimates outcome differences at successive horizons following treatment.
Step 6. Sensitivity and robustness analysis
Given the relative low number of treated firms and data limitations, extensive sensitivity checks are undertaken to test the stability of results.
| Model name | Description | Fixed-effects | Purpose/interpretation | |||||||
|---|---|---|---|---|---|---|---|---|---|---|
| A. Main specification | PSM-weighted DiD using “manually searched” control group. | Firm, year | Baseline causal estimate. Controls for all time-invariant firm factors | |||||||
| B. Alternative control population | Using Beauhurst’s “similar companies” control group | Firm, year | Explores how results change if different control group population is used | |||||||
| C. Alternative matching specification | Re-estimates ATT using reduced PSM specification | Firm, year | Checks whether results depend on specific PSM covariates | |||||||
| D. Alternative matching method | Inverse probability weighting matching | Firm, year | Uses an extended sample as PSM drops many observations due to limited overlap | |||||||
| E. Short window (2014-2019) | Excluding data from 2020-2024 | Firm, year | Tests sensitivity to long-term trends / Effects might take some time to materialise | |||||||
| F. Including non-EO firms | Keeping non-EO firms in treatment and control populations | Firm, year | Explore how impacts change when broader set of treated firms is included | |||||||
| G. Including sole traders | Keeping sole traders in treatment and control populations | Firm, year | Explore how impacts change when broader set of treated firms is included | |||||||
| H. Including large firms | Keeping large firms in treatment and control populations | Firm, year | Explore how impacts change when broader set of treated firms is included | |||||||
| I. Excluding non-London firms | Excluding London firms in treatment and control populations | Firm, year | Agglomeration effects in London may be larger | |||||||
| J. Industry specific time trends | Allows each industry to follow its own growth path | Firm, year, industry * year | Controls against industry-driven pre-trend bias | |||||||
| K. Region specific time trends | Allows each region to follow its own growth path | Firm, year, region * year | Controls against region-driven pre-trend bias | |||||||
| L. Time placebo | Assigning treatment 2 years earlier as a placebo | Firm, year | Should show no effect | |||||||
| M. Outcome placebo | Alternative outcome which should not be affected by treatment (UK headquarters) | Firm, year | Ensures estimated effects is not picking up generic firm characteristics or selection bias, spurious relationships. |
Results
Results are reported separately for employment and turnover. Employment data is available for a larger share of firms across the study period and therefore provide the most reliable estimates of post-contract impacts. Turnover data is less complete, particularly in early post-treatment years, and turnover results should therefore be interpreted with greater caution. Full results from the main specification and sensitivity tests are reported in the accompanying tables.
Employment impacts
Companies that won Copernicus contracts experienced faster and economically-meaningful employment growth relative to comparable UK firms in the first 3 years (T=0, T=1, and T=2). The point estimates of additional growth and associated 90% confidence intervals in each of these three years are 14% (2 – 29%), 13% (3 – 25%) and 17% (2 – 35%). The magnitude of the initial effects is substantial, suggesting a potentially economically meaningful impact which can be explored further in future evaluation phases. Our estimated effects of winning Copernicus contract on employment in later years weaken and are not statistically significant, although they do remain positive.
| Model name | Total Obs. | Treated obs. | Control obs. | Estimate | P-value | % effect | Adj. R2 |
|---|---|---|---|---|---|---|---|
| T = 0 | 142 | 16 | 126 | 0.14* | 0.08 | 14.51 | 0.98 |
| T = 1 | 142 | 19 | 123 | 0.13** | 0.05 | 13.15 | 0.98 |
| T = 2 | 142 | 18 | 124 | 0.17* | 0.07 | 17.36 | 0.98 |
| T = 3 | 142 | 16 | 126 | 0.16 | 0.13 | 15.79 | 0.98 |
| T = 4 | 142 | 12 | 130 | 0.14 | 0.19 | 13.71 | 0.98 |
| T = 5 | 142 | 13 | 129 | 0.0 | 0.79 | 2.83 | 0.98 |
Note: *, **, and *** indicate statistical significance at the 10%, 5%, and 1% levels, respectively. Number of observations include combinations of year and firms, not unique firms.
Overall, while statistical significance varies across specifications, the weight of evidence indicates that Copernicus contract wins may be associated with positive and economically meaningful employment impacts at treated firms.
When aggregating across all years the main specification indicates that, on average across all post-treatment years, firms that win Copernicus contracts exhibit approximately 17% higher employment than comparable non-winning firms. The estimated effect is not statistically significant at conventional levels (p = 0.12). Nevertheless, the broader pattern of sensitivity tests suggests economically meaningful employment gains associated with contract wins:
- Alternative control group definitions yield larger and statistically significant estimates, indicating that results are sensitive to how the comparison group is constructed.
- Re-estimating the model with alternative matching specifications and alternative sample definitions confirms that estimated effects are not driven by the specific matching algorithm or covariate set, and remain positive across most variants.
- Expanding the sample using inverse probability weighting (IPW) substantially increases the number of observations and yields a smaller but statistically significant employment effect, indicating that model precision improves with larger effective sample sizes.
- Including large firms in the sample produces a larger and statistically significant estimate. This may reflect differences in how large firms are matched, given their more unique characteristics, and/or residual differences in pre-treatment employment trends..
- Placebo tests applying false treatment timing and false outcome variables show no evidence of spurious effects, supporting a credible causal interpretation of observed post-award differences.
| Model name | Total Obs. | Treated obs. | Control obs. | Estimate | P-value | % effect | Adj. R2 |
|---|---|---|---|---|---|---|---|
| A. Main specification | 360 | 115 | 245 | 0.16 | 0.12 | 16.91 | 0.97 |
| B. Alternative control population | 230 | 70 | 160 | 0.43** | 0.02 | 54.13 | 0.87 |
| C. Alternative matching specification | 356 | 115 | 241 | 0.12 | 0.35 | 12.83 | 0.96 |
| D. Alternative matching method | 2,763 | 203 | 2,680 | 0.14** | 0.04 | 15.27 | 0.97 |
| E. Short window (2014-2019) | 363 | 115 | 248 | 0.16* | 0.10 | 17.65 | 0.98 |
| F. Including non-EO firms | 422 | 146 | 276 | 0.17 | 0.12 | 19.01 | 0.95 |
| G. Including sole traders | 330 | 108 | 222 | 0.17 | 0.22 | 18.05 | 0.95 |
| H. Including large firms | 340 | 115 | 225 | 0.26** | 0.01 | 29.97 | 0.95 |
| I. Excluding non-London firms | 250 | 63 | 187 | 0.26* | 0.06 | 29.47 | 0.96 |
| J. Industry specific time trends | 250 | 115 | 245 | 0.25** | 0.01 | 28.88 | 0.96 |
| K. Region specific time trends | 250 | 115 | 245 | 0.25** | 0.01 | 28.91 | 0.96 |
| L. Time placebo | 360 | 115 | 245 | -0.02 | 0.80 | -2.19 | 0.96 |
| M. Outcome placebo | 490 | 115 | 245 | 0.00 | 1.00 | 0.00 | 1.00 |
Note: *, **, and *** indicate statistical significance at the 10%, 5%, and 1% levels, respectively. Number of observations include combinations of year and firms, not unique firms.
Turnover impacts
Dynamic event-time estimates suggest that turnover at treated firms initially increases following contract award, before weakening at mid-horizons and recovering in later years. However, horizon-specific estimates are substantially less precise than for employment. This imprecision reflects the high incidence of missing turnover data in early post-award years and the smaller number of firms contributing observations at longer horizons.
| Model name | Total Obs. | Treated obs. | Control obs. | Estimate | P-value | % effect | Adj. R2 |
|---|---|---|---|---|---|---|---|
| T = 0 | 114 | 12 | 102 | 0.70 | 0.38 | 102.08 | 0.61 |
| T = 1 | 114 | 15 | 99 | 0.75 | 0.23 | 110.74 | 0.61 |
| T = 2 | 114 | 14 | 100 | 0.31 | 0.35 | 36.85 | 0.61 |
| T = 3 | 114 | 13 | 101 | -0.20 | 0.60 | -18.38 | 0.61 |
| T = 4 | 114 | 10 | 104 | -0.48 | 0.45 | -38.22 | 0.61 |
| T = 5 | 114 | 10 | 104 | 0.33 | 0.33 | 19. | 0.61 |
Note: *, **, and *** indicate statistical significance at the 10%, 5%, and 1% levels, respectively. Number of observations include combinations of year and firms, not unique firms.
The main matched difference-in-differences specification indicates that, on average across post-treatment years, firms that win Copernicus contracts exhibit approximately 62% higher turnover than comparable non-winning firms. The estimated effect is statistically significant at the 10% level. However, turnover results should be interpreted with caution because turnover data are missing for a substantial share of firms, reducing the effective sample size, and because treated firms remain slightly older on average even after matching.
Across sensitivity specifications, positive turnover effects are observed in most models, reinforcing the direction of the main finding.
- The largest estimated effects arise when using alternative comparison populations, though these rely on smaller samples and therefore have limited statistical precision.
- Alternative matching approaches yield weaker and statistically insignificant estimates, indicating that turnover results are more sensitive to modelling choices than employment results.
- Including large firms in the sample produces larger and statistically significant turnover impacts, consistent with the possibility that larger firms benefit more from scale effects following contract wins, although residual differences in pre-treatment growth trends may still play a role.
- Placebo tests show no evidence of spurious effects, supporting a credible causal interpretation.
| Model name | Total Obs. | Treated obs. | Control obs. | Estimate | P-value | % effect | Adj. R2 |
|---|---|---|---|---|---|---|---|
| A. Main specification | 255 | 92 | 163 | 0.48* | 0.07 | 61.95 | 0.80 |
| B. Alternative control population | 130 | 47 | 83 | 1.56 | 0.12 | 375.97 | 0.38 |
| C. Alternative matching specification | 240 | 92 | 148 | 0.47 | 0.19 | 59.85 | 0.78 |
| D. Alternative matching method | 1,504 | 156 | 1348 | -0.03 | 0.91 | -2.99 | 0.68 |
| E. Short window (2014-2019) | 249 | 92 | 157 | 0.48* | 0.08 | 61.44 | 0.80 |
| F. Including non-EO firms | 274 | 109 | 165 | 0.44 | 0.14 | 55.29 | 0.76 |
| G. Including sole traders | 225 | 85 | 140 | 0.47 | 0.16 | 59.63 | 0.75 |
| H. Including large firms | 250 | 92 | 158 | 0.58* | 0.05 | 79.43 | 0.79 |
| I. Excluding non-London firms | 165 | 50 | 115 | 0.35 | 0.13 | 72.62 | 0.83 |
| J. Industry specific time trends | 255 | 92 | 163 | 0.57 | 0.18 | 76.84 | 0.83 |
| K. Region specific time trends | 255 | 92 | 163 | 0.49 | 0.21 | 62.48 | 0.83 |
| L. Time placebo | 255 | 92 | 163 | -0.79 | 0.28 | -54.63 | 0.81 |
| M. Outcome placebo | 255 | 92 | 163 | 0.00 | 1.00 | 0.00 | 1.00 |
Note: *, **, and *** indicate statistical significance at the 10%, 5%, and 1% levels, respectively. Number of observations include combinations of year and firms, not unique firms.
Taken together, while turnover estimates are less statistically precise than employment estimates, the evidence points to meaningful positive turnover impacts for Copernicus contract winners, albeit with greater uncertainty due to data limitations. The lack of precision is why these estimates are not presented in the main body of this report. This could be addressed in future phases of the evaluation by drawing on administrative data which may be more complete.
Annex E: Methodology – Willingness-to-Pay analysis
The WtP analysis quantifies the financial value that UK users place on continued UK access to Copernicus data and services. The analysis helps to address the following evaluation question: D1. How does participation in the programme impact data access and usage, beyond free and open access to Copernicus data available to users from non-participating states?
In line with HMT Green Book guidance and relevant precedent in EO valuation, two survey-based approaches were considered:
- Preference estimation: Respondents are asked how much they would be willing to pay to avoid losing access to the Copernicus data.
- Conjoint analysis: Respondents are asked to choose between alternative hypothetical Copernicus offerings. Each option would consist of a EO data offering with different levels of attributes (e.g., timeliness of data) and an associated price.
Following consultation with DSIT and UKSA and initial qualitative engagement with data users, the preference estimation approach was selected due to (i) the lack of a real-world pricing reference point for Copernicus, (ii) data users’ varying ability to interpret technical attributes, (iii) lower burden for respondents to complete, and (iv) the larger sample sizes typically required for robust conjoint analysis.
Survey design and fieldwork
The survey design followed an iterative process informed by qualitative scoping interviews with Copernicus data users, desk research, and consultation with DSIT and UKSA. The questionnaire was drafted, internally tested, refined, and then deployed online using SmartSurvey. Fieldwork ran from November to December 2025 (7 weeks in total). Following survey closure, responses were downloaded and processed for analysis. Each response was reviewed to ensure reliability and correct interpretation of questions, and then cleaned to feed into weighting and extrapolation steps.
The survey was structured into the following sections:
- Background and screening: Identified organisations that had used EO data in the last 12 months and screened out other respondents. This section also supported the collection of basic information on respondents’ roles in the EO value chain, level of EO-related spending, and primary EO use cases.
- Awareness and current use of Copernicus: Respondents were asked about their familiarity with Copernicus, whether they used Copernicus data, which Sentinel missions and Copernicus services they accessed, and through which platforms (e.g., official portals, national mirror sites, cloud-based platforms, or commercial intermediaries). This section also gathered information about the importance of Copernicus data to organisational activities and whether restricted-access Copernicus services were used.
- Value of Copernicus data: Captured respondents’ ranking of Copernicus data attributes (e.g., spatial resolution, geographic coverage, timeliness, ease of access, price). It then asked respondents to state their WtP to avoid (i) a complete loss of Copernicus data access and (ii) specific degradation scenarios affecting data quality or service continuity. Follow-up questions explored how organisations would respond if access to Copernicus data were reduced or lost.
- Future outlook: Gathered information on organisations who were not currently using Copernicus or using alternative EO data sources, including which alternative providers were used and associated annual spending.
- Use of alternative EO sources: Collected organisational characteristics, including sector, year of establishment, geographic location, economic activity, employee size, and turnover band. These variables were used to characterise the respondent sample and construct extrapolation weights.
Construction of WtP aggregate estimates
The estimation of the WtP aggregate estimates followed a structured sequence of steps. These steps are summarised below:
- Step 1: Analysis of WtP survey questions
- Step 2: Converting WtP bands into point estimates (low/central/high)
- Step 3: Reweighting the survey to better reflect the wider-user population
- Step 4: Calculation of weighted average WtP estimate per user
- Step 5: Extrapolating to a sub-set of the UK population of Copernicus data users
- Step 6: Estimating aggregate annual WtP for the UK user population subset
Each of these steps is described in detail below.
Step 1: Analysis of WtP questions
Respondents were asked to state the maximum amount their organisation would be willing to pay each year to avoid losing its current level of access to Copernicus data and services, considering all relevant EO-related spending (e.g., commercial data purchases, processing / licensing, subscriptions). Amongst those participants who answered the headline WtP question, a substantial share of respondents (39%) reported zero WtP, reflecting either limited dependence on Copernicus data or the availability of alternative data sources. However, 61% of respondents indicated a positive WtP, with nearly one-third willing to pay at least £10,000 per year, and around 18% willing to pay £50,000 or more annually.
Figure 8: WtP to avoid losing current level of access to Copernicus data and services
| WtP band | Percentage of respondents |
|---|---|
| Zero | 39% |
| Less than £10,000 | 23% |
| £10,000 – £49,999 | 20% |
| £50,000 – £99,999 | 9% |
| £100,000 – £199,999 | 4% |
| More than £200,000 | 5% |
Source: WtP Survey
Note: Sample size = 56
In addition to complete loss of access, respondents stated how much they would be willing to pay to avoid specific scenarios of degraded data quality or service continuity. These scenarios were designed to reflect plausible counterfactual outcomes under which the UK does not participate in the next MFF.
WtP to avoid degradation of quality of Copernicus data and services
| WtP band | Scenario 1: Reduced geographic coverage | Scenario 2: Lower spatial resolution | Scenario 3: Less frequent/continuous updated | Scenario 4: Lower download allowance | Scenario 5: Lower bandwidth caps |
|---|---|---|---|---|---|
| Zero | 59% | 45% | 48% | 45% | 41% |
| Less than £10,000 | 0% | 0% | 0% | 0% | 0% |
| £10,000 – £49,999 | 13% | 14% | 13% | 9% | 9% |
| £50,000 – £99,999 | 13% | 14% | 5% | 11% | 9% |
| £100,000 – £199,999 | 2% | 7% | 2% | 4% | 2% |
| More than £200,000 | 5% | 5% | 4% | 2% | 2% |
Source: WtP Survey
Note: Sample size = S1: 51, S2: 48, S3: 40, S4: 39, S5: 35
The relative patterns highlight which service attributes users value most. Reductions in spatial resolution and geographic coverage are associated with the greatest values, while lower download allowances and bandwidth caps are comparatively less critical. This indicates that users place particularly high value on Copernicus’ unique data quality and coverage rather than solely on data access conditions.
These valuation patterns align closely with survey findings on the relative importance of Copernicus data attributes, in which spatial resolution and geographic coverage were consistently ranked as the most critical attributes by UK users. This consistency reinforces the interpretation that users’ stated WtP reflects their underlying reliance on Copernicus data quality and continuity.
Step 2: Conversion of WtP bands into point estimates
The survey collected WtP using bands (including a ‘zero’ band). To convert responses into usable WtP values, each band was assigned a low, central, and high point estimate, using midpoints (and bounded assumptions for open-ended ranges). We applied a conservative approach when defining the upper bound value for the “More than £200,000” category. Estimates of value will increase if this upper range is widened.
| Band | Low | Central | High |
|---|---|---|---|
| Less than £10,000 | 2,500 | 5,000 | 10,000 |
| £10,000 – £49,999 | 10,000 | 30,000 | 50,000 |
| £50,000 - £99,999 | 50,000 | 75,000 | 100,000 |
| £100,000 – £199,999 | 100,000 | 150,000 | 200,000 |
| More than £200,000 | 200,000 | 250,000 | 300,000 |
Step 3: Calculation of weights
The survey sample does not perfectly mirror the distribution of Copernicus data users in the wider UK population. To ensure that aggregate valuation estimates are representative of the broader user base, survey responses were reweighted to align the sample more closely with the inferred population of UK Copernicus users.
The Copernicus Data Space Ecosystem (CDSE) 2024 Annual Report provides information on the characteristics of Copernicus data users by organisational sector (e.g., academic and research, private commercial, public sector, non-profit). These sectoral distributions were used as the basis for constructing extrapolation weights. Each survey response was assigned a weight so that, after weighting, the sector composition of the survey sample matches the sector profile of Copernicus data users.
Figure 9: Distribution of survey respondents and population of data users by sector
| Sector | WtP survey | Population of data users |
|---|---|---|
| Academic and/or Research | 72% | 84% |
| Private commercial | 14% | 3% |
| Public sector | 7% | 6% |
| Non-profit organisation / Charity | 4% | 1% |
| Other | 3% | 6% |
Source: WtP Survey, 2024 Copernicus Data Space Ecosystem Annual Report
Note: Sample size = 142
This approach ensures that sectors which are over- or under-represented in the achieved sample do not disproportionately influence the aggregate WtP estimates, improving the representativeness of the valuation results.
Step 4: Calculation of weighted average of WtP estimates per user
Weighted average WtP estimates per user were calculated for (1) complete loss of Copernicus data and (2) for each data quality degradation scenario. For each respondent, point estimates derived from the WtP bands presented in Step 2 were combined with the survey weights constructed in Step 3. The resulting weighted averages represent per-user WtP values scaled to reflect the broader population of UK Copernicus data users.
The results show that users place the highest value on avoiding a complete loss of Copernicus data, with a central WtP estimate of £47,000 per user per year. Among degradation scenarios, lower spatial resolution is associated with the greatest WtP value (£43,000), followed by less frequent updates, lower download allowances and reduced geographic coverage, while reduced bandwidth caps have a comparatively smaller value.
| Scenario | Low | Central | High |
|---|---|---|---|
| Entire Copernicus offering discontinued | £32,000 | £47,000 | £61,000 |
| Scenario 1. Reduced geographic coverage (no UK data available) | £18,000 | £26,000 | £35,000 |
| Scenario 2. Lower spatial resolution (less detail in imagery and products –e.g., <1m up to 10m) | £30,000 | £43,000 | £57,000 |
| Scenario 3. Less frequent and continuous updates (data refreshed less often – e.g., from 1-2 hours to up to 24 hours) | £20,000 | £29,000 | £38,000 |
| Scenario 4. Lower download allowance (reduced data volume allowed to be downloaded per day – e.g., 10-20 GB/day/IP ) | £19,000 | £29,000 | £39,000 |
| Scenario 5. Lower bandwidth caps (reduced download speed affecting bulk data retrieval) | £14,000 | £24,000 | £33,000 |
Step 5: Extrapolation to UK population
The analysis triangulated evidence from multiple sources to estimate the number of UK Copernicus data users, including:
- CDSE dashboard (active UK users based on location. Active users are defined as a user who is both registered and who has performed at least one complete data download within the last 30 days. Excludes users with partial downloads and users who log into their accounts or perform searches via the CDSE GUI).
- CEDA archive statistics (active UK users based on IP address). Active users are defined as those that have downloaded data in the last year. A single person may generate multiple user records, for example by accessing data from different locations or institutional networks, each of which may be identified as a separate user. Country information is assigned based on the IP address from which data access occurs. Where users access data via a VPN, the recorded country reflects the VPN server location rather than the user’s physical location.
- JASMIN platform reporting on UK user.
Figure 10: Distribution of survey respondents by access channel to Copernicus
| Access channel | Percentage of respondents |
|---|---|
| Copernicus official portals (e.g. CDSE, SciHub) | 98% |
| DIAS cloud-based platforms (e.g. CREODIAS, WeKEO, SOBLOO) | 12% |
| National or mirror sites (e.g. CEDA, JASMIN) | 63% |
| Commercial intermediaries | 64% |
Source: WtP Survey
Note: Sample size = 132. Multiple choice.
These sources capture direct access to Copernicus data through official portals and national mirror platforms, but each provides only a partial view of overall user activity. In particular, these figures do not capture organisations accessing Copernicus data through third-party commercial providers (e.g. AWS) or alternative channels (e.g. DIAS cloud-based platforms).
However, survey findings further indicate that only a small proportion of respondents (3%) access Copernicus data exclusively through commercial intermediaries. This suggests that the user statistics used for extrapolation are likely capturing the majority of current UK Copernicus data usage. However, it is also possible that some Copernicus data users who access Copernicus data exclusively through commercial intermediaries may not be aware that they are using Copernicus data, and therefore may not have participated in the survey or may have been screened out during the survey filtering process.
To reflect both the best available evidence and the underlying uncertainty in population estimates, a range of scenarios for the size of the UK Copernicus user population were constructed. In particular, overlap between access channels was handled using information collected through the WtP survey. Survey responses indicate that approximately 60% of CDSE users also access Copernicus data through CEDA and/or JASMIN, implying substantial duplication across platform-based user lists. This overlap rate was applied to adjust counts from CEDA and JASMIN when combining sources, avoiding double-counting of users active across multiple platforms.
The population scenarios are defined as follows:
- Low scenario: Includes CDSE and adjusted CEDA users, after applying the estimated overlap rate (~4,000 active users).
- Central scenario: Combines CDSE users with adjusted CEDA and JASMIN counts after applying the estimated overlap rate (~5,000 active users).
- High scenario: Builds on the central scenario and applies a scalar uplift (1.5x) to account for anonymous CDSE users. According to the 2024 Annual Report, anonymous users almost double the amount of registered users in 2024, however not all anonymous users would download data for use, and some may reflect short-term or one-off visitors (~7,500 active users).
Additionally, data usage statistics measure the total number of active Copernicus users, but multiple users may belong to the same organisation. Survey evidence suggests an average of two Copernicus users per organisation, so user totals were adjusted to produce corresponding organisation-level population estimates.
These scenarios collectively provide a plausible range for the number of active Copernicus data users in the UK, reflecting both measurement uncertainties and uncertainty in user behaviour across access channels.
Step 6: Estimation of aggregate annual WtP estimates
Aggregate annual WtP estimates were produced by combining survey-based valuation results with inferred organisational population counts. For each population scenario, the weighted average WtP, derived from the reweighted survey, was multiplied by the estimated number of UK organisations using Copernicus data. This produces aggregate annual valuations representing the total value that current UK users place on access to Copernicus data and services.
Uncertainty ranges were generated by combining low, central, and high per-organisation WtP values with the low, central, and high organisational population scenarios. This approach yields aggregate valuation ranges for complete loss of access and for each degradation scenario, reflecting uncertainty in both user population size and stated valuation responses.
The table below presents the aggregate annual WtP estimates for complete loss of Copernicus data access and for each degradation scenario. Under the central scenario, UK users’ aggregate WtP to avoid a complete loss of Copernicus data is estimated at £110 million per year, with low and high estimates ranging from £62 million to £217 million.
The share of lost value column expresses the valuation of each degradation scenario relative to the value of the full Copernicus offering. For example, reduced spatial resolution is associated with a 93% loss of total value, while reduced geographic coverage corresponds to a 56% loss of value. Less frequent updates, lower download allowances, and lower bandwidth caps are associated with value losses of between 51% and 62%.
These percentage loss estimates represent the best available approximation of the benefits that UK users derive from specific attributes of Copernicus data and services, and therefore indicate the value that UK data users place on continued UK participation in Copernicus.
Interpretation and limitations
The WtP results reflect stated preferences under hypothetical scenarios rather than observed market transactions. This approach is standard practice for valuing non-market goods such as open-access Copernicus data. However, it is possible that respondents could overstate their hypothetical willingness to avoid a loss of Copernicus data.
Estimates are derived from the subset of UK Copernicus data users reached through the survey and therefore represent the value among known and identifiable user groups rather than the entire universe of potential users.
Population estimates used for extrapolation rely on usage statistics from Copernicus official portals (CDSE) and national or mirror platforms (CEDA and JASMIN), which do not capture organisations accessing Copernicus data through third-party commercial providers (e.g. AWS) or alternative channels (e.g. DIAS cloud-based platforms).
The high population scenario applies a scalar uplift to account for anonymous users recorded in CDSE platform statistics. However, there remains uncertainty around this adjustment, as not all anonymous users necessarily represent distinct active organisations downloading data for use, and some may reflect automated or short-term or one-off visitors. This introduces additional uncertainty into the upper-bound population and valuation estimates.
The analysis also assumes an average of two Copernicus users per organisation when translating user counts into organisational populations. This reflects survey responses.
Annex F: Methodology – VfM analysis
The objective of the VfM analysis is to quantify, where feasible, the annual economic and welfare benefits attributable to UK participation in Copernicus and compare these to the UK’s annual financial contribution to the programme. Given the breadth of Copernicus impacts and data availability at this stage of the evaluation, this interim value-for-money assessment focuses on two quantified benefit channels:
- Downstream welfare impacts for UK organisations using Copernicus data and services; and
- Upstream commercial impacts on UK firms winning Copernicus contracts.
Other potential benefits, including public-sector operational savings, scientific advancement, innovation spillovers, and strategic influence are not monetised at this stage and are therefore excluded from the quantified VfM calculation. The resulting VfM estimate should therefore be interpreted as partial. The VfM assessment follows a structured sequence:
- Step 1: Estimate of the annual public sector cost of UK participation in Copernicus.
- Step 2: Quantify downstream welfare benefits attributable to UK participation in Copernicus.
- Step 3: Explore upstream commercial benefits attributable to UK participation in Copernicus.
Each of these steps is described in detail below.
Step 1. Annual cost of UK participation
The UK has committed £533 million of public investment to Copernicus over a four-year calendar period 2024 – 2027 (2023/24–2027/28). This corresponds to an average annual contribution of £133 million. This annualised contribution is used as the benchmark cost against which quantified annual benefits are compared.
Figure 12: Annual UK Copernicus contributions (£million), 2023/2024 - 2027/2028
| Year | UK Copernicus Contribution (£million) |
|---|---|
| FY2023/24 + FY2024/25 | 125 |
| FY2025/26 | 125 |
| FY2026/27 | 139 |
| FY2027/28 | 143 |
Source: Dataset of annual UK financial contributions to Copernicus provided to the research consortium by DSIT
Note: This chart presents data by financial year. FY 2023/24 and FY 2024/25 data is combined to reflect that the UK rejoined the programme in January 2024.
Step 2. Quantifying downstream welfare impacts
The WtP analysis estimates that UK organisations place a total value of £110 million per year (central estimate) to avoid the complete loss of access to Copernicus data and services, with a range of £62 million (low) and £217 million (high). This represents the total value of Copernicus data to UK users, not yet adjusted for counterfactual access conditions. Under a plausible non-participation counterfactual, UK users would retain access to open-access Copernicus data but would experience degraded access to restricted services, processing environments, and be exposed to potential policy changes regarding open access to Copernicus data. Therefore, only part of total WtP represents additional value attributable to UK participation.
Figure 13: Share of loss value
| Scenario | Share of loss value |
|---|---|
| Scenario 1: Reduced geographic coverage | 57% |
| Scenario 2: Lower spatial resolution | 93% |
| Scenario 3: Less frequent and continuous updated | 62% |
| Scenario 4: Lower download allowance | 62% |
| Scenario 5: Lower bandwidth caps | 51% |
The WtP survey estimates the percentage of total value loss under degraded-access scenarios aligned with this counterfactual. The percentages set out in the figure above represent the share of total Copernicus value that depends on enhanced access and service quality secured through programme participation.
Applying these percentages to the £110 million total WtP yields additional downstream welfare benefits attributable to UK participation in the range of £56 million to £100 million per year. These figures represent the incremental welfare benefit of participation, net of the baseline value of open-access data that would remain available without membership.
Step 3. Upstream commercial impacts
The upstream channel captures economic impacts arising from UK private-sector firms winning Copernicus contracts. The primary quantified outcome is additional employment at contract-winning firms relative to comparable non-winning firms. Calculating economic impacts from both additional employment and turnover would represent double counting.
Dynamic estimates from our QE analysis (reported separately in Annex B) indicate that employment amongst treated firms grows faster than at comparable control firms in the first years following contract award. In particular, employment at treated firms grew 13% faster than controls in the first year, 17% in the second year and 16% in the third year. Effects therefore peak around two years post-award, and remain positive thereafter, although longer-horizon estimates are less precise due to limited post-treatment data.
To express these employment impacts in monetary terms suitable for VfM assessment, the analysis converts net additional employment into net additional gross value added (GVA) using:
- Baseline employment levels of firms active in relevant EO sectors (123 employees);
- The potential number of UK private-sector firms that could win Copernicus contracts; and
- Sector-relevant benchmark productivity metrics (observed GVA per worker of approximately £105,000).
This analysis assumes that not all observed employment gains represent new economic activity for the UK. Some employment effects may reflect labour reallocation from other firms or sectors rather than net job creation. To address this, the monetisation applies an additionality adjustment informed by evidence on labour-market switching patterns in knowledge-intensive and digital sectors.
In particular, a Frontier report for Tech Nation[footnote 5] (using ASHE information) estimates that around 12% of GVA per worker in Sector J (Information and Communications) is produced by additional gains in productivity after accounting for switching patterns.
This adjustment accounts for:
- Deadweight, where some firm growth may have occurred without Copernicus participation; and
- Displacement, where growth in contract-winning firms may partially substitute for activity elsewhere in the UK economy.
There have been 16 contracts awarded to UK firms across 2024 and 2025. Collectively, these two years of contract wins could generate £14.1 million of additional GVA across the economy which corresponds to an annualised benefit of £7.1 million. Therefore, our two impact streams, in aggregate, lead to annualised benefits of £63-107 million relative to the UK’s current annual public sector Copernicus costs of £133 million per year. This accounts for discounting of future benefits and adjusts for inflation. However, this analysis does not account for changes in average contract size, wider non-monetised benefits, even before accounting for wider non-monetised benefits (e.g. UK influence). Some of these additional factors can be explored in Phase 2 of this evaluation. The VfM assessment is partial. The upstream analysis focuses on employment-driven GVA and does not yet capture longer-term productivity, innovation, export, or spillover effects. The downstream analysis captures only identified data users and does not include wider public-sector, scientific, environmental, and societal benefits enabled by Copernicus data.
The Phase 2 VfM evaluation could be broader in-scope and include more benefits arising from contract wins that have actually occurred since UK’s readmission, as well as additional evidence from data users.
About us
know. /nəʊ/v.
to understand clearly and with certainty
know.space[footnote 6] is a specialist space economics and strategy consultancy, based in London and Edinburgh. It is motivated by a single mission: to be the source of authoritative economic knowledge for the space sector.
www.know.space hello@know.space
Frontier is one of the largest economic consultancies in Europe with offices in Berlin, Brussels, Cologne, Dublin, London, Madrid and Paris. Frontier uses cutting edge economics to solve complex business and policy problems, and works with leading private and public sector organisations.
TerraWatch Space is an Earth observation market research and advisory firm providing strategic consulting to government agencies, satellite companies and enterprises and independent market analysis through its flagship newsletter.
Authors: Will Lecky, Alyssa Frayling, Andrew Leicester, Nick Fitzpatrick, Aravind Ravichandran, Luca Niccolai, Eloise Trimingham, Maria Gracia Guijon, Maria Cody, Scott Mackie, Trinity Block, Helen Waghorn, Myrthe Bekkers, Delaney Zaleski
Any enquiries regarding this publication should be sent to us at: copernicus@knowspace.net
-
The UK has committed £533 million of public investment to Copernicus over a four calendar-year period 2024–2027 (FY 2023/24–FY 2027/28), corresponding to an average annual contribution of approximately £133 million. Note that this figure includes the participation fee (~£15 million over the 2024-2027 period). The percentage figure refers to UK contributions to the Copernicus budget, excluding the participation fee. ↩
-
Overall Copernicus budget, and thus membership costs, are anticipated to increase in the next MFF to fund the development of Sentinels (e.g., Sentinels 1, 2, 3 NG Topography, 3 NG Optical, 6 NG and FM2), launch, ground segments and operations, CCMs and their evolutions, and the early development of Sentinel Expansion mission continuity (e.g., CO2M-NG). ↩
-
Where required, we have used ONS yearly currency exchange rates. ONS (2026). Average Sterling exchange rate: Euro XUMAERS. Available from: https://www.ons.gov.uk/economy/nationalaccounts/balanceofpayments/timeseries/thap/mret ↩
-
Frontier Economics. (2023). Tech Nation’s Impactful Initiatives: Evaluating DSIT Funding. Available from: https://www.frontier-economics.com/uk/en/news-and-insights/news/news-article-i20164-tech-nations-impactful-initiatives-evaluating-dsit-funding/ ↩
-
know.consulting ltd. (CRN: 12152408; VAT: 333424820), trading as know.space ↩