Evaluating the impact of British International Investment’s infrastructure portfolio: final report
Published 13 April 2022

© Crown copyright 2022
This publication is licensed under the terms of the Open Government Licence v3.0 except where otherwise stated. To view this licence, visit nationalarchives.gov.uk/doc/open-government-licence/version/3 or write to the Information Policy Team, The National Archives, Kew, London TW9 4DU, or email: psi@nationalarchives.gov.uk.
Where we have identified any third party copyright information you will need to obtain permission from the copyright holders concerned.
This publication is available at https://www.gov.uk/government/publications/evaluating-the-impact-of-british-international-investments-infrastructure-portfolio/evaluating-the-impact-of-british-international-investments-infrastructure-portfolio-final-report
Authors: René Kim, Zoë Sutherland, Sofie Verhoeven, Silvia Binet, Niclas Düring, Chris Barnett, Alberto Lemma and Leonie Beckmann.
Acknowledgements
This study was undertaken between September 2020 and November 2021.
The evaluation team would like to thank Suzanne Parkin (FCDO), Alex MacGillivray (BII), Zahir Dasu (BII) and the FCDO-BII Evaluations Steering Committee for their oversight and guidance throughout Phase 1 of the evaluation. We are also grateful to all of those who contributed to this analysis through interviews and consultations, with particular thanks for Pri Uttamchandani and Alar Cartan at BII for their input.
Disclaimer
This report has been prepared by the e-Pact consortium for the named client, for services specified in the Terms of Reference and contract of engagement. The information contained in this report shall not be disclosed to any other party or used or disclosed in whole or in part without agreement from the e-Pact consortium. For reports that are formally put into the public domain, any use of the information in this report should include a citation that acknowledges the e-Pact consortium as the author of the report.
This confidentiality clause applies to all pages and information included in this report.
This material has been funded by UK aid from the UK government; however, the views expressed do not necessarily reflect the UK government’s official policies.
‘Itad’ and the tri-colour triangles icon are a registered trademark of ITAD Limited.
Recommended citation
Kim, R., Sutherland, Z., Verhoeven, S., Binet, S., Düring, N., Barnett, C., Lemma, A., and Beckmann, L. 2022. Final Report: Evaluating the Impact of British International Investment’s Infrastructure Portfolio. e-Pact consortium: Itad, Steward Redqueen, Overseas Development Institute.
From 4 April 2022, CDC changed its name to British International Investment (BII).
Foreword
The Rt Hon Amanda Milling MP, Minister for Asia and the Middle East in February 2022

I am pleased to introduce this report, an independent portfolio-wide analysis of British International Investment’s (BII) investments in this sector, which provides a unique insight into BII’s infrastructure portfolio, published as part of the FCDO-BII Evaluation and Learning Programme.
Sustainable infrastructure is crucial for development. From transport systems to power generation facilities and water and sanitation networks, it provides the services that enable society to function and economies to thrive. The UK is committed to financing and delivering clean infrastructure that is reliable and honest, avoiding low and middle-income countries being left with bad and unsustainable debt.
The insights gleaned from this study reveal the scale and breadth of BII’s impact through its infrastructure investments across Africa and Asia. To date, across the portfolio, BII’s investments have reached 152 million consumers, or the equivalent of one in every twenty people living in Africa and South Asia; supported 3.5 million jobs (indirectly), and investments in renewable energy have contributed to 16 million tonnes of CO2 avoided.
It is very encouraging to note that the majority of BII’s investments are on track to deliver their intended impact. The evaluators have also highlighted several important recommendations for how BII can further enhance and understand the impact of their portfolio so that BII achieves an even stronger development impact.
Britain’s premier development finance institution was revamped as British International Investment (BII) in November 2021, with the official name change taking place on 4 April this year, and the launch of its new strategy from 2022-26. A critical part of BII’s new strategy is the vital importance of infrastructure in bringing large scale impact to enable business growth and benefit millions of people. This review provides an important and timely analysis of the impact of BII’s current investments in this sector. This not only provides accountability to the taxpayer for what has been achieved with the UK Government equity but also it provides important lessons for BII to deepen its impact as it embarks on its new five-year strategy.
Building on its portfolio of £5.2 billion BII’s new strategy will see it enter new markets in the Indo-Pacific and the Caribbean and form new partnerships with likeminded investors. I am confident that it will take on board the recommendations highlighted in this report, whilst also building on its experience to finance the critical infrastructure that will allow all countries to build back better. One such example is the recent partnership with DP World that will support the initial development of three ports across Africa with further logistics investments to follow. Trade enabled through the three initial ports will improve access to vital goods for 35 million people, support 5 million jobs, and add $51 billion to total trade by 2035.
BII will be central to the UK’s aim to deepen economic, development and security ties globally and bring more countries into the orbit of high-standard free-market economies, while delivering jobs and growth in both the developing world and the UK. BII will also continue to play a crucial role in delivering the UK’s commitments at COP26 to help developing countries take advantage of clean technology and grow their economies sustainably to meet the Paris Agreement.
I wish to thank the independent evaluators at Itad, Steward Redqueen, AidData and the Overseas Development Institute (ODI) for their work and look forward to overseeing this next phase of British International Investment.
The Rt Hon Amanda Milling MP, Minister for Asia and the Middle East
Acronyms and abbreviations
| Acronym | Definition |
|---|---|
| BI | Business Integrity |
| BRT | Bus Rapid Transit |
| C&I | Commercial and industry |
| CO2 | Carbon dioxide |
| DFID | Department for International Development |
| DFI | Development Finance Institution |
| DI | Development Impact |
| E&S | Environmental and Social |
| ESG | Environmental, Social and Corporate Governance |
| ESMS | Environmental and Social Management System |
| FCDO | Foreign, Commonwealth & Development Office |
| FTTH | Fibre-to-the-home |
| GDP | Gross domestic product |
| GHG | Greenhouse gas |
| GIIN | Global Impact Investing Network |
| GNI | Gross national income |
| GW | Gigawatt |
| HFO | Heavy fuel oil |
| ICT | Information and communications technology |
| IFC | International Finance Corporation |
| IMF | International Monetary Fund |
| IPCC | Intergovernmental Panel on Climate Change |
| IPP | Independent power producer |
| LCOE | Levelised cost of energy/electricity |
| MT | Metric tonne |
| MW | Megawatt |
| OECD | Organisation for Economic Co-operation and Development |
| PCAF | Partnership for Carbon Accounting Financials |
| PPA | Power Purchase Agreement |
| PPI | Private Participation in Infrastructure |
| SME | Small and medium-sized enterprise |
| T&D | Transmission and distribution |
| TA | Technical assistance |
| UNFCCC | United Nations Framework Convention on Climate Change |
Executive summary
Introduction and scope
The Foreign, Commonwealth & Development Office (FCDO) commissioned Itad, Steward Redqueen and the Overseas Development Institute (ODI), to evaluate British International Investment’s (BII) [footnote 1] investments in the infrastructure portfolio. The objective of this evaluation is to achieve a better understanding of the development impact (DI) of BII’s infrastructure portfolio. The analysis covers all current BII debt and equity investments in the infrastructure portfolio [footnote 2] and exits since 2011, and the underlying holdings of 15 infrastructure-focused funds that are in the core geographies of Africa and South Asia. Infrastructure assets held by generalist funds are not included in the analysis presented.
The first phase of this evaluation consists of a Portfolio Review and an Evidence Review, both of which are covered in this Formal Evaluation Report. The second phase will consist of a series of in-depth studies.
Methodology
This report synthesises the results of an Evidence Review and a Portfolio Review. In the Evidence Review, insights from existing literature and sources are summarised and, where possible, amalgamated into provisional evidence rules that allow estimation of ultimate impacts. In the Portfolio Review, information contained in available BII investment documents has been collated to form a single database of investee observations, to which data from 16 external sources has been added.
Where no direct observations were available, estimations of ultimate impacts per investment were made using evidence rules (developed from the Evidence Review) in combination with portfolio and external data. Analysis of outcomes and impacts achieved by the investments on this basis are included at portfolio level and thematically in this report. The non-financial value added that BII provides to its investees is captured through a high-level inventory of its activities in the areas of Business Integrity (BI), Environmental, Social and Governance (ESG) and Technical Assistance (TA) (BII Plus). Based on the observed and estimated impacts, we draw conclusions and recommendations on the first phase of the evaluation of the infrastructure portfolio. These findings are also a starting point for the second phase, in which BII aims to deepen its understanding of interventions in different sectors, countries and thematic areas.
Portfolio overview
Infrastructure currently makes up 28% of BII’s active portfolio. This Portfolio Review encompasses 14 direct equity investments, 25 direct debt investments and 15 infrastructure-focused fund investments. This scope covers US$2,345 million – of which US$1,743 million is in direct investments and US$602 million is in infrastructure fund investments – that BII has invested in infrastructure since 2007. In total, the 194 investee companies manage 295 assets. As per 31 December 2020 [footnote 3], a total of US$2,146 million [footnote 4] is still active. Total infrastructure commitments are US$3,352 million, of which US$1,936 million goes to direct investments and US$1,416 million goes to infrastructure funds. This scope excludes 54 investments that were made through 38 generalist funds with aggregate disbursements of US$157 million. Over the past 6–7 years, BII has substantially grown its infrastructure portfolio, primarily through direct investments. Below are some portfolio characteristics:
- in terms of sectors, by value, 70% of the portfolio is in Power, 22% in Information Communications Technology (ICT) and 8% in Transport. In Water, Sanitation and Hygiene (WASH), only one direct investment has been made but the sector is a strategic priority going forward
- in terms of regions, 66% of BII’s capital has been disbursed in Africa and 34% in Asia. Ten countries constitute 75% of disbursed capital. In six of those, BII has invested in two or more sectors
- in terms of investment product, 43% of the infrastructure portfolio is direct equity, 31% is direct debt and 26% is invested through infrastructure funds
Evidence Review
The Evidence Review identified over 450 studies through systematic online searches, of which 331 were of sufficient quality to be included. The strength of the evidence is rated based on the number of studies. Evidence rules were distilled where quality and homogeneity of evidence allowed it. In total, 22 evidence rules translate impact pathways into quantitative impacts, of which six were applied to investments in the BII portfolio [footnote 5]. They were used when there was not a more appropriate existing estimation methodology, and when the necessary BII monitoring data was available.
With reference to the BII Infrastructure Impact Framework, the evidence base is stronger for ultimate impacts and for some impact pathways than it is for outcomes. There is strong evidence linking infrastructure investments to four of the results in the impact framework (greater productivity, economic opportunity, standard of living and environmental sustainability) – three at ultimate impact level and one at outcome level. The evidence for these indicated a positive relationship between the investment and the result. There is more evidence available at outcome level for the Transport sector than for other sectors.
Development Impact across the portfolio
Portfolio aggregate development impact
By combining investment data, external sources and six evidence rules (see Section 4), we have estimated the aggregate outputs, outcomes and impacts of the BII portfolio across the infrastructure impact framework. Impacts have been estimated individually for all 295 assets in BII’s portfolio based on the development results of the investees. This does not account for BII’s contribution to investees’ results, and some large impacts are associated with small BII investments in which BII has a small effective stake. Across the portfolio, BII investees covered by the scope of this report [footnote 6]:
- reach 152 million consumers, or one in every twenty people living in Africa and South Asia
- support 3.5 million indirect [footnote 7] jobs, which is roughly equivalent to the working population of the Kampala metropolitan area
- generate US$17.6 billion of value added annually (i.e. contribution to GDP) [footnote 8], which is about the same as the GDP of, again, Kampala’s metropolitan area
The distribution of these impacts (portfolio total, not adjusted for number or size of investees, or BII attribution) [footnote 9] is largely in line with BII’s geographical and sectoral allocation. In summary, in terms of jobs supported and GDP impact:
- 65% of the impact comes from investees located in Africa
- 65% comes from fund investee companies [footnote 10] and 35% from direct investments [footnote 11]
- 50% of the impact of direct investments comes from equity investments and the remainder from debt
- 55% of the impact will come from greenfield and brownfield expansion projects once they become operational
- 55% of the impact comes from the power sector with the independent power producers (IPP) sub-sector being responsible for some 95% of the impact within the power sector [footnote 12]
- 40% of the impact of IPPs comes from renewable technologies
Portfolio impact pathways
The most frequent impact pathways in the portfolio are the provision of additional capacity, improved service delivery and reduced prices. IPPs that provide lower-cost energy than the average countrywide generation make the largest contribution to these pathways. Furthermore, BII’s investees reach an estimated two million households by providing connections to electricity and broadband [footnote 13]. BII contributes to the provision of cleaner capacity through investments in renewable energy assets, and it increases resource efficiency through the lowering of power distribution losses in its transmission and distribution (T&D) portfolio. Finally, climate smart infrastructure is an additional impact pathway part of BII’s infrastructure impact framework. However, no consideration linked to the climate resilience of the infrastructure assets was identified in the portfolio.
Performance against the DI thesis
The evaluation team has assessed the extent to which BII investments are on track to realise the DI thesis that was set at the time of making the investment. Almost all of the 39 direct and 15 fund investments [footnote 14] have been evaluated against their respective DI theses based on whether they: (i) had achieved the impact targets (within a reasonable range) as articulated in the DI thesis; and (ii) had a reasonable chance to reach the intended targets given the amount of time remaining until the intended DI target date.
Excluding nine investments which were too early to assess, 36 out of 45 investments (80%) are on track or have outperformed their DI thesis (with two excellent scores). One of the nine investments that is not on track is judged to be a failure. In aggregate:
- investments in Asia score better than in Africa: all nine underperforming assets are located in Africa, while five investments there have over-performed. In Asia, five of the fifteen investments are above expectations or excellent, and the remaining ten are as expected
- in summary, most Power investments are on track; seven are below expectations, two are above expectations, one is excellent, and the remaining ten are in line with expectations
- ICT investments score better than power investments: six are as expected, while two are above expectations
- transport investments show most variation: there was one failure, one above expectation and one excellent
- debt investments largely perform in line with expectations (13 out of 19), with five below and one above expectations. The performance of equity investments in contrast is much more heterogeneous, ranging from a single failure to two excellent ratings
- the 14 fund investments show little variation: one is below expectations, eight are as expected and five are above expectations
- given the long lead times of many infrastructure investments, it is too early to discern a clear trend over time: pre-2018 and post-2018 investments largely score the same
It seems that both under-performance and over-performance are mostly driven by internal factors like strategic fit and implementation skills. External macro-economic, geopolitical, and regulatory factors do explain some of the observed under-performance, especially in Africa.
BII’s value addition activities
Because of the importance of BI and ESG aspects, especially in infrastructure, the report provides an overview of BII’s value addition activities, which is the second pillar of BII inputs besides capital. This pillar also includes value addition through technical assistance and support provided via BII Plus. Because the nature of these interventions is very investment specific, an evaluation of their effectiveness is beyond the scope of this Portfolio Review. BII’s main activities in these are as follows:
- the BII risk-based BI due diligence process was performed for all 39 direct investments. For 30 of these, BII’s BI team undertook more in-depth interventions to support investees. For funds, the main value-adding activities included annual BI reporting, training, ad hoc advisory and routine monitoring
- the BII ESG due diligence process was performed for all 39 direct investments and for 23 of these a more detailed process was conducted. Deal-specific interventions were made in nine investments. For funds, the focus was on improving environmental and social management systems (ESMS)
- ten investee companies in the home solar and C&I sub-sectors received technical assistance worth US$1.25 million. A similar amount went to the support of impact opportunities beyond BII’s portfolio
Portfolio evaluation based on themes
Theme 1: Geography
As referenced above, ten countries constitute 75% of all investment in the infrastructure portfolio, and six countries have substantial investments in two or more sectors. Ten countries make the greatest contribution to BII’s aggregate employment and GDP impact: India, Nigeria, Cameroon, South Africa, Côte d’Ivoire, Gabon, Kenya, Uganda, Bangladesh and Nepal.
BII has categorised the African countries and Indian states into four categories. ‘A’ countries/states are the hardest to invest in, and ‘D’ countries/states are the easiest. More than half (53%) of BII’s investment is in A/B countries [footnote 15]. The share of GDP and employment impact of investee companies in A/B countries is 44% and 56% respectively, in line with the higher employment intensities in poorer countries. In terms of people reached, 65% are in A/B countries. Relative to the size of the country, BII investee companies make the largest impact contribution in Gabon, Cameroon, Ghana, Côte d’Ivoire and Uganda.
Theme 2: BII contribution to private infrastructure investment
Using data from the World Bank Private Sector database, we have determined BII’s relative contribution to private sector infrastructure (PPI) investment in all countries. Despite it being the largest destination of BII infrastructure investments, the sheer size of India renders BII’s relative contribution small (0.1% of private sector infrastructure investment). Conversely, BII plays an outsized role (around 10%) in Uganda and Cameroon.
BII’s relative contribution to private infrastructure investment tells only half the story. In general, more than 80% of private infrastructure investments in emerging markets come in the form of debt, whereas 69% of BII’s capital is direct equity or equity through fund investments. This observation is important from a development impact perspective. Whereas debt finance is typically used to finance the construction and operation of assets, equity investments are needed for the early and late development stages of projects; they are inherently riskier and require more intensive engagement from Investment Managers. In many emerging markets, and especially in Africa, the infrastructure gap is caused more by a lack of projects that can be financed than by a lack of finance. BII’s willingness to invest in the earlier development stages is therefore a significant source of development impact and demonstrates a willingness to take risks that other development finance institutions (DFIs) might not.
Theme 3: How BII targets investments by country needs
Countries differ widely in terms of their most pressing infrastructure needs in ways that are not adequately captured by the DI grid score that BII has used to rate investments since 2012. To evaluate how effectively BII has targeted these needs, we inferred the relative need of a country for a particular type of investment by ranking the country’s performance on indicators that are closely associated with that type of investment. All investments are subsequently grouped into quintiles based on their performance in the country on the chosen targeting indicator. It is worth noting that all countries in which BII is mandated to invest are already identified as being of greater need and that, therefore, this is an additional analysis of comparative need within the investment universe. Relative needs cannot always be inferred from country statistics, especially when the local context is important.
Power and ICT investments cover all quintiles, from large to relatively smaller requirements. However, Transport investments are mostly based in countries where the need for them is smaller. Given the substantial investments in power, and to a lesser extent ICT, that are made in countries that are in the first and second quintile of greatest need, we judge BII’s investment targeting for these sectors as reasonably effective from a DI perspective. Transport investments could be better targeted to include countries of greatest need, although the local context is often more important (especially for roads). The method presented here could be adapted to help BII more clearly target areas with the greatest need, while acknowledging that not all public needs can be resolved by the private sector.
Theme 4: Climate
Over time, BII’s Power portfolio has been evolving towards renewable energy. About 48% of BII’s active IPP portfolio is in renewable energy.
Annual greenhouse gas (GHG) emissions of active operational IPP investments amount to 13.7 million tonnes CO2 equivalent. The emissions avoided by direct IPP investments are estimated by BII at 4.8 million tonnes. Including indirect investments, we estimate emission avoidance related to renewable IPPs to increase up to 13.7 million tonnes CO2 equivalent [footnote 16].
The bulk of emissions of the active portfolio comes from fund investments made before 2013, whereas most avoided emissions come from renewable investments made since 2015. This underscores the shift towards renewables. Using the attribution rules of the BII-signed Partnership for Carbon Accounting Financials (PCAF), BII-attributed GHG emissions and avoided GHG emissions have been calculated at 1.3 million and 0.5 million tonnes, respectively.
Theme 5: Attribution
The above-mentioned capital-based PCAF methodology can also be used to calculate the BII-attributed economic opportunity and standard of living impact. Based on this method, 13%-20% of the cumulative impacts of investees can be attributed to BII. This includes:
- 30.3 million of 152 million people reached by investees
- 515,000 of 3.5 million jobs supported by investees
- US$2.3 billion of US$17.6 billion of investees’ value added annually (i.e. contribution to GDP)
Using these attributed numbers, we can estimate the effectiveness per dollar of BII investment. We estimate that US$1,000,000 of BII infrastructure investment would support 156 jobs (ongoing while BII is invested) as well as US$1,000,000 of value added annually (i.e. contribution to GDP) [footnote 17] or equivalent to US$5 million in the case of a five year BII holding. This estimation indicates that each dollar invested by BII returns itself in the form of value added to the host country in just over one year.
Theme 6: Gender
Since 2018, BII has made a strong commitment to women’s economic empowerment, integrated gender into its work as a key cross-cutting area, and taken a leadership role in the 2X Challenge. However, across both BII’s internal data and the Evidence Review, there is relatively little evidence on how infrastructure investments lead to specific outcomes and impacts for women and men who are affected by the infrastructure itself. This does not suggest that infrastructure investments do not have a positive effect on women; the absence of evidence likely relates to the methodological challenges of establishing actual uptake of infrastructure services by individuals and therefore of assessing the impacts on affected individuals’ standard of living.
Based on the 25% of direct and indirect infrastructure investees that report on it, we estimate that direct women’s employment is about 15%, although this increases for solar home system investments based on reporting from three investments. There are six additional gender-related indicators that concern investees’ own operations, against which between 21% and 27% of direct infrastructure investees report. However, there are no gender indicators that are both systematically reported against across the infrastructure portfolio, and that relate to impact pathways, outcomes or ultimate impacts in the impact framework. Additionally, gender does not appear on the impact framework itself.
Four investee companies are qualified with the 2X Challenge criteria, with a further three investees having set gender targets, or developed programmes to improve women’s employment. BII has provided technical support to some investees to meet gender objectives and targets.
Recommendations
The following recommendations are made based on the implications of the high-level findings and are presented in the same order as the high-level findings (in Section 7.2) to which they relate. They focus on BII activities to measure and manage development impact within the infrastructure portfolio:
- BII could regularly update the Evidence Review with emerging evidence and the resulting evidence rules that have been extracted from the Evidence Review. We recommend that BII observes caution in the application of evidence rules, which are more appropriately used across the portfolio rather than at individual investment level.
- We suggest that BII annually reviews portfolio impact data and the extent to which external factors have changed, as well as the associated implications on the actual development impact.
- We propose that BII determine in which countries it has substantial influence, and how it might use that influence to maximise development impact. For a limited number of countries this could lead to a ‘country development approach’ document.
- In identifying and prioritising its potential for development impacts, we suggest that BII reconsiders how it determines the areas of greatest needs for the different types of infrastructure to inform its investment decision-making.
- We recommend that BII continuously determines how best to navigate the nexus between development impact and a Paris-aligned net zero pathway. BII uses its Guidance Note on natural gas investments. Because country installed stock, available technologies and cost levels of IPPs, T&D networks, country interconnections, electricity storage, and decentralised and off-grid solutions continuously change, so should BII guidance on these matters.
- We propose that BII formalises its approach to impact attribution and collects the necessary data from its investee companies. A first step could be to apply the PCAF methodology used for GHG emissions.
- We recommend that BII increases its active monitoring and management of the gendered outcomes and impacts of its infrastructure portfolio. We recommend an increased focus on collecting and using gender-disaggregated results data across investments that relate to the impact pathways, outcomes and/or ultimate impacts of the impact framework.
1. Introduction and scope
1.1. Background to the report
The Foreign, Commonwealth & Development Office (FCDO) commissioned Itad, Steward Redqueen and the Overseas Development Institute (ODI) to evaluate British International Investment (BII) [footnote 18] investments in the infrastructure portfolio. The purpose of this evaluation is for BII and FCDO to achieve a better understanding of the development impact (DI) of BII’s infrastructure portfolio. The principal evaluation objective is to generate findings, recommendations and learning on how, and in which contexts, BII’s investments into infrastructure deliver development outcomes and impact on people, environmental sustainability and, where feasible, overall economies.
‘Infrastructure’ encompasses a wide range of physical structures and networks that constitute the backbone of an economy. No country has ever achieved growth without it, and it makes important contributions to individuals’ standards of living [footnote 19] as well as the ability of countries to transition to a lower carbon economy. This makes the sector highly relevant from a DI perspective.
This report includes an analysis of BII’s infrastructure portfolio, which is divided into four sectors: Power; Information Communications Technology (ICT); Transport; and Water, Sanitation and Hygiene (WASH) in South Asia and Africa [footnote 20]. This report brings together the analysis conducted in Phase 1 of the evaluation, in particular a detailed analysis of the DI of the BII infrastructure portfolio, drawing upon BII’s own data and supplemented by extensive external data sources (a Portfolio Review), and a review of published literature on the DI of infrastructure investments (the Evidence Review). The subsequent second phase will consist of a series of in-depth studies.
1.2. Structure of the report
This report covers the following sections:
- Section 1: introduction and scope of the report, situating this Formal Evaluation Report within the context of the two-and-a-half-year evaluation
- Section 2: a brief overview of the methodology applied
- Section 3: an overview of the infrastructure portfolio composition
- Section 4: a summary of the results of the Evidence Review against the BII Infrastructure Impact Framework, including an outline of how the external literature was used to provide quantitative estimates of impact that were applied as ‘evidence rules’ in the Portfolio Review
- Section 5: an overview of results against the BII Infrastructure Impact Framework in terms of ultimate impacts and impact pathways, the assessment of investments’ performance against their DI theses, and a summary of BII’s value addition activities in areas of Environmental, Social and Corporate Governance (ESG), Business Integrity (BI) and BII Plus
- Section 6: analysis of the results of the Portfolio Review by theme, according to: geography, contribution to private infrastructure investment, targeting by country needs, climate, attribution of results, and gender
- Section 7: summary of findings and recommendations based on Phase 1 of the evaluation
2. Methodology
Summary
- this Evaluation Report concludes Phase 1 of the British International Investment’s (BII) infrastructure portfolio evaluation. The subsequent Phase 2 will focus on several deep-dive studies, which are yet to be determined.
- Phase 1 consists of a Portfolio Analysis and an Evidence Review
- from the Evidence Review we have extracted several evidence rules which have been used to estimate the impact of all investee companies and assets
- all direct and fund investments have been scored against their corresponding Development Impact Thesis.
- BII investee data has been used in combination with data from 16 external sources and the evidence rules, to determine the ultimate impact of the portfolio
- additional analysis has been performed for six themes
This evaluation consists of three phases: the Inception Phase, Phase 1 and Phase 2, each of which are designed to build upon the last phase, so as to incrementally develop the evidence base for the development impact of British International Investment’s (BII) infrastructure portfolio. Phase 1 draws on BII’s own data, external data sources and published literature, to establish the existing data and strength of the evidence related to the development impact of BII’s investments into infrastructure at portfolio level. Phase 2 will comprise a series of in-depth studies into specific investments (or clusters of investments) and the synthesis phase. It will include primary data collection, and will contain a greater depth of analysis into sampled investments.
Phase 1 comprises a Portfolio Analysis and Evidence Review. These two activities were designed on the same detailed and sector-specific versions of the BII Infrastructure Impact Framework. The Evidence Review research was focused on areas in which BII invests currently, or areas in which it intends to invest, in order to maximise synergies and opportunities to synthesise results between the two reviews. This report presents the analysis, conclusions reached and recommendations developed during Phase 1.
This methodology section consists of three sub-sections associated with the three main sets of analysis within Phase 1, the analysis of portfolio composition (as per Section 3), the Evidence Review (as per Section 4) and the analysis of development impact (as per Sections 5 and 6). The first sub-section explains how the overall portfolio composition analysis was conducted. The second sub-section outlines how evidence was searched for, reviewed and analysed in the Evidence Review. The third sub-section explains how data was collated and analysed to generate observed or modelled results of BII investments against the BII Infrastructure Impact Framework, and how the team assessed the performance of investments against DI theses.
2.1. Methodology for portfolio composition analysis
The Portfolio Review assesses the aggregate development impact of BII’s infrastructure portfolio by analysing BII data and documentation, the inclusion of relevant external data sources and through interviews with BII staff.
BII provided a dataset of all investments made that are within the scope of this evaluation, and this was analysed at the asset level. In total, the 194 investee companies manage 295 distinct infrastructure assets. These figures do not include the 54 investments that were made through 38 generalist funds. The variables in the dataset provided by BII included the country of operation of the investments, commitment and disbursement data, instrument type and investment status, as well as BII’s effective interest in the investment (for some fund investments). Additional sheets were provided with the number of direct jobs, and the percentage of those which are held by women (for a limited sample of investments). Additional data points were extracted from 652 Investment Committee papers, quarterly portfolio reviews and other investee-specific sources. The data was reviewed by the evaluation team and went through a fact-checking process with the relevant Investment Managers and the DI team. This dataset was used to conduct the analysis of portfolio composition presented in Section 3.
2.2. Evidence Review methodology
The Evidence Review used a modified rapid evidence assessment approach, which is a combination of rapid search and assessment of studies. The Evidence Review team developed search strings based on a detailed analysis of how the BII Infrastructure Impact Framework could be applied to each of the four sub-sectors: Power, Transport, ICT and Telecoms and WASH. The breadth of the Evidence Review was determined by the composition of BII’s portfolio, focusing on the types of investments that were most prevalent in BII’s dataset – and the expected results of those investments – using the impact framework.
The initial screening identified over 450 studies through systematic searches using Google and Google Scholar, applying the described search strings. These studies were subsequently reviewed for quality and relevance [footnote 21]. All publications that were made accessible through these searches (using the search strings) were included in the initial screening. This included journal articles and publications by multilateral development banks, development finance institutions (DFIs) and consultancies. The extent of the search process was determined by the resources available for the Evidence Review and is considered to be a comprehensive review of the available evidence, albeit not a comprehensive review of all published studies.
Following this, over 330 studies were included in the evidence base. The review also used existing studies (e.g. Eberhard and Dyson, 2020) for reference and for snowball search purposes. The Evidence Review then rated the evidence strength for each type of infrastructure impact on a strength rating which was based on number of studies conducted for each impact per infrastructure type. The direction of impact is based on the conclusion reached by the majority of the studies; if there was no clear majority then the evidence is deemed inconclusive. The strength of this approach is based on the breadth of the different studies that were included. The disadvantage is that it does not consider the differences in quality between the studies that passed the minimum quality threshold.
Developing evidence rules
The Evidence Review was also used to identify quantitative measures that would translate investment sums into estimated impacts. While reviewing the evidence, the team extracted data from high and medium quality studies that quantified the relationship between two variables. From a triangulation of these study results, we developed ‘evidence rules’ which could be applied to the BII’s portfolio to estimate outcomes and impact of BII investments based on sound external evidence. An overview of the evidence rules can be found in Section 3.
All evidence rules are based on a limited number of studies and mask a considerable degree of heterogeneity and different contexts. Each ‘rule’ is an estimate based on the available evidence rather than a rule per se and should be corrected when further and better evidence becomes available. Their application is meant to provide some guidance for where the portfolio stands in terms of ultimate impacts because in-depth studies are not possible for most assets.
2.3. Methodology for analysis of development impact across the portfolio
Analysis of achievement of DI across the portfolio, by theme and by sub-sector
To analyse the achievement of DI, the evaluation team used the dataset provided by BII, which was complemented by the data points extracted from the BII documentation that was reviewed (as described in Section 2.1), to which the team added further data from 16 external data sources. This expanded dataset was used to generate quantified estimates of the achievement of outcomes and impact across the BII infrastructure portfolio.
The external data sources used were: World Bank Development Indicators (WB-DI), World Bank Enterprise Survey (WB-ES), World Bank Private Participation in Infrastructure (WB-PPI), Population Reference Bureau, IRENA, Energy Information Administration, International Energy Agency, Lazard, IPCC, GSMA Mobile Connectivity Index, International Telecommunication Union, UNCTAD, WHO/UNICEF and Tower Xchange.
Use of external data sources in the analysis conducted against the BII Infrastructure Impact Framework
The evaluation team used the results of the above analysis and the evidence rules from the Evidence Review and the Joint Impact Model (https://www.jointimpactmodel.com [footnote 22]), to quantify the contribution of BII investees to impact pathways, outcomes and ultimate impacts in the impact framework. While macro-economic quantities like GDP contribution and employment can be inferred, it was not possible to get a detailed understanding of the end users that benefitted from the added infrastructure capacity. We plan to look at this more closely in an in-depth study by surveying consumers directly. For the largest sector, IPPs, we have expressed the (expected) power generation in the number of consumers that are reached, using residential power consumption as a fraction of the total power use and country-specific data on the average residential power use per capita.
The aggregate figures presented in Section 5.1 and 5.2 are either direct observations or modelled figures, obtained by combining investment data, external sources and six evidence rules (Table 2, Section 4.3). At the impact pathways level, figures are mostly collected from the latest available quarterly portfolio reports, supplemented by publicly available sources, and aggregated across sub-sectors. In addition, for three of the impact pathway indicators [footnote 23] results are estimated using country-specific data on the existing power generation stock to provide a more comprehensive picture beyond the data available in the investment documentation. At the outcome level, data is scarce, and the literature provides little evidence on the correlation between the impact pathways and expected outcomes. At the ultimate impact level, five out of the eight indicators are modelled [footnote 24].
Assessing performance against the DI thesis
The evaluation team assessed the extent to which BII investments are on track to achieve the goal of the DI thesis set at the time of making the investment. DI theses exist for all investments made since 2018 and for several investments that were made prior to 2018. Where DI theses did not exist, some were retrofitted by BII. For the pre-2018 investments where no retrofitted DI theses were available, the evaluation team distilled proxy DI theses based on the contents of the Investment Committee paper. The assessment uses the dataset described above. Interviews were also conducted with each Investment Manager to capture contextual information for each investment which was used to inform the assessment of its performance against the DI thesis.
Some 37 direct investments and 15 fund investments have been evaluated against their respective DI theses based on the extent to which they had reached the targets specified in the DI theses and whether they had done so in time. An investment is scored as excellent when it achieves more than 115% of its DI target and if it does so ahead of its target date (or the latest date in case of a range). An investment is scored as below expectations if it reaches less than 85% after its planned target date.
Table 1: DI performance scoring table
| Performance against target | Target reached after target date | Target reached before target date |
|---|---|---|
| > 115% | Above expectations | Excellent |
| > 85% and < 115% | As expected | Above expectations |
| < 85% | Below expectations | Too early to tell |
Some adjustments were made to this methodology to allow for COVID-related delays, where a DI thesis included more than one target, assessment at fund level (rather than asset level), and where an investment was exceptional in generating other impacts in its context or whether it was likely to achieve the aims of the DI thesis in reasonable amount of time. These adjustments were made based upon the review of data, documentation and based on discussions that were had with the evaluation team to ensure consistency in the application of the approach and to minimise the potential for subjectivity. The assessments and underpinning data points were shared with the BII investment teams, who provided additional information or updated data where it was relevant to do so, and which was taken into account in a revised analysis of each investment. Based on investment documentation and interviews with Investment Managers, a high-level analysis was conducted into the internal and external factors that explained the under or over-performance of investments. The aggregate results of the assessment of performance against DI theses are included in Section 5.3.
The evaluation team also captured a high-level inventory of BII’s non-financial value-added activities for the infrastructure portfolio in the areas of BI and ESG. The effectiveness of these activities has not been assessed in this evaluation.
Use of external data sources in the analysis by theme
The relative contribution to employment levels and the GDP of BII investees in the various countries has been determined by using the disaggregated ultimate impact results, broken down by country and then divided by the country’s labour force and GDP. The results are shown in Section 6.1.
The assessment of BII’s relative contribution to infrastructure investments made by the private sector in all the relevant countries, uses BII total infrastructure disbursements by country, divided by the total value of private sector infrastructure investment from the World Bank database. The results are presented in Section 6.2.
The assessment of BII targeting has been performed by identifying targeting indicators that were relevant for each sub-sector. For this analysis, we selected indicators that were (i) directly related to the nature of BII investments and DI theses; and (ii) for which comparable data is available across all the eligible countries. External data sources have also been used to establish the existing infrastructure, stock and services available in each relevant country. In most cases, the indicators that were used for the assessment of targeting, were the same as those that were used for the targeting analysis. The evaluation team then quantified the contribution of BII investees to the existing infrastructure stock and services and/or the progression of the targeting indicators over time. This analysis is presented in Section 6.3.
Greenhouse gas emissions (GHG) have been determined for the Independent Power Producers (IPP) investments based on IPCC data. GHG avoidance of renewable plants has been determined by comparing the amount of IPCC GHG emissions per kWh of renewable plants (which are not zero, because of production and construction) with the relevant country average emissions per kWh. For comparison, we have also applied the United Nations Framework Convention on Climate Change (UNFCCC) data that is used by DFIs. As will be shown in Section 6.4, the UNFCCC method leads to higher avoidance results because of the underlying assumption that renewable plants phase out the largest polluting plants, which may, but often may not, be the case. In line with the BII-signed PCAF methods, GHG emissions have been attributed to BII. The PCAF method is also applied to the other ultimate impact results. These can be found in Section 6.5.
3. Overview of portfolio
Summary
- infrastructure investments make up 28% of British International Investment’s (BII) active portfolio
- the scope of this evaluation encompasses US$2,345 million that BII has disbursed to 194 companies, which manage 295 separate infrastructure assets
- the infrastructure portfolio has grown substantially over the past 6 years, from US$56 million in 2007 to US$2,345 million in 2020, largely due to 14 direct equity investments, and 25 direct debt investments. 43% of the infrastructure portfolio is made up of direct equity investments, 31% is direct debt investments and 26% is invested through infrastructure funds
- power is by far the largest sector (70%), and Independent Power Producers (IPPs) make up the bulk of investments in that sector, making up approximately three-fifths of the entire infrastructure portfolio. ICT and Transport represent 22% and 8% of the portfolio respectively. Water, sanitation and hygiene (WASH) is an area of strategic importance but is makes up a minor part of the current portfolio
- ten countries receive 75% of the disbursed capital of the portfolio. The greatest amounts are invested in India, Côte d’Ivoire and Kenya. The concentration in these 10 countries seems to be driven largely by the size of each country’s economy, with larger countries offering better and/or more investment opportunities
3.1. Infrastructure investments within BII’s portfolio
Infrastructure currently makes up 28% of British International Investment’s (BII) active portfolio. This Portfolio Review encompasses 14 direct equity investments, 25 direct debt investments and 15 infrastructure-focused fund investments. This scope covers US$2,345 million that BII has invested in infrastructure since 2007 in 194 companies that manage 295 assets. As at 31 December 2020 [footnote 25], a total of US$2,146 million [footnote 26] is still active. Total infrastructure commitments are US$3,352 million, of which US$1,936 million is used for directs investments and US$1,416 million is used for infrastructure funds [footnote 27]. This scope excludes 54 investments that were made through 38 generalist funds, with aggregate disbursements of US$157 million.
Exhibit 1: Growth of BII infrastructure portfolio
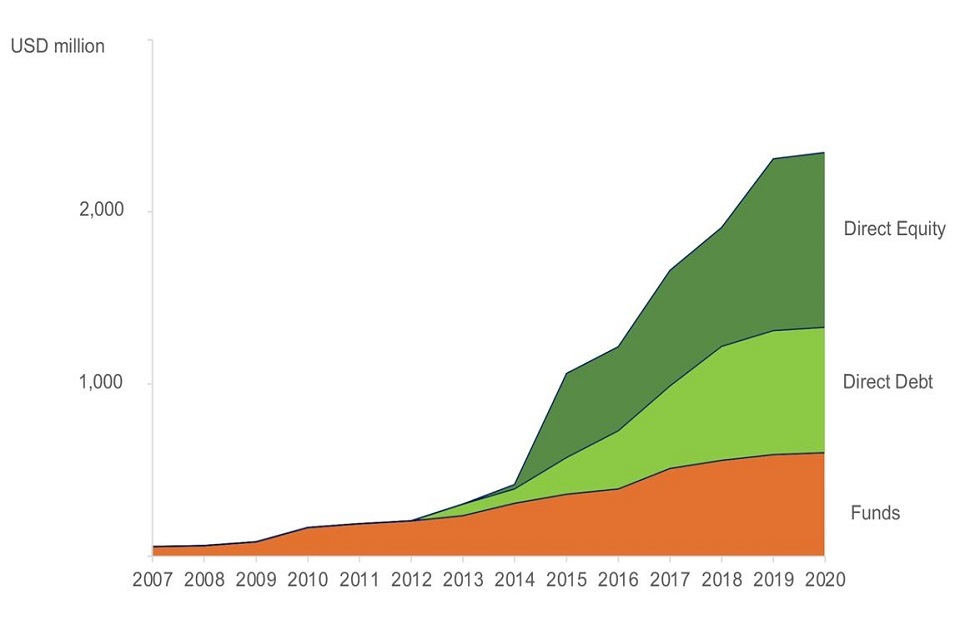
Exhibit 1
As shown in Exhibit 1, BII has greatly increased its infrastructure portfolio over the past 6 years, largely due to direct equity investments and debt investments. In terms of investment products, 43% of the infrastructure portfolio is made up of direct equity investments, 31% is direct debt investments and 26% is invested through infrastructure funds.
3.2. Infrastructure portfolio composition
Exhibit 2 provides an overview of the infrastructure portfolio. The inner circle indicates that Power is by far the largest sector, whereas only a single direct investment has been made in WASH. The second circle shows the sub-sectors and the outer circle shows the geographic regions. By simultaneously looking at all three circles it becomes clear that, for example, more than a third of the entire portfolio is made up of African IPPs.
Power investments make up 70% of the portfolio, followed by ICT and Transport, which make up 22% and 8% respectively [footnote 28]. The IPP sub-sector alone constitutes over 60% of the entire portfolio. Investments in transmission and distribution (T&D), off-grid, commercial and industrial power (C&I) and broadband backbone investments have only been made in Africa, while the majority of all road investments have been made in India. Although the relative size of the WASH sector is negligible (0.3%), it is an area of strategic priority going forward. Africa and South Asia represent 66% and 34% of the disbursed portfolio respectively. A total of US$81 million (3.4%) of investments have been made through Catalyst Strategies, which focuses on shaping nascent markets, and takes a more flexible approach to risk in order to achieve impact. The disbursements of direct investments are US$1,743 million, which is equal to 90% of the total direct commitments.
Exhibit 2: BII infrastructure portfolio in terms of sectors, sub-sectors and geography
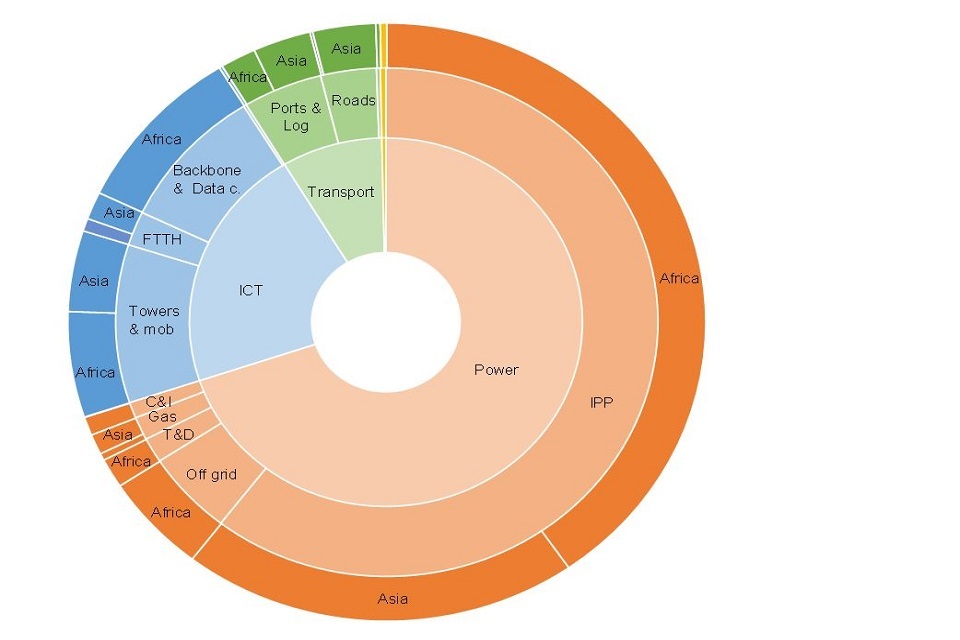
Exhibit 2
Exhibit 3 illustrates that in terms of countries, 75% of the capital has been disbursed to 10 countries. This seems to be driven largely by the size of the country’s economy, with larger countries offering better and/or more investment opportunities. The only large countries which are not among the largest investment destinations are Myanmar, Pakistan and Ethiopia. BII’s relative contribution to private infrastructure investments in all the countries is discussed in greater detail in Section 6.2.
Exhibit 3: Overview of investments by country and sector (US$ millions)
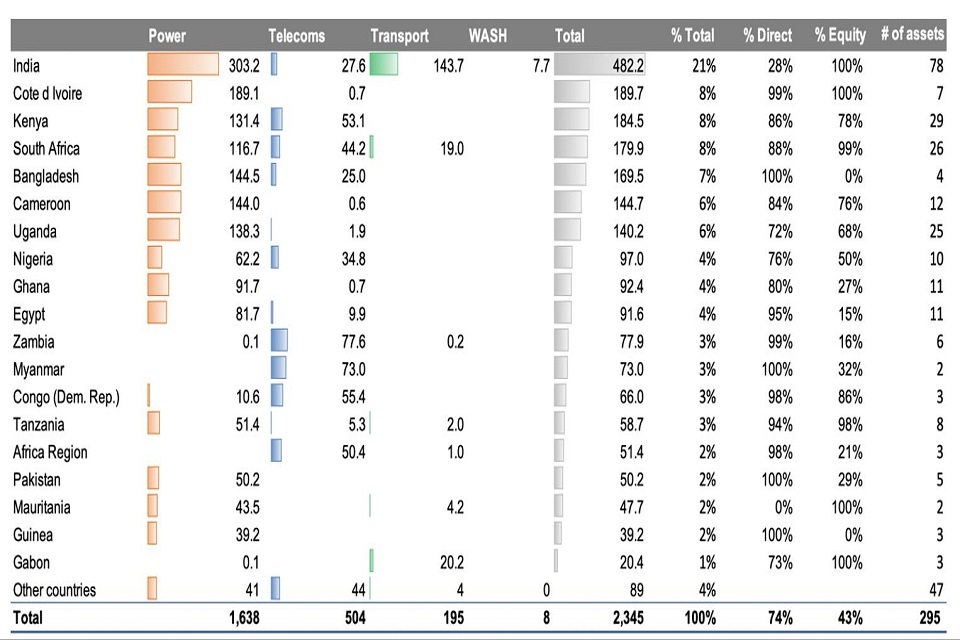
BII has more than US$10 million exposure to two or more infrastructure sectors in six of the top ten countries (India, Kenya, South Africa, Bangladesh, Nigeria, Egypt). Although complementarity between investments cannot be assumed a priori [footnote 30], these countries have the most potential for BII to achieve complementarity between its investments.
We divided the power deals (US$1,638 million) into five sub-sectors: (i) IPPs; (ii) commercial and industrial (C&I); (iii) off-grid and mini-grid; (iv) transmission and distribution (T&D); and (v) midstream energy. Exhibit 4 shows the prevalence of IPPs in BII’s Power portfolio: 87% of Power disbursements have been made in this sub-sector (this means 60% of the entire infrastructure portfolio). The remainder of Power sector disbursements went primarily to off-grid solutions, such as solar home systems, C&I customers, and mini-grid. The portfolio is mostly invested in Africa, with the exception of midstream gas assets, of which 74% are based in India and Bangladesh. Overall, India received the largest amount of Power investments (19%), followed by Côte d’Ivoire (12%) and Bangladesh and Cameroon (each 9%). Uganda received the greatest diversity of Power investments, with investments made in IPPs; captive/off-grid power; solar home systems, and transmission and distribution. Most Power investments are made through direct equity investments (42%) and direct debt investments (32%). Fund investments are relatively more prevalent in Asia than in Africa (41% and 19% respectively), primarily due to the India Infrastructure Fund I & II, and the Renewable Energy Asia Fund.
Exhibit 4: Power portfolio in terms of sub-sectors, geography and instrument
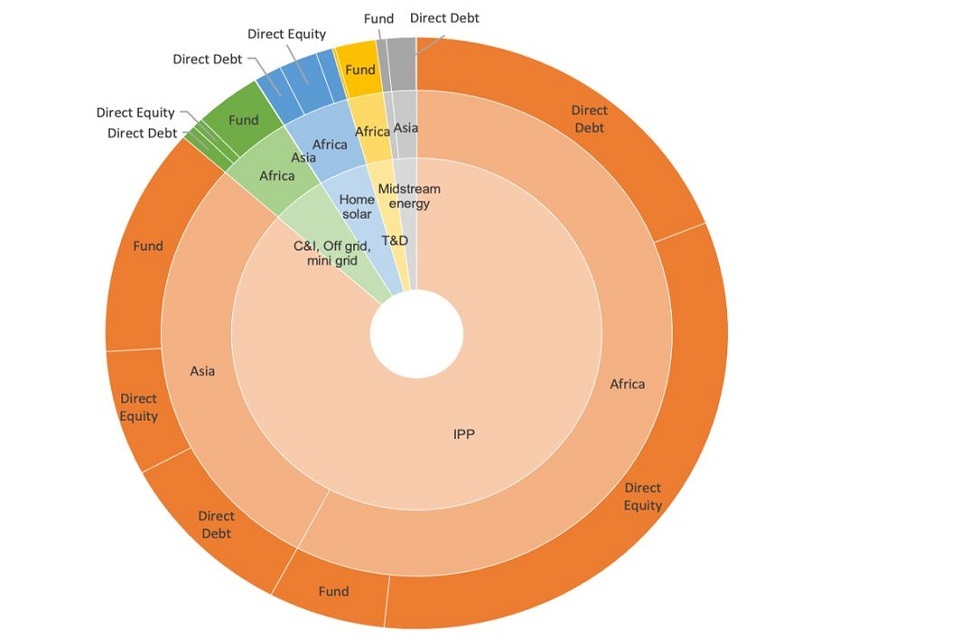
Exhibit 4
Exhibit 5 shows the Transport portfolio by sub-sector, geography and instrument. In the transport sector (US$195 million), investments into roads account for the largest share of disbursements (40%), followed by the logistics sub-sector (34%). The port sub-sector makes up 23% of disbursements with the remaining 3% in airports (which are not considered further in this report). Remarkably, almost 75% of the total amount in the Transport sector is invested in India (largely in toll roads) through the India Infrastructure Fund I and II as well as directly in the logistics company Ecom Express. The remaining 25% is invested in African countries. Most of the Transport deals have been made through funds, but there are three exceptions: Owendo port in Gabon (a co-investment with fund Meridiam), the conglomerate Grindrod, (exited in 2019) and the logistic solutions provider, Ecom Express Private Limited, in India.
Exhibit 5: Transport portfolio in terms of sub-sectors, geography and instrument
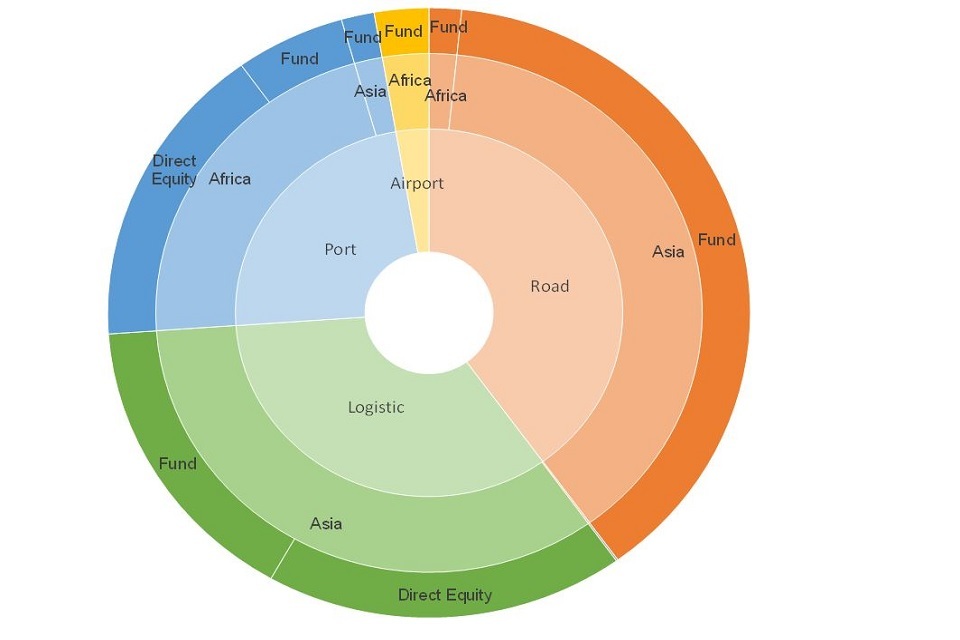
Exhibit 5
Investments in ICT, shown in Exhibit 6, amount to US$504 million and are balanced between mobile (TowerCos), and fixed infrastructure: fibre-to-the home (FTTH), internet service providers (ISPs), and backbone and data centres. From a geographical perspective, while tower investments are equally spread throughout Africa and Asia, backbone and FTTH deals are mostly located in Africa. Direct investments constitute 90% of the ICT portfolio. Until 2017, BII investments in ICT had been almost exclusively focused on towers and mobile access-related companies. In 2019, the outstanding amount was doubled and a significant change in sectoral focus took place, a change that was due to three direct equity deals: Liquid Telecommunications Holding Limited, WorldLink Communication and Frontiir. Liquid Telecommunications [footnote 31] alone constitutes about half of the ICT investments. It focuses on the backbone and data centres sub-sectors in Africa.
Exhibit 6: ICT portfolio in terms of sub-sectors, geography and instrument
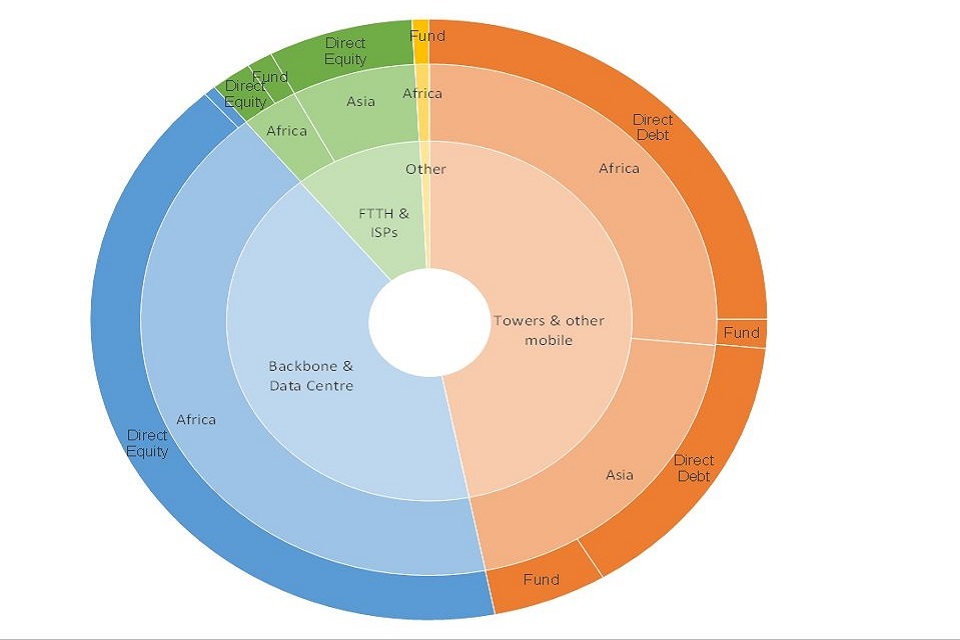
Exhibit 6
4. Evidence Review
Summary
- in general, when the available evidence from the reviewed published literature is aggregated across all asset types and sectors, the evidence base is stronger for ultimate impacts and for some impact pathways, than it is for outcomes
- although there is frequently strong evidence that an infrastructure investment affects ultimate impacts, the exact causal pathway by which it causes those high-level impacts is not evidenced in the studies reviewed
- within the Power sector, there is more evidence available which links IPPs to the variables in the British International Investment (BII) Impact Framework than there is available for other asset types
- for Transport, there is strong evidence available which links investments into transport to ultimate impacts of economic opportunity, standard of living and environmental sustainability; for environmental sustainability, both positive and negative effects were found
- the evidence for ICT and Telecoms indicates positive impacts of broadband and backbone investments, particularly on economic variables, but the impact is unclear for data centres and telephony
- there is less evidence available which links water infrastructure investments with development impact; despite this, there is good evidence of its impact on GDP and employment
The Evidence Review component of the portfolio evaluation aimed to identify, assess and summarise the existing evidence base which links infrastructure to development impact. The team identified over 450 relevant studies, of which 331 were of sufficient quality to be included. Those that were excluded were done so because the study was either not sufficiently relevant or sufficiently robust to meet the inclusion criteria. The search for the studies was conducted to maximise the potential to combine the findings with investee-level data and external data sources to make quantitative estimations of development impact.
The summarised evidence indicates where there is a study that confirms the relationship between an investment in the given sector, and the variable in question (e.g. where a study answers ‘what is the impact of an investment of x in infrastructure sector y on variable z’). Therefore, the review indicates where there was available evidence that an infrastructure investment affected a variable, rather than providing evidence of the specific causal pathway through the impact framework.
The evidence was searched for by specific and relevant variables, and by asset type. In this section we firstly present an aggregated overview of the strength of the evidence, across all asset types and all sub-sectors. We then outline the strength of the evidence for each of the relevant ultimate impacts, outcomes and impact pathways in the British International Investment (BII) Infrastructure Impact Framework, broken down by sector. Finally, we provide an overview of how the Evidence Review was used to generate ‘evidence rules’ that were applied to the BII portfolio analysis.
4.1. Overview of evidence against BII’s infrastructure impact framework
In general, when the available evidence is aggregated across all asset types and sectors, the evidence base is stronger for ultimate impacts and for some impact pathways than it is for outcomes. Across all sectors, there is strong evidence linking infrastructure investments to four of the results in the impact framework (those are: greater productivity, economic opportunity, standard of living and environmental sustainability), one at outcome level and three at ultimate impact level. This evidence indicated a positive relationship between the investment and the result. There is more concrete evidence available at outcome level for the Transport sector than there is for other sectors.
In summary, significantly more evidence was found in the Evidence Review for second order impacts, such as GDP and employment. There is strong evidence to suggest that investments have positive impacts on these variables across all infrastructure segments. However, less evidence was found within the Review on intermediate impacts such as changes in prices, time and user volumes (which would fall under improved affordability, improved quality and reliability, and increased access in the BII Infrastructure Impact Framework).
‘Additional capacity’ was not included in the Evidence Review search strings as it was an assumed input at the start of each causal path explored; that is, it was assumed that an infrastructure investment led to additional infrastructure capacity. Having made that assumption, the Evidence Review then focused on whether this had an influence on the other variables included in the framework.
Section 4.2 unpacks the evidence base at sector and asset level, to allow for a more nuanced review of the strength of the evidence.
4.2. Strength of evidence for each sector
This section provides an overview of the strength and content of the evidence available for key variables by sector and asset type. The relevant studies are only referenced in this summary if the evidence base is considered to be strong. The strength of evidence is established by the number of studies found that link an investment in the asset type to the variable of interest.
For each sector, we present the overall strength of evidence aggregated at sector level, against the BII Infrastructure Impact Framework. We then summarise the strength of the evidence available by asset type for specific variables. These specific variables relate to the impact pathways, outcomes and ultimate impacts in the BII Infrastructure Impact Framework. There is often more than one variable that can be used to measure the result against (for an impact pathway, outcome or ultimate impact) the framework. We have related variables to specific boxes on the BII Infrastructure Impact Framework. We recognise that categorisations are open to interpretation and variables could be placed against different boxes in the framework; however, we consider the categorisations we have made to be logical and fit for purpose.
Power
An overview of the available evidence for the Power sector against the BII Infrastructure Impact Framework is presented in Exhibit 7. Variables that are not considered to be relevant to the Power sector are included for completeness but are shaded in light grey to indicate that they are not relevant. Exhibit 7 shows that there is more evidence available for two impact pathways for Power – reduced prices and customers reached – but no evidence for the three others; for the relevant outcomes, there is weak evidence available for productivity and moderate evidence available for improved quality and reliability for IPPs; for each of the ultimate impacts, there is stronger evidence available across asset types than for impact pathways and outcomes, linking Power investments to these ultimate impacts.
Exhibit 7: Summary of evidence for the Power sector against the BII Infrastructure Impact Framework
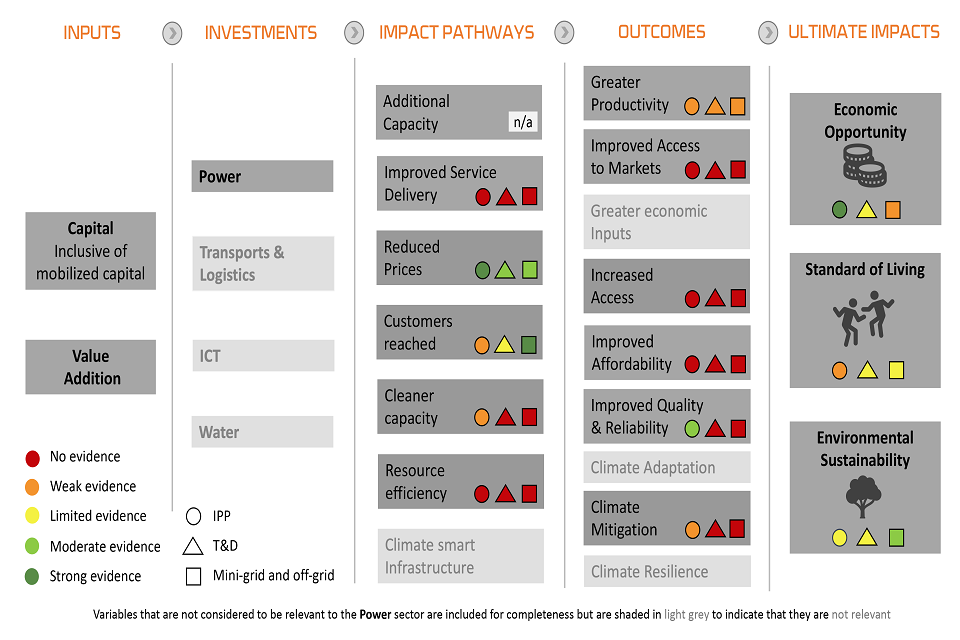
Exhibit 7
Independent power producers
For impact pathways, the team found that there was good evidence of the impact of IPPs on prices. However, all other evidence for impact pathways is limited or weak. Although the evidence base on the impact of IPPs on prices is strong (it is covered by 10 studies) [footnote 32], the evidence is unclear on the specific impact, and whether investments into IPPs increase or decrease prices. Additional power generation, especially from renewable technologies, does have a positive effect on power prices. Regarding reduced prices, there is weak evidence to indicate that additional IPP hydro investments will allow lower fuel subsidies (only one study). There is limited evidence linking IPP investments to customers reached, as measured by coverage, with two studies indicating that IPP investments lead to increased connection to the energy grid.
In terms of BII’s outcomes, there is moderate evidence to suggest that increased production of power can have a positive, but marginal, impact on reducing power outages (six studies), which is one measure of ‘improved quality and reliability’. However, there is significant variance in this data which makes it difficult to generalise. Additionally, there is limited evidence which points to the positive impact of IPP investments on productivity (two studies).
With regard to ultimate impacts, there is strong evidence linking IPP investments with economic opportunity, specifically GDP and employment. Strong evidence suggests that IPP investments have a positive impact on GDP, but the evidence does not clarify the causality. The team also found strong evidence that IPP investments have a positive impact on employment (11 studies) [footnote 33]. Under economic opportunity, there is weak evidence which suggests that IPP investments will result in a positive impact on impact on trade (two studies), although it is not clear if the impact on trade is positive or negative. Under the heading of standard of living, there is weak evidence which suggests that IPP investments will result in a positive impact on incomes (three studies) and no evidence from other variables under this impact type.
With reference to environmental sustainability, there is limited evidence linking IPP investments to results in emissions (three studies), which indicates how renewable energy IPPs lead to a reduction in GHG emissions, (i.e. through avoidance of emissions by adding renewable energy capacities rather than adding capacities which use fossil fuels).
Transmission and distribution
There are fewer high-quality studies linking T&D investments to impact than are available for IPPs. For BII’s impact pathways, the team found limited evidence from three studies, of the positive impact of T&D on customers reached. This evidence was measured by connections, which typically had a 1- or 2-year lag period. It found moderate evidence of reduced prices (six studies) as a result of T&D investments. At outcome level, there is limited evidence of the positive impact of T&D on productivity, based on two studies.
Most of the evidence that was found related to variables that are classified under ultimate impacts, although for all but one of these, the evidence was limited or weak. Under economic opportunity, there is limited evidence of the positive impact of T&D on net positive GDP benefits (four studies) and employment (three studies), and weak and/or inconclusive evidence on the effects on trade (one study). For variables associated with standard of living, the team found a moderate amount of evidence that T&D affects gendered outcomes (with five studies). However, the evidence was inconclusive as to whether the investments had a positive or negative effect on these gendered outcomes. The evidence on the impact on positive income effects (through energy price reduction) is limited (four studies); the evidence on health is weak but positive (one study); the evidence on educational impacts (such as the number of hours that children study each day) is also limited with three contributing studies, and neutral as to whether the T&D has a positive or negative effect on these impacts. For environmental sustainability, there is limited evidence of the positive impact of T&D on reduced CO2 emissions (four studies).
Mini-grid and off-grid
There is moderate evidence linking mini-grid and off-grid solutions to positive impacts; however, the evidence base is weak or limited for many of the variables of interest. For impact pathways, there is strong evidence linking mini-grids to customers reached, which suggests that they contribute to increased coverage, although there is no clear comparison with grid energy which would help to indicate which solution would most benefit consumers. There is also moderate evidence indicating that mini-grids generate power at a lower price than grid energy, depending on the source of the energy (nine studies). For BII’s outcomes, there is weak, inconclusive evidence linking these investments to productivity (one study). Under ultimate impacts, for economic opportunity the evidence base is limited but suggests that mini-grid and off-grid solutions have a positive impact on employment (four studies). Related to standard of living, there is limited evidence to suggest a positive impact on incomes through reduced energy/time costs (five studies), and weak evidence to indicate a positive impact on health outcomes (two studies) educational outcomes (two studies) and gender outcomes (three studies). Regarding environmental sustainability, the evidence is moderate and suggests a positive impact on GHG emission reduction (six studies).
Transport
Exhibit 8 presents a summarised overview of the strength of available evidence against the relevant variables for Transport, based against the BII Infrastructure Impact Framework. At impact pathway stage, there is moderate evidence available on reduced prices; of the seven relevant outcomes, three of the outcomes have strong evidence for one asset type each, but the evidence is weak, limited or none was found, for the remaining four outcomes. Overall, there is strong evidence available for each asset type for each of the ultimate impacts.
Exhibit 8: Summary of evidence for the Transport sector against the BII Infrastructure Impact Framework
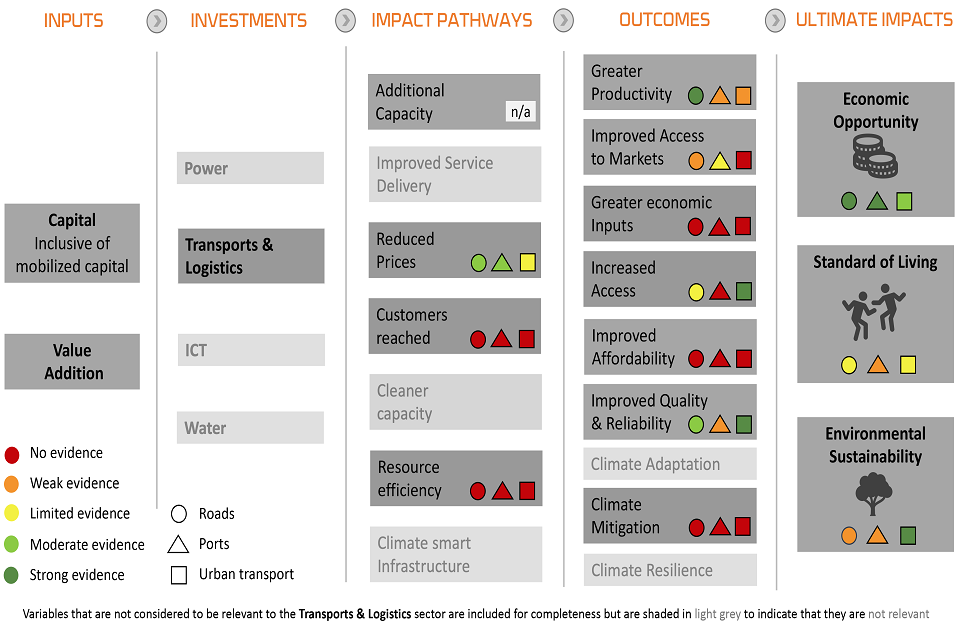
Exhibit 8
Roads
The team found good evidence linking investments in roads to a number of variables of interest. However, it is noteworthy that the studies that focus on developing countries primarily relate to rural roads, whereas BII’s investment strategy for roads is focused on toll roads. For impact pathways, there is moderate evidence of a positive relationship between roads and prices (seven studies). At outcome level, there is moderate evidence that road investments improve quality and reliability, by means of positive effects on transport time (six studies) and strong evidence that they improve productivity at micro and macro level (13 studies; however, this evidence is difficult to quantify as metrics vary considerably across the different studies). Some positive, but limited, evidence suggests that new roads increase access, this is measured by increased usage (five studies). There is weak evidence to suggest that road investments improve access to markets, when assessed by volumes of goods (one study).
For ultimate impacts, there is strong evidence that roads impact economic opportunity, with strong and positive evidence on their impact on GDP (18 studies) [footnote 34], and on trade (14 studies) [footnote 35]. There is moderate evidence of a positive relationship between roads and employment (six studies) [footnote 36]. For standard of living, there is strong positive evidence linking roads to incomes, household consumption and poverty reduction in relation to new, rural roads specifically (13 studies) [footnote 37]. Under Environmental Sustainability, there is weak evidence to suggest that road investments increase emissions (two studies).
Ports
Overall, there is good evidence to demonstrate the impact of ports on economic variables. However, there is weak evidence that ports affect the variables that are associated with people’s standard of living. For impact pathways, there is moderate evidence available on the positive impact of ports on price (eight studies). Under outcomes, limited evidence is available on the impact of ports on improved access to markets, when measured as the increase in volume of goods (four studies). The link between ports and improved quality and reliability (as measured by transport time) and productivity is only weakly evidenced by two studies for each factor, but despite this it indicates a positive relationship between the two factors. At ultimate impact level, there is strong evidence that ports affect economic opportunity, with strong evidence available of the positive impact on trade (10 studies) [footnote 38], on employment (16 studies) [footnote 39] and of increased port throughput capacity on local or regional GDP (23 studies) [footnote 40].
However, there is a lot of variability in the data relating to employment, making the relationship between ports and employment difficult to quantify. Regarding standard of living, limited evidence links ports to positive impacts on incomes (five studies) and no evidence was found linking ports to other measures of standard of living [footnote 41]. The impact of ports on environmental sustainability, as measured as emissions, is also weakly evidenced (one study) and inconclusive as to whether it is a positive or negative relationship.
Urban transport
For urban transport [footnote 42], good evidence links these investments to economic variables, however, there is limited or weak evidence on the results for end users. For impact pathways, the review found limited evidence that urban Transport investments have a positive impact on user price (three studies). At outcome level, the team found strong evidence that an increase in urban transport infrastructure leads to increased access, measured as user volume (11 studies) [footnote 43] and improved quality and reliability, measured as a reduction in travel time (14 studies) [footnote 44].
Weak evidence links urban transport to greater productivity (one study). Under ultimate impacts, there is moderate evidence of the positive impact of these investments on economic opportunity, indicated by moderate evidence of the positive impact on employment (eight studies) and GDP (nine studies; although incomparable data meant that the relationship of investments in urban transport with GDP could not be quantified). Regarding standard of living, there is limited evidence on its positive impact on household incomes (six studies), and weak evidence on its impact on health (one study) and education (two studies). In terms of environmental sustainability, the team found strong evidence linking an increase in urban transport infrastructure to a decrease in emissions (11 studies) [footnote 45].
ICT and Telecoms
Exhibit 9 presents the ICT and Telecoms evidence, by asset type, summarised against the BII Infrastructure Impact Framework. There is evidence at impact pathway stage of the framework for both reduced prices and customers reached. At outcome level, there is either no evidence or it is weak evidence, with the exception of a strong evidence base on productivity for broadband/backbone and on improved affordability for telephony. At ultimate impact level, the evidence base is stronger for economic opportunity than it is for standard of living and environmental sustainability. Overall, the evidence for ICT and Telecoms indicates positive impacts of broadband and backbone investments, particularly on economic variables, but the impact is unclear for data centres and telephony.
Exhibit 9: Summary of evidence for the ICT and Telecoms sector against the BII Infrastructure Impact Framework
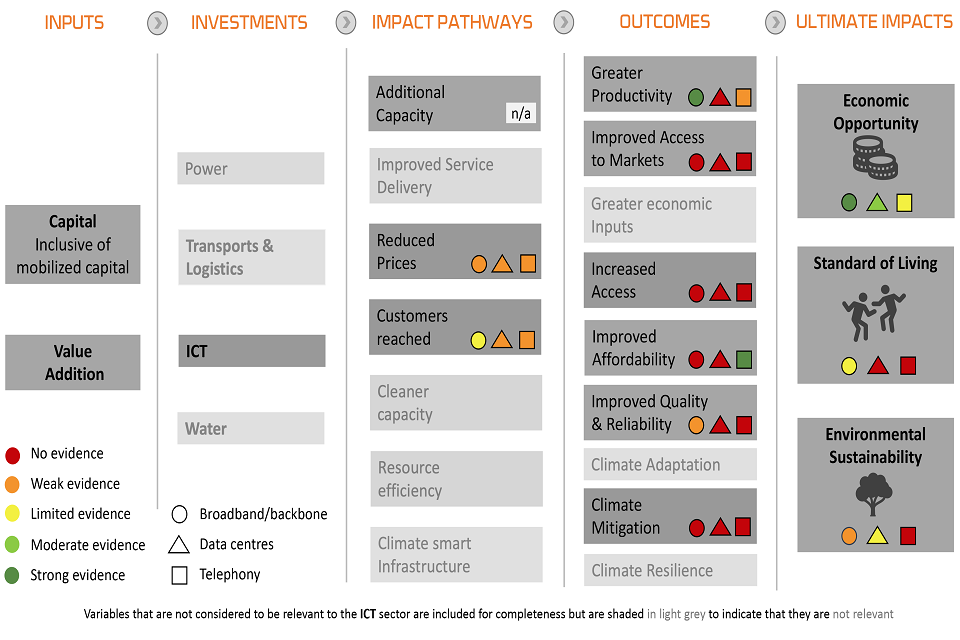
Exhibit 9
Broadband/backbone
In terms of impact pathways, the evidence linking internet to customers reached – measured by number of users – is limited, but indicates a positive relationship (five studies). The evidence is weak and inconclusive on the effects of broadband on price (two studies). Regarding outcomes, the evidence is strong on the positive impact of broadband penetration on productivity (11 studies) [footnote 46], and weak for the impact of broadband on improved quality and reliability when measured as speed (one study). At ultimate impact level, there is strong evidence on the impact of broadband on economic opportunity, with a positive relationship indicated on the effect of broadband penetration on employment (24 studies) [footnote 47], and GDP (23 studies) [footnote 48].
In relation to economic opportunity, there is moderate evidence suggesting a positive relationship between broadband and its effects on trade (seven studies). Related to standard of living, there is moderate evidence on the positive effect broadband has on income (seven studies), and weak evidence of the impact of broadband on education (two studies) and health (one study), suggesting a positive relationship. Regarding environmental sustainability, the evidence base is weak for the impact of broadband on emissions (one study).
Data centres
For data centres, there is good evidence of their impact on employment and growth, but limited or weak evidence in relation to all other variables. At impact pathway level, the evidence of data centres’ impact on price and customers reached (as measured by usage) is weak and inconclusive (one study each). At outcome level, the team did not find any evidence of the impact of data centres on the relevant variables. For ultimate impacts, there is moderate evidence of the positive impact of data centres on economic opportunity, by means of impact on employment (10 studies) [footnote 49] and GDP (seven studies). The team found no evidence linking data centres with impact on variables associated with standard of living. For environmental sustainability, there is limited evidence of the positive impact of data centres on emissions. Where more efficient data centres lower emissions (five studies), the evidence is unquantifiable.
Telephony
Good evidence links telephony to GDP, but there is limited evidence of its impact on other variables. For impact pathways, the evidence base is weak but positive on the effect of telephony on price (one study), and weak and inconclusive on the impact on customers reached, as measured by usage (two studies). At outcome level, there is weak evidence that suggests a positive relationship between telephony and productivity (two studies). For ultimate impacts, there is a strong evidence base which demonstrates the positive impact of telephone line penetration, including mobile broadband penetration, on GDP (10 studies, including multi-country studies) [footnote 50] and weak but positive evidence on the effect of telephony on employment (two studies), and trade (two studies), all of which contribute to economic opportunity. There is no evidence linking telephony to standard of living or environmental sustainability.
Water
Overall, there is less evidence available linking water infrastructure investments with BII’s intended impact pathways, outcomes and ultimate impacts when compared with other sub-sectors; however, there is good evidence of its impact on GDP and employment. Many of the studies collated through the review are focused on high-income countries and therefore have limited applicability to BII target countries.
Exhibit 10: Summary of evidence for the Water sector against the BII Infrastructure Impact Frameworks
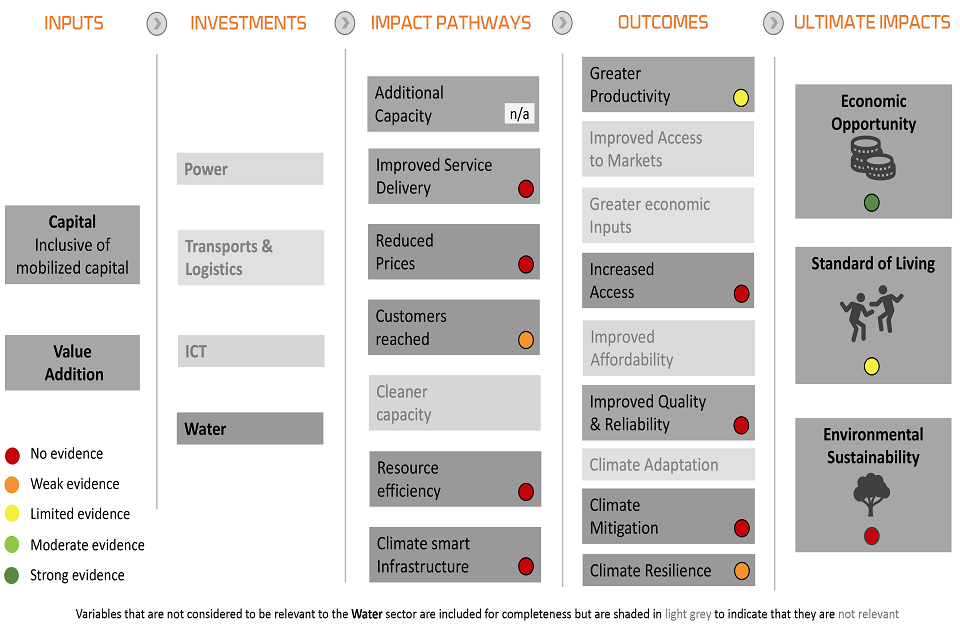
Exhibit 10
For impact pathways, there is weak evidence in relation to customers reached when assessed as increased water usage (two studies). At outcome level, there is some evidence that water infrastructure has an impact on improved productivity (assessed as a result of reduced water outages and based on three studies) and weak evidence of its impact on resilience (one study). For ultimate impacts, there is strong evidence of the positive impact of water utility infrastructure on GDP growth (12 studies) [footnote 51], and moderate evidence of increased employment (six studies) both contributing to economic opportunity. Related to standard of living, there is limited evidence that water infrastructure has an effect on social impacts (three studies) and weak evidence that water infrastructure improves incomes and income inequality (one study). There is no evidence linking water infrastructure to environmental sustainability.
4.3. Evidence rules
The Evidence Review was designed to seek out evidence that was pertinent to BII’s infrastructure portfolio. We developed 22 evidence rules where the quality and homogeneity of the evidence allowed. Six of these were applied to investments in the BII portfolio [footnote 52]. As explained previously, each evidence rule was based on the best available evidence at the particular point in time, and can be corrected or replaced when better evidence becomes available.
The evidence rules that we generated through the Evidence Review and applied to the BII portfolio are presented in Table 2. These have been reviewed by the evaluation team’s sector lead specialists as part of their sector-specific review of this report.
Table 2: Overview of evidence rules
| Number | Sub-sector and asset type | Relationship being quantified | Evidence rule |
|---|---|---|---|
| 1 | Power/IPPs | IPP capacity > employment | For every 1 MW of additional energy generated by IPPs, between 40 and 140 direct and indirect jobs are likely to be created (excludes induced jobs) |
| 2 | Transport/ports | Port capacity > GDP | 1% increase in port throughput capacity can increase local/regional GDP between 0.04% and 0.2% |
| 3 | Transport/roads | Quantity of road infrastructure > GDP | 1% increase in the quantity of road infrastructure can increase GDP by between 0.1% and 0.5% |
| 4 | Transport/roads | Quantity of road infrastructure > employment | 1% increase in road infrastructure leads to an increase between 0.1% and 0.3% in employment |
| 5 | ICT and Telecoms | Broadband penetration > productivity | 1% increase in broadband penetration can lead to a productivity increase between 0.13% and 0.7% |
| 6 | ICT and Telecoms | Mobile broadband penetration > GDP | 10% increase in mobile broadband penetration will have a positive impact on GDP between 0.3% and 1.8% with an upper estimate of 2.8% |
5. Analysis of development impact across the portfolio
Summary
- the ultimate impacts of the portfolio were estimated using the evidence rules. These do not reflect the causal chain of British International Investment’s (BII) impact framework which goes from impact pathways to outcomes to ultimate impacts. Insufficient knowledge of the relationships, or investee data that involve outcomes, constitutes a ‘missing middle’ in the evidence chains
- across the portfolio, we estimate that BII investees covered by the scope of this report [footnote 53]:
- reach 152 million consumers, or one in every twenty people living in Africa and South Asia
- support 3.5 million indirect jobs [footnote 54], which is roughly equivalent to the working population of the Kampala metropolitan area
- generate US$17.6 billion of value added annually (i.e. contribution to GDP) [footnote 55], which is about the same as the GDP of, again, Kampala’s metropolitan area
- about 80% of the investments are on track to realise their development impact (DI) thesis
- both under-performance and over-performance of investments against the DI thesis is mostly due to internal factors (such as strategic fit and implementation skills), but external factors (macro-economic and geopolitical context and regulatory environment) also have an influence
- in terms of disbursed capital, the most important impact pathways of the portfolio are: additional capacity, improved service delivery, reduced prices and (to a lesser extent) cleaner capacity. The impact pathways that occur less frequently are customers reached and resource efficiency. The impact pathway climate smart infrastructure seems absent in the portfolio
- for all 39 direct investments, the BII risk-based BI due diligence process was performed, and for 30 of these BII’s BI team undertook more in-depth interventions to support investees. For funds, the main value-adding activities include annual BI reporting, training; ad hoc advisory and routine monitoring
- for all 39 direct investments, the BII ESG due diligence process was performed, and for 23 of these a more detailed assessment was also conducted. Deal-specific interventions were made in nine investments. For funds, the focus was improving ESMS systems
- ten investee companies in the home, solar and C&I sub-sectors received technical assistance worth US$1.25 million. A similar amount went to the support of impact opportunities beyond BII’s portfolio
In the following Section 5.1, we first describe the aggregate development impact of British International Investment’s (BII) infrastructure investments. In Section 5.2 we give an overview of the link between BII’s investments and the impact pathways. We then assess the performance of all direct and fund investments against their formulated DI theses in Section 5.3. And last, in Section 5.4 we summarise BII’s value addition activities, which is the second pillar of BII’s inputs in the impact framework, in the areas of Business Integrity (BI), Environmental, Social and Governance (ESG) and technical assistance and support provided via BII Plus.
5.1. Portfolio aggregate development impact
In the Evidence Review in Section 4 the BII impact framework is used to describe the evidence. The logical approach would be to trace how investments affect impact pathways, outcomes and finally ultimate impacts along the framework. However, this is difficult for several reasons:
- the link between impact pathways and outcomes often relies on data which is unavailable for BII investments. An example of this is the evidence rule that a 1% improvement in port infrastructure quality is associated with a 7% reduction in transport costs, where the quality variable cannot be directly inferred from the data
- the link between impact pathways and outcomes depends on external factors for which data is not available across countries. For instance, the relationship between improved power generation and improved quality and reliability (i.e. reduced outages) depends on external factors such as the reserve margin of the entire power generation and distribution system
- the link between outcomes and ultimate impact is unknown. For instance, a decrease of transport costs cannot be directly linked to employment and GDP without considering many other external factors
However, virtually all infrastructure investments can be linked to the respective impact pathways and can by linked (by using the insights from the Evidence Review) to several of the ultimate impacts. This means the relationships involving outcomes constitute a ‘missing middle’ in the evidence chain. The second phase of the Infrastructure Evaluation will be a series of in-depth studies which aim to address this missing middle, by looking at the ‘mechanics’ of how investments deliver outcomes and ultimate impacts. This section provides high-level estimations of BII’s ultimate impacts, and Section 5.2 describes the link between investment and impact pathways.
The ultimate impacts of BII’s impact framework have been quantified on eight portfolio-wide indicators. As mentioned in Section 2.3, modelled figures rely on the evidence rules in Table 2, as well as with the Joint Impact Model. The evidence rules essentially translate capacity additions in the different infrastructure sectors into employment and GDP. The total number of people reached by IPP investments is estimated by using country-specific data on the average residential power use per capita, as well as by using other datasets. The aggregate ultimate impacts of all 295 assets in the portfolio are summarised in Table 3.
Table 3: Ultimate impacts of the infrastructure portfolio (based on most recent annual data)
| Ultimate impacts | Indicator | Observed | Modelled | Total |
|---|---|---|---|---|
| Standard of living | Total people reached (million) | n/a [footnote 57] | 152 | 152 |
| Economic opportunity | Direct jobs (thousands) | 32.2 | 32.2 | |
| Economic opportunity | Of which women (%) | 15% | 15% | |
| Economic opportunity | Indirect jobs (thousands) | 3,498 | 3,498 | |
| Economic opportunity | Taxes paid (US$ million) | 1,535 | 1,535 | |
| Economic opportunity | GDP contribution (US$ million) | 17,602 | 17,602 | |
| Decarbonised environments [footnote 58] | Annual CO2 avoidance (kt CO2eq) | 16,066 | 16,066 | |
| Decarbonised environments | Annual CO2 emitted (kt CO2eq) | 43,214 | 43,214 |
Across the portfolio, BII investees covered by the scope of this report [footnote 59]:
- reach 152 million consumers, or one in every twenty people living in Africa and South Asia
- support 3.5 million indirect [footnote 60] jobs, which is roughly equivalent to the working population of the Kampala metropolitan area
- generate US$17.6 billion of value added annually (i.e. contribution to GDP) [footnote 61], which is about the same as the GDP of, again, Kampala’s metropolitan area
The distribution of these impacts (portfolio total, not adjusted for number or size of investees, or BII attribution [footnote 62]) is largely in line with BII’s geographical and sectoral allocation. In summary, in terms of jobs supported and GDP impact:
- 65% of the impacts come from investments located in Africa
- 65% comes from fund investee companies [footnote 63], and 35% from direct investments [footnote 64]
- 50% of the impact of direct investments comes from equity investments and the remainder from debt investments
- 53% of the impact will come from greenfield and brownfield expansion projects once they become operational
- 55% of the impact comes from the Power sector, with the IPP sub-sector being responsible for approximately 95% of the impact within the Power sector [footnote 65]
- 40% of the impact of IPPs comes from renewable technologies
A more detailed geographic breakdown of the results features in Section 6.1.
5.2. Portfolio impact pathways
In this section, we describe the link between the investments and the impact pathways. Table 4 illustrates the indicators underlying each of the impact pathways within the different sub-sectors. Where possible, the table highlights the degree to which the investments support the development of new infrastructure, as opposed to the acquisition of infrastructure assets already in place [footnote 66].
The most frequent impact pathways in the portfolio are the provision of additional capacity, improved service delivery and reduced prices. IPPs that provide lower-cost (renewable) energy than the average countrywide generation make the largest contribution to these pathways. BII’s investees furthermore reach an estimated two million households by providing connections to electricity or to broadband [footnote 67]. Additionally, BII contributes to provision of cleaner capacity, through investments in renewable energy assets and it increases resource efficiency through the lowering of power distribution losses in its T&D portfolio. Finally, climate smart infrastructure is an additional impact pathway part of BII’s infrastructure impact framework. However, no consideration linked to the climate resilience of the infrastructure assets was identified in the portfolio. In the sections below the three main infrastructure sectors are discussed separately in more detail.
Table 4: Impact pathways of the infrastructure portfolio (“of which new” refers to greenfield investments) [footnote 68]
| Impact pathways | Indicator | Observed | Modelled | BII disbursement (US$ million) | Countries (#) |
|---|---|---|---|---|---|
| Additional capacity | Generation capacity (MW) | 25,383 | 1,429 | 29 | - |
| Additional capacity | Of which new | 19,916 | - | 880 | 25 |
| Additional capacity | Daily gas delivery capacity (million m3) | 27.4 | - | 33 | 4 |
| Additional capacity | Of which new | 21.0 | - | 32 | 2 |
| Additional capacity | Port capacity (million MT) | 53.2 | - | 45 | 5 |
| Additional capacity | Of which new | 17.0 | - | 23 | 2 |
| Additional capacity | Road length (km lanes) | 5,289 | - | 78 | 4 |
| Additional capacity | Of which new | 2,900 | 4 | - | - |
| Additional capacity | Fibre (km) | 111,685 | 264 | 7 | - |
| Additional capacity | Of which new | 17,968 | - | 221 | 1 |
| Additional capacity | Towers (#) | 33,060 | - | 236 | 9 |
| Improved service delivery | Annual generation (GWh) | 34,381 | 61,721 | 1,429 | 29 |
| Improved service delivery | Of which new | 28,105 | 50,454 | 880 | 25 |
| Improved service delivery | Daily gas delivery (million m3) | 19.2 | - | 33 | 4 |
| Improved service delivery | Of which new | 15.3 | - | 32 | 2 |
| Improved service delivery | Port throughput (million MT/year) | 14.0 | - | 45 | 5 |
| Reduced prices | Net generation cost (% change) [footnote 69] | - | -2.5% | 1,413 | 25 |
| Customers reached | New connections T&D | 1,198,000 | - | 42 | 2 |
| Customers reached | New connections Home Solar | 707,802 | - | 70 | 10 |
| Customers reached | New broadband connections | 242,600 | - | 264 | 5 |
| Customers reached | New SME connections [footnote 70] | 28,804 | - | 273 | 6 |
| Customers reached | MNO customers (million) [footnote 71] | 110 | - | 41 | n/a |
| Cleaner capacity | Renewable generation capacity (MW) | 11,848 | - | 664 | 24 |
| Cleaner capacity | Of which new | 8,452 | - | 459 | 21 |
| Cleaner capacity | Annual renewable generation (GWh) | 21,491 | 13,664 | 664 | 24 |
| Cleaner capacity | Of which new | 14,636 | 10,966 | 459 | 21 |
| Resource efficiency | Distribution losses reduction [footnote 72] (% points) | 6% | - | 42 | 2 |
Power impact pathways
More than 60% of BII’s disbursed capital went to IPPs, which added more than 25 GW of power capacity. To put this number into context, the total installed capacity in Africa is around 200 GW, and in India it is around 385 GW. This means that the IPPs in which BII is invested are equivalent to 1/8 of all of the capacity in Africa, and 1/15 of all the capacity in India. The annual generation figures compare in a similar way.
Exhibit 11: Capacity of BII investee companies as a percentage of total country capacity [footnote 73]
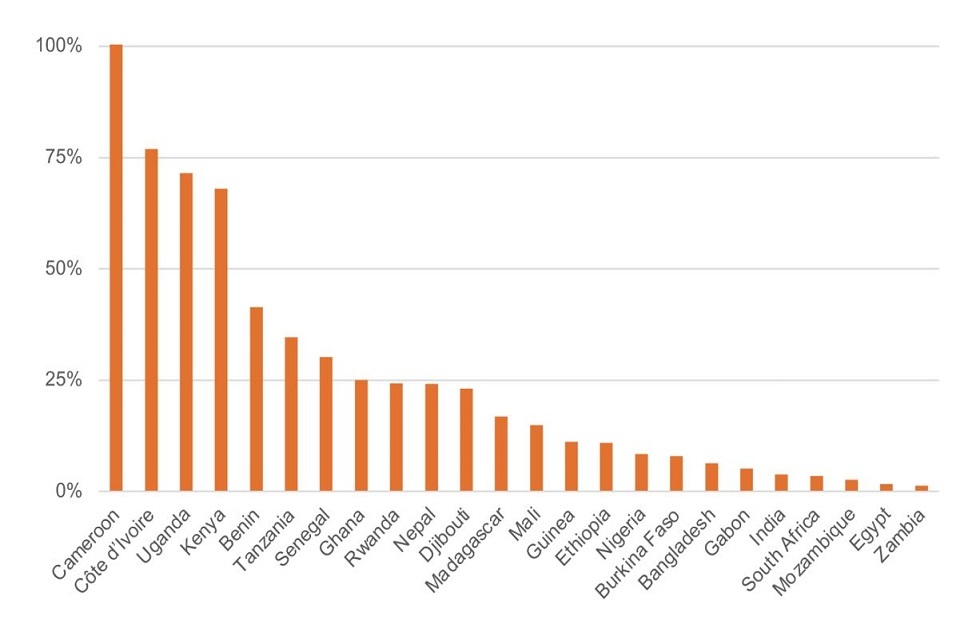
Exhibit 11
The relative impact on power capacity and production can be easily expressed; the impact on the price of power is more intricate. First of all, the price paid by the end consumer does not directly reflect supply and demand because the tariffs are typically set by a regulator. These tariffs often do not reflect the full cost of power production and distribution and are often subsidised. Cheaper power generation often means lower subsidies rather than lower tariffs in the short term. In the long term, a more cost-reflective power infrastructure increases the chance that tariffs can be reduced. This is explained in greater detail in the textbox below.
We can estimate the effect on the costs of power generation. Exactly how additional capacity affects the average cost of power generation in a particular country depends on the average [footnote 74] levelised cost of electricity (LCOE) of the current power fleet, and the expected LCOE and estimated production of the new plant. Across the portfolio we expect BII investees to decrease the average generation cost in countries by 2.5%. This overall portfolio number masks a very large degree of heterogeneity, as is shown in Exhibit 12. For example, in South Africa BII invests in renewables which are cheaper than South Africa’s current mix, which consists primarily of coal. In contrast, in Nigeria BII invests in gas, whereas the country mix contains both gas and relatively cheap hydroelectricity.
Exhibit 12: Change in net generation cost for countries where BII has invested more than US$10 million [footnote 75]
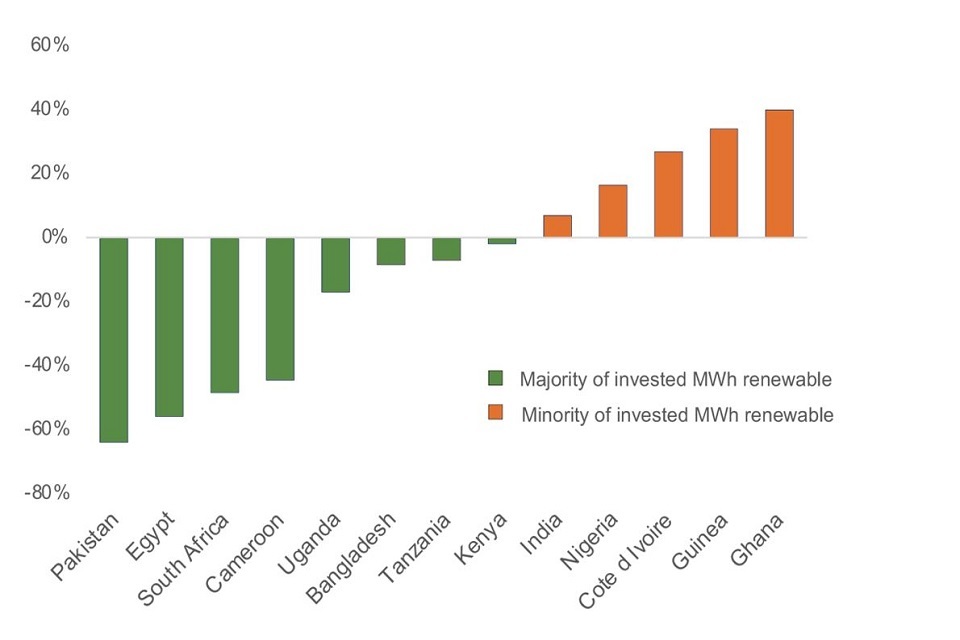
Exhibit 12
The complex relationship between power capacity, cheaper generation, and lower tariffs
In most developing countries the electricity tariffs for consumers and businesses do not reflect the full cost of power production, transmission and distribution. This is explained by several technical and political-economic reasons.
Power is often expensive for several technical reasons. Base-load capacity is regularly insufficient; this causes an overreliance on peak power plants, which are cheap to build but expensive to run. In addition, the poor state of the transmission and distribution networks cause substantial power losses. Because of the high cost of power, subsidised electricity tariffs are often politically expedient to implement but difficult to remove.
There are two important consequences of this mismatch between real cost and actual tariffs. First, governments are eager to attract investment in cheaper power generation which reduces their leverage in negotiating power purchase agreements (PPAs). This means the actual cost of power generation does not decrease as much as governments hope for, especially in the short term when investors often negotiate favourable terms to recoup their investment. Governments may then feel they are being overcharged. Their perception of ‘holding the short end of the stick’ is aggravated further by the fact that over the duration of PPAs, renewable power technologies tend to become cheaper. Second, any reduction of the cost of power does not tend to translate into lower tariffs for end customers.
BII finds itself on different sides of the argument here. Some BII investee companies face criticism for providing power that is too expensive, either because of the PPA terms, or because the technology used has become cheap quite quickly. In another case, BII invested in an operational power plant to help reschedule the PPA to make power more affordable in the short run by recouping debt capital over a longer period of time.
T&D investments affect two impact pathways: customers reached and resource efficiency. As explained in the textbox below, BII is a pioneer in this area through its investments in Umeme and Eneo. The 1.2 million connections realised in Uganda and Cameroon over the time of BII’s involvement can be compared with the estimated 13 million households in the two countries [footnote 76]; about 1 in every 11 households has been connected to grid electricity over the course of BII’s involvement in these two T&D investments. The reduction of T&D losses has been particularly impressive in Uganda (from 35% in 2007 down to 19% in 2016). The T&D losses in these two countries are equivalent to power generation of 863 GWh, with much lower capital cost and no carbon footprint.
BII’s contribution to making the transmission and distribution sector investable
Some infrastructure sectors face hurdles in attracting commercial capital. T&D is difficult to reach for private investment due to the occurrence of natural monopolies and the preference of local and national government to retain strong control in this domain. As a consequence, there are only a handful of private investors in this sector. At the same time the interventions are so capital intensive that public sector financing does not fully meet the financing needs, and private capital is required. Due to this, there is strong potential for DFIs to make strong contributions, and they do so in several ways.
First, DFIs can provide capital to unattractive markets where both the capital and human needs are great. Second, they can provide a market-demonstration effect, instilling some degree of comfort in commercial investors. Third, they can facilitate investments by providing a blueprint for how to structure investments in T&D.
BII’s investment in Umeme was ground-breaking and highly impactful. There was a drastic reduction in line losses from 35% in 2009, down to 19% in 2015, at the same time as cash collection surged from 70% to 98%. Furthermore, the revenues increased over time from US$200 million to US$350 million per annum. BII thereby contributed both a capital and a market-demonstration effect. BII hoped to apply the lessons learnt from Umeme and repeat the successes achieved with yet another T&D investment, this time in Cameroon. BII was the only investor alongside Actis in Eneo, and Cameroon was considered a challenging environment. In this case, BII’s role was in providing critical capital, and the positive development impact this has is apparent; however, the market-demonstration effect has yet to materialise.
These initial forays into the T&D sector were made through funds in which BII was either the anchor investor or the largest investor by a margin. To further accelerate and facilitate investments in this sector they have now initiated Gridworks. Other DFIs and institutions have previously shied away from these type of deals because of a limited understanding of how to structure them. With Gridworks, BII intends to deliver a roadmap which would remove or reduce the bottleneck of greater inflows, and facilitate greater participation in the T&D sector in the years to come.
Transport impact pathways
BII’s Transport investments mostly contribute to additional capacity and improved service delivery. With its Transport portfolio, BII contributes to the development, operation and maintenance of 53.2 million metric tonne (MT) of port capacity, and 5,289 km lanes of toll roads. This road capacity is roughly equivalent to a four-lane highway between Delhi and Mumbai.
Two aspects are worth highlighting for a better understanding of BII’s contribution to the development of transport infrastructure in invested countries and their impact pathways. First, the Transport portfolio largely consists of investments in existing infrastructure assets, and expansion of the infrastructure is achieved in some of them these investments. For instance, about one-third (17 out of 53.2 MT million) of the total port capacity under management, and about half (2,900 out of the 5,289 km lanes) of the total road capacity are new capacity.
Second, the impact potential of additional capacity differs per country. For instance, even though the larger number of road and port assets are managed in India, it is in countries such as Gabon and Mauritania that BII’s relative contribution to the country infrastructure stock is most significant. In these smaller countries BII can significantly support the expansion of maritime and in-land trade, and the associated spill-over effects in the local economies. In contrast, BII investee assets in India account for a large share of the overall capacity addition (i.e. more than 50% of the BII total), but are part of a much more developed infrastructure network. This means that BII’s relative contribution remains limited (i.e. 5% of the total toll road stock). Finding investable port and logistic deals in countries with a less developed infrastructure can be challenging. In the text box below, we outline how BII has been learning from previous mistakes, and subsequently expanding its port and logistic portfolio.
Learning from mistakes – port and logistics investments
After a top-down sector mapping of the African logistics sector, BII made its first foray into port-related infrastructure through its 2014 investment in a JSE-listed conglomerate. The investee had three main lines of business, banking, shipping and ports and logistics. The DI thesis was that BII would later co-invest to support the company’s ‘pit-to-port’ strategy, aimed at supporting bulk mining flows by rail, going to and from mining regions in Zambia and Democratic Republic of Congo (DRC), as well as Sierra Leone, Liberia, Cameroon, and Congo-Brazzaville. In addition, BII would support planned expansions of ports in South Africa, Mozambique, and Namibia.
However, the port-to-pit strategy was abandoned, and the company switched to asset-light freight services. BII divested in 2019, leaving behind improved environmental and social (E&S) procedures (through its value addition in E&S) while taking away a key learning: a 1% ‘foot-in-the-door’ strategy does not give BII enough leverage to realise a development objective in a single business line inside a diversified conglomerate. This and other learnings from the investment were integrated in BII’s Africa Ports and Logistics Strategy of 2017. Based on that strategy, BII’s ports and logistics portfolio has expanded to Gabon, Mauritania and Tanzania. It remains difficult, however, to find viable port investments.
The other impact pathways are not relevant to BII’s Transport portfolio. In fact, BII does not invest in transport assets that directly reach customers (e.g. rural roads or urban transport), nor in assets with an explicit climate smart infrastructure, or resource efficiency impact angle (e.g. electric, urban transport).
An outlier in the transport portfolio: Ecom Express
In 2019 BII invested in Ecom Express, an end-to-end logistics solutions provider to the Indian e-commerce industry. BII’s capital supports Ecom Express in the expansion of its warehouses and distribution centres. Ecom Express is a one-of-its-kind investment in BII’s transport portfolio. As such, its interaction with the impact pathways and more broadly with BII’s infrastructure impact framework is somewhat different when compared to the other investees in the transport sector.
Similar to other transport investments, Ecom’s main impact pathway is additional capacity in terms of expansion of the company’s logistic facilities. However, while most of the ultimate impacts of transport infrastructure assets are supported at the broad country level through long and complex impact pathways, Ecom Express supports a large and growing number of jobs directly at its premises. Additionally, Ecom Express supports employment specifically for people out of the labour force, with a geographical focus on tier 2 and tier 3 cities. Ecom Express grew particularly fast during the COVID-19 pandemic, and created a lot of employment, particularly jobs that were suitable for new entrants in the labour market.
While it is unique to BII’s infrastructure portfolio, Ecom Express is not a unique player in the market. BII may consider opportunities for similar investments in different countries. However, a strong infrastructure ecosystem is a prerequisite for e-commerce logistic companies to thrive; Ecom’s business models critically depends on the presence of an adequate transportation network and a considerable broadband penetration and functionality, which in turn requires a reliable access to power.
ICT impact pathways
Investments in broadband access also contribute to an expanded infrastructure capacity, to customers reached and, to a lesser extent, reduced prices.
For mobile broadband, BII investees have more than 33,000 towers under management across Africa and Asia. Jointly, the investees make an especially large contribution in Nigeria, Cameroon, Côte d’Ivoire, Rwanda and Zambia. In all these countries BII investees manage above 40% of the total number of towers in the country. It should be noted, however, that these are often brownfield investments on the acquisition of existing assets, rather than greenfield developments. More specifically, these investments often relate to the purchase of towers from mobile operators by a TowerCo, for subsequent rental to the same mobile operators and if possible new mobile operators. These are financial deals that allow telcos to reduce their capital expenditure and focus more on their core business. Similarly with respect to the development of a fixed broadband network, BII has about 110,000 km of fibre under management, of which about 15% involves the construction of new backbone cable.
With the additional capacity supported in fixed and mobile access networks, BII reaches new customers. This impact pathway can be easily quantified for FTTH and ISPs, in terms of new internet connections created. As well as reaching households, fixed access networks are also key for the local business sector. While reaching customers is at the core of tower investments, quantifying the number of customers reached through tower investments remains more challenging and would require more granular data on the location of invested towers, as well as on the use of them by mobile telephony operators.
Finally, while reducing prices is an important impact pathway for all broadband related investments, the data is only available for a small number of investments and points to a substantial degree of variability between countries. It is therefore not possible to aggregate mobile data prices in a meaningful way with the currently available data (see the textbox below).
Tracking affordable internet connectivity
Some BII’s investees have an explicit impact objective which is to bring affordable connectivity outside urban areas. For instance, WorldLink in Nepal aims to reach households and SMEs outside the Kathmandu valley. Beyond creating new connections, the price at which broadband connectivity is offered is also crucial, especially if the desired impact includes offering a service to low-income customers.
In general terms, the relationship between broadband penetration and data basket prices is not straightforward. (ITU, 2020). In BII’s FTTH and ISPs portfolio, direct data is insufficient to reach a conclusion on affordability due to a lack of harmonised reporting on this issue. For instance, WorldLink shows an increase of 15% in prices since 2018, but the reported figures are inconsistent across different years as different services were included in the packages. Another example is Frontiir in Myanmar, which monitors the average monthly cost to users. The data shows how the prices for CPE (customer premise equipment) customers has decreased by 65% since 2017. However, as these figures are not rated per Gbit, the observed trend could also indicate a change in usage rather than in pricing and service affordability. The most logical indicator to track for harmonised reporting is the average price basket per Gbit of data. Additionally, benchmarking company data against the country-level prices could provide insights into the service affordability over time.
Myanmar and Nepal, two of the countries where BII is directly invested in FTTH and ISPs, show different trends on ICT price data at the country level (ITU, 2020). In Nepal, fixed data is on average reasonably affordable with data basket prices at 2% of the gross national income (GNI) per capita. However, prices in Myanmar remain high at 10% of the GNI per capita, despite a slight decrease over the past three years.
5.3. Performance against DI thesis
Since 2018 BII formulates a development impact (DI) thesis for each investment. For earlier investments, a DI thesis was retrofitted (as explained in Section 2.3). The evaluation team has assessed the extent to which BII investments are on track to realise their respective DI thesis. In terms of the BII Infrastructure Impact Framework, DI theses and targets across the portfolio are quantified for the outputs at the impact pathway stage. Quantified physical outputs mainly refer to additional capacity, cleaner capacity and customers reached. Expectations for the outcomes, such as increased access and improved quality and reliability, and ultimate impacts are typically more qualitative.
Aside from the nine investments (including one fund) considered too early to be assessed, most of the investments (80%) are on track or have outperformed their DI thesis. The results are summarised in Table 5.
Table 5: Performance of investments against DI thesis [footnote 77]
| DI performance score | Number of investments | Fraction | Cumulative |
|---|---|---|---|
| Excellent | 2 | 4% | 4% |
| Above expectations | 10 | 22% | 27% |
| As expected | 24 | 53% | 80% |
| Below expectations | 8 | 18% | 98% |
| Failure | 1 | 2% | 100% |
| Too early to tell | 9 | - | - |
Based on detailed analysis, the following observations can be made:
- investments in Asia score better than in Africa: all nine underperforming assets are located in Africa, while five investments there have over-performed. In Asia, 5 of the 15 investments are rated as above expectations or excellent, and the remaining 10 are as expected
- in summary, most Power investments are on track, seven are below expectations, two are above expectations, one is excellent and the remaining ten are in line with expectations
- ICT investments score better than Power investments; six are as expected, while two are above expectations
- transport investments show the most variation, with one failure, one above expectation and one excellent
- debt investments largely perform in line with expectations (13 out of 19), with five below and one above expectations. The performance of equity investments in contrast is much more heterogeneous, ranging from a single failure to two excellent ratings
- the 14 fund investments show little variation, one is below expectations, eight are as expected and five are above expectations
- given the long lead times of many infrastructure investments, it is too early to discern a clear trend over time; pre-2018 and post-2018 investments largely score the same [footnote 78]
It is no coincidence that both African investments and Power investments are somewhat off-track in aggregate. In the Power sector the influence of the regulatory environment and the possibility of delays are significant, particularly in Africa. Excluding the investments that are too early to assess, 13 of the 20 Power investments were made in Africa. The 13 Power investments constitute almost half of all rated investments in Africa.
Based on investment documentation and interviews with Investment Managers, the evaluation team explored the extent to which under-performance or over-performance can be attributed to internal and external factors (Table 6). Although the small numbers and the limited in-depth view that emerges from investment documentation do not allow for definitive conclusions, it seems that both under- and over-performance are mostly driven by internal factors such as strategic fit and implementation skills. External factors such as macro-economic and geopolitical contexts and the regulatory environment do explain some of the observed under-performance, especially in Africa, as has been previously mentioned. Each of these factors cover a wide range of different aspects, which is illustrated using several examples in the textbox below.
Table 6: Drivers of DI thesis under and over-performance
| Negative factor impact and underperforming investments | Factor | Positive factor impact and over-performing investments |
|---|---|---|
| 3 | Macro-economic and geopolitical context | - |
| 2 | Regulatory environment | 2 |
| 5 | Implementation skills | 10 |
| 3 | Strategy fit with market | 6 |
Given the difficulty of many countries in which BII invests, we view the 80% on track or better DI performance of the portfolio as positive. We note that this score does not reflect the actual level of impact. For instance, an ambitious DI thesis against which an investment is off-track, could be on track to achieve greater impact than an on-track investment with a less ambitious DI thesis. Moreover, we think the DI performance provides a limited, ‘moment in time’ view, rather than a final view of the portfolio. A succinct DI thesis cannot capture the different pathways, outcomes and impacts associated with an investment, nor does it capture the influence of external factors. This can be seen with the platform and fund investments, where the rating amalgamates the development impact of many different assets; the rating expresses the extent to which the fund manager assembled a portfolio that supports the DI thesis. In addition, infrastructure investments are large, and taken together with the long lead times this means that there is only a thin line separating below and above expectation. This does not mean that DI theses are not valuable; on the contrary, it is both useful and necessary to have a well-formulated idea of the intended impact from the outset. However, it is essential not to use these DI theses as the single or most important reference points, rather as one of several yardsticks against which to assess the DI performance of a particular investment.
Lessons learnt from investments in three different IPP platforms
One of BII’s comparative advantages when it comes to infrastructure financing is its ability to provide equity capital. In many developing countries, and especially in Africa, the lack of bankable projects is a greater obstacle to closing the infrastructure gap than a lack of finance, and the development of new projects requires equity capital.
Apart from equity capital, the development of IPP projects also requires specific skills and risk management. BII has therefore made equity investments in three investment platforms: Globeleq (2015), the African Power Platform in Africa (2017) and Ayana (2018) in India. Although similar in objective, the three platform investments and BII’s role in them are very different:
- Globeleq: own and develop. BII (together with Norfund) bought a developer which it had indirectly owned before through Actis Infrastructure Fund Through direct ownership, BII’s ambition was to be able to exert directional influence in addition to having an economic interest
- Africa Power Platform: buy-in and follow. BII partnered with The Aga Khan Foundation for Economic Development. Because of its deep local connections, the platform was not expected to become a very large platform, but rather to develop projects in some of the most difficult areas
- Ayana: build and transfer. BII launched Ayana in 2018 because it could not enter in other platforms for commercial, Business Integrity and strategic alignment reasons. The platforms pipeline developed much faster than expected and after little more than a year BII gave up its majority position in order to leverage a larger pool of finance to realise the pipeline
Two lessons that can be drawn from these investments are:
-
Power in Africa is lumpy which makes the line between over-performance and under-performance against the DI thesis a thin one. A single project can move the needle substantially. A good example is the Ruzizi Hydroelectric Power station. Once constructed it will deliver power to Burundi, DRC and Rwanda, but realisation is a complex process whereby three governments need to agree on many aspects.
-
Ambition levels matter but are hard to define because of external conditions. In part due to the standardised bidding process in India, Ayana’s pipeline developed beyond BII’s capability to finance it. BII diluted its shareholding and holds a minority share. By way of contrast, in Africa, projects require many negotiations with governments and stakeholders, and the opportunities to do so are prone to delays and surprises.
Example of the influence of internal and external factors on DI performance
| Issue | Negative influence | Positive influence |
|---|---|---|
| Macro-economic and geopolitical context | Contraction of market demand for solar home systems make DI targets hard to achieve. Culture of corruption in-country holds back company performance and achieving DI targets | Government keen to reach renewable goal positively affects collaboration and business climate. COVID-19 causing great increase in demand for e-commerce enabling company to reach target years ahead of target. Government as co-shareholders helped project to run on time and achieve DI targets |
| Regulatory framework | Tariff setting by regulator prevents price reduction for end customers. Regulatory framework for new IPP development in Africa is heterogenous and not always dependable. Government not adhering to merit order, thereby reducing DI. Absence of regulatory framework for C&I hinders switch from unreliable grid and diesel generators to solar | Clear policy framework around renewable energy in India allows. Bidding process for new IPPs in India is very standardised enabling scaling of platform |
| Implementation and skills | Delay in non-renewable IPP becoming operational, thereby shortening the period in which it performs its intended role as a bridge until a hydro plant is up. Inability to change CEO likely held back performance, and DI and replication of best practices shown elsewhere. Fund team with wrong background for equity investments in new areas and sub-sectors | Strong leadership and cost-efficient model enable fast roll-out of broadband in-country to underserved segments. Technical assistance from BII and other funders prevented many social and labour and environmental risk and issues which could have been substantial given the size of project |
| Strategic fit | Small equity stake in public company to back one part of strategy which did not materialise. Power oversupply and price of technology have come down over time of project rendering it relatively expensive. This may hinder achieving DI and GHG targets. Dependence on one sector (tourism) affects performance of assets backed by BII, especially during COVID-19. Difficulty of fund to close deals in BII target countries thereby negatively affecting DI | Building a port in-country where current capacity is fully used so guaranteed increase of port throughput. IPP Platform strategy with both operating and development projects is synergistic and good from a risk perspective. Focus on tier 2 and tier 3 cities in India means less competition and creates employment where it is much needed |
5.4. BII’s value addition activities
Because of the importance of BI and ESG factors, especially in infrastructure, the report provides an overview of BII’s value addition activities, which is the second pillar of BII inputs besides capital. This pillar also includes the value addition through technical assistance and support provided via BII Plus. Because the nature of these interventions is investment specific, an evaluation of the effectiveness of these interventions is beyond the scope of this Portfolio Review.
Business integrity activities
For all 39 direct investments the BII risk-based BI due diligence process was performed. This includes red flag research, internal risk rating, policy/process review as part of controls assessment and external due diligence where appropriate. BI matters were also discussed at all stages of the Investment Committee process, and appropriate know-your-client documentation was collected on the investee and the ultimate beneficial owners prior to signing.
In addition, for 30 direct investments BII’s BI team made more in-depth interventions, such as: (i) engagement with BI counterparts; (ii) integration of BI-related clauses in legal agreements; and (iii) development of BI action plans. More detailed interventions such as know-your-client updates and site visits were performed for a limited number of investments. An overview of these interventions is provided in Table 7.
Table 7: Business integrity interventions in BII’s direct investments [footnote 79]
| Issue | Number of investments | % (39 = 100%) |
|---|---|---|
| Engagement with BI contact | 29 | 74% |
| Legal arrangements | 26 | 67% |
| Action plan | 25 | 64% |
| Site visit | 13 | 33% |
| Know-your-client refresh | 12 | 31% |
| Audit | 8 | 21% |
| Training | 8 | 21% |
| Investigation | 6 | 15% |
| Governance change | 3 | 8% |
For funds, the main value-adding activities include annual BI reporting, training, ad hoc advisory and routine monitoring. The most common general BI risks that were identified and monitored are: bribery and corruption (24 instances), fraud (eight instances) and reputational risk (seven instances). Infrastructure specific BI risks encountered were: interactions with government and regulatory agencies (16 instances), obtaining licences and permits (six instances) and land and property acquisition (give instances). Counterparty risks were encountered less frequently.
Environment, social and governance activities
ESG contributes primarily to promoting DI through preventing risks from occurring, reducing the negative impact from risks once they materialise, and enabling management to focus on delivering on the company strategy and related impact. ESG risks that remain poorly identified, understood and mitigated, otherwise run the risk of undermining an investment and eroding its impact potential. The success of a well-conducted ESG intervention might be more challenging to observe as it primarily revolves around the absence of negative impact, rather than the creation of positive impact. Well-performed ESG analysis and interventions are instrumental to enable DI. BII’s role in direct investments and fund investments is quite distinct and are discussed separately below.
Direct investments
The level of involvement of BII’s ESG team with a direct investment depends on the ESG risk level and the client’s existing procedures and practices to mitigate these risks. For every investment, BII performs a due diligence process which involves assigning an internal risk rating, an analysis of the ESG management systems and procedures and routine monitoring. Additional levels of more extensive involvement may be required in some cases and include: (i) a more in-depth due diligence and monitoring on (some) ESG aspects; (ii) prescribing and/or making investee-specific ESG interventions; (iii) playing a generally more active assistance and monitoring role; and (iv) making intensive and proactive interventions and monitoring to help mitigate the greatest risks.
Table 8: ESG – Level of involvement of BII ESG team with direct investments [footnote 80]
| BII interventions | Number of direct investments | % |
|---|---|---|
| BII ESG due diligence and monitoring | 39 | 100% |
| More detailed ESG due diligence and monitoring performed to be adequate for level of E&S risk/impact | 23 | 59% |
| Deal-specific E&S interventions made | 9 | 23% |
| Generally active role (relative to BII stake) | 9 | 23% |
| Intensive and proactive interventions/monitoring | 11 | 28% |
Exhibit 13 shows the prevalence of different types of risks in terms of the IFC performance standards. Not surprisingly, labour and working conditions (PS 2) are the most frequently occurring risks, followed by the quality of the ESG management system (PS 1) and resource efficiency and pollution prevention (PS 3). Common to infrastructure projects, land acquisition and involuntary resettlement and biodiversity are relatively frequent in BII’s portfolio. BII has not encountered risks around indigenous people or on cultural heritage. The text box provides detailed information on BII’s ESG interventions in its infrastructure investments, categorised along the performance standards.
Exhibit 13: Prevalence of ESG risks categorised by the IFC Performance Standards
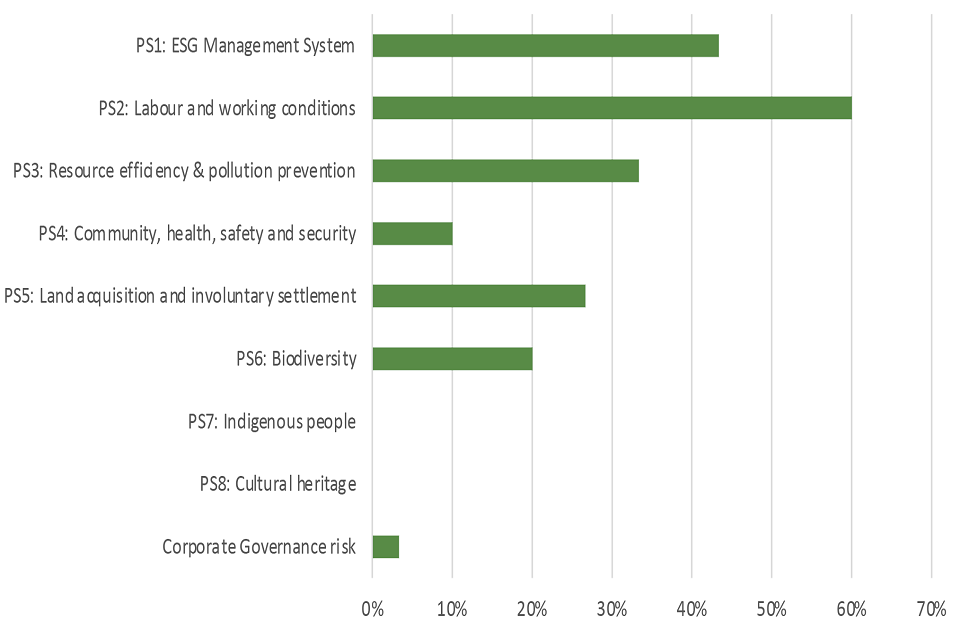
Exhibit 13
Fund investments
Where the BII ESG team is involved in deal-specific aspects, its work with funds focuses on efforts to improve the environmental and social management system (ESMS). Of the ten funds for which we received information, the quality of the ESMS before BII’s involvement was deficient for three funds, two funds suffered from material gaps, four funds had minor shortcomings and one fund was robust. The ESG team focused on improving the deficient funds and those with material gaps. As a result, only one of the ten funds still suffers from material gaps and the other nine suffer only from minor gaps or are robust. The quality of the ESMS has no direct correlation with the number of serious incidents that occurred, most likely because E&S risk depends more directly on assets that are invested, than on the quality of the ESMS of the fund manager. BII still required one fund manager that suffered the loss of an asset due to social risk, to hire full-time ESG managers and to establish an ESG subcommittee to provide guidance on pipeline deals and the portfolio.
Some examples of ESG interventions and their results
ESG management system (PS 1): putting E&S teams in place; helping companies in setting up E&S management systems and occupational health and safety plans; negotiating supplementary corrective action plans to address challenges; on-site monitoring of E&S issues.
Labour and working condition (PS 2): providing training on social risk and job protection; discussions with the safety and health committee of the company board to focus it on reducing accidents and fatalities; extending labour and working conditions to sales agents (gif workers); help develop COVID-19 protection procedures; implementation of monthly labour compliance reporting.
Resource efficiency and pollution prevention (PS 3): providing support on how to deal with electronic waste generated by off-grid power solutions; work with industry associations to develop a position statement as input for Kenya’s 2013 e-waste bill; develop customer incentives on decentralised repair and collection and recycling.
Community, health, safety and security (PS 4): helping company deliver nature-based solution to provide livelihoods for local community and asset protection from severe weather events and other climate change-related hazards.
Land acquisition and resettlement (PS 5): continuous engagement with sponsor organisation to improve monitoring of livelihoods of affected people; E&S due diligence requirement to correct shortcomings of resettlement action plan; provide guidance on how the company should conduct audit and vulnerability assessments; exerting pressure on the company to pay out severely delayed compensation to households; interventions to assure alternative and secure housing and access to amenities for people that were previously disrupted by projects; and implementation of livelihood restoration programmes.
Biodiversity (PS 6): establishment of a biodiversity baseline; engagement with the company to manage potential impacts on fisheries; support achievements on biodiversity led by IFC.
Corporate governance risk: strengthened board governance of ESG and helped the company pivot towards renewable energy to manage the transition risk associated with greater alignment with the Paris Agreement.
BII Plus activities
As part of BII’s value addition activities, BII Plus operates a dedicated technical assistance (TA) and support facility, with the objective of making a lasting difference to the lives of underserved groups. Leveraging BII’s experience as an investor in emerging markets, BII Plus identifies and creates impactful opportunities that are beyond the scope of returnable capital.
Since its launch in 2015, BII Plus has maintained an active portfolio of TA projects, especially in in the commercial and industrial (C&I) power sector and the solar home system sector. TA projects have largely focused on energy access and efficiency investees, in particular catalyst investments. Many of these investees are early-stage companies and a significant number are intermediated through BII’s investments in funds.
The BII Plus infrastructure-related TA portfolio consists of US$2.47m in completed and active project commitments across 43 projects. Of this, US$1.25 million went to 20 projects in 10 investee companies that are included in this evaluation. TA projects with C&I and home solar investees have included:
- capacity building on key business areas including legal, finance, Human Resources and ESG
- supporting the development of improved systems and processes, such as credit risk management, field staff management and supply chain management
- feasibility studies, market expansion analyses and risk assessments
- piloting innovative business models and products, including credit scoring, algorithms and geospatial mapping tools
A good example of BII Plus involvement is Virunga Energy, as described in the textbox below.
Case study: TA support to Virunga Energy
One example of direct TA for a BII investee is the ESG capacity-building programme with Virunga Energy, the aim of which was to help it develop its own Congolese E&S team and E&S management function. A bespoke capacity-building programme was designed and delivered, covering a range of topics including workplace health and safety, labour practices and local contractor due diligence, and the importance of community engagement. Virunga now employs a dedicated E&S team and has developed a robust E&S management system, and engagement with the local community has considerably improved.
BII Plus also supports impact opportunities to support the wider market beyond the BII portfolio, with a total spend of about US$1.23 million. One such project has been with GOGLA, the global association for the off-grid solar energy industry. BII Plus technical assistance supported the development of industry-wide consumer protection principles, and has now has progressed to include work on e-waste management, PAY-GO principles and key performance indicators, as well as supporting the publication and dissemination of industry consumer insights.
6. Portfolio evaluation based on themes
Summary
- depending on the type of impact, 60–90% of ultimate development impact is achieved in 10 countries. This concentration is in line with the concentration of British International Investment’s (BII) capital disbursements
- BII investee companies jointly support more than 1% of the country labour force in seven countries
- in terms of its capital disbursements relative to all private sector infrastructure investment, BII plays an outsized role in Uganda, Cameroon and Côte d’Ivoire, and a sizeable one in Kenya and Mauritania
- when assuming country needs for a particular type of infrastructure as inversely proportional to the presence and adequacy of infrastructure, we concluded that BII has targeted its power investments, and to a lesser extent its ICT investments, in a positive way from a DI perspective. BII can improve its efforts in Transport BII, although regional or even local conditions tend to be more important the more important factor
- BII’s Power portfolio has moved towards renewable energy, and about 48% of BII’s currently active IPP portfolio is in renewable energy. Using the BII-signed PCAF methodology, attributed annual avoided and actual emissions are 4.6 and 6.4 million tonne CO2e respectively
- by using the attribution methodology used for climate impact, we demonstrate the importance of attribution for the other impact areas. On average, about 13% of the impact results per country can be attributed to BII, but variation is considerable, ranging approximately from 3% to 30%
- BII has made a strong organisational commitment to gender equality, including within the infrastructure portfolio, and provides investees with support to improve their own operations. However, there is a fairly low level of reporting against gender indicators and the indicators used relate to investees’ own operations rather than results in the impact framework
In this section we will look in greater depth at British International Investment’s (BII) development impact along six themes. These themes have been chosen based on both BII’s general and infrastructure strategy. The most prominent observations are summarised for each theme.
6.1. Theme 1: Geography
In this section the ultimate impacts described in Section 5.1 are broken down in terms of geography. The focus here is on the economic opportunity and standard of living impacts. The climate impacts are discussed in greater detail in Section 6.4. It is important to note that the impacts discussed here are cumulative for all BII investee companies, and are discussed without considering the size of BII’s stake.
Two geographic perspectives are taken: (i) the relative contribution of countries to BII’s portfolio-wide impacts; and (ii) the relative contribution of BII investees to the impact in countries. The overall picture that emerges is that the ultimate impacts are evidenced in a limited number of countries, in line with geographical focus of the portfolio. It also appears that in comparison to the size of the economy and labour force, BII investees play a relatively large role in a small number of predominantly medium-sized countries.
Relative contribution of different countries to BII’s portfolio-wide impact
Table 9 shows the 10 countries that make the greatest contribution to BII’s cumulative economic opportunity and standard of living impacts. All countries are also in the top 10 of countries in terms of BII disbursements (see Exhibit 3), except for Nepal and Gabon where the large impact is caused by BII having relatively smaller stakes in some large assets in the country. The GDP, jobs and people reached in the top 10 countries make up 84%, 91% and 61% respectively of the total impact, which means that the concentration of impacts is comparable to the concentration of BII’s disbursements. The large impact in India is commensurate with BII’s disbursed capital, whereas in Nigeria the large impact comes from investee companies in which BII has a relatively small stake (this will be explored further in Section 6.5).
Table 9: Economic opportunity and standards of living impacts by country and share of BII total
| Country | GDP (US$ m) | GDP (% of total) | Jobs (’000) | Jobs (% of total) | People reached (’000) | People reached (% of total) |
|---|---|---|---|---|---|---|
| India | 5,436 | 31 | 967 | 28 | 47,242 | 14 |
| Nigeria | 3,488 | 20 | 538 | 15 | 12,777 | 4 |
| Cameroon | 1,483 | 8 | 435 | 12 | 22,807 | 7 |
| South Africa | 1,427 | 8 | 64 | 2 | 1,468 | 0.4 |
| Côte d Ivoire | 1,002 | 6 | 167 | 5 | 7,794 | 2 |
| Gabon | 947 | 5 | 48 | 1 | 62 | 0.0 |
| Kenya | 885 | 5 | 222 | 6 | 15,257 | 5 |
| Uganda | 667 | 4 | 318 | 9 | 9,670 | 3 |
| Bangladesh | 484 | 3 | 112 | 3 | 8,330 | 5 |
| Nepal | 204 | 1 | 118 | 3 | 5,540 | 2 |
BII has categorised the African countries and Indian states into four categories. ‘A’ countries are the hardest to invest in and ‘D’ countries/states the easiest. For India, BII has made this classification based on individual states, rather than at country-level. For some assets within India (about half of total disbursements), no detailed information is available on the exposure to different states. However, the exact location is not of much relevance for the largest infrastructure sub-sector, IPPs. Table 10 shows that more than half (53%) of BII’s investment is outstanding in A/B countries. As part of the US$316 million in India for which we cannot determine the specific state, will be in an A/B state, this number is likely to be higher. The share of GDP and employment impact of investee companies in A/B regions is 44% and 56% respectively, in line with the higher employment intensities in poorer countries. In terms of people reached, 65% are in A/B countries. About a third of the total people reached is estimated to be below the national poverty lines, with the larger share (68%) in A/B countries.
Table 10: Breakdown of BII investment and ultimate impacts of investee companies by country investment difficulty
| Indicator | A | B | C | D | Not classified |
|---|---|---|---|---|---|
| BII investment (US$ million) | 634,500 | 613,003 | 530,752 | 250,512 | 316,514 |
| BII investment % | 27% | 26% | 23% | 11% | 13% |
| GDP (US$ million) | 4,234 | 3,431 | 4,619 | 2,399 | 2,891 |
| GDP % | 24% | 20% | 26% | 14% | 16% |
| Jobs (thousands) | 991 | 973 | 768 | 231 | 529 |
| Jobs % | 28% | 28% | 22% | 7% | 15% |
| People reached (thousands) | 60,579 | 38,596 | 31,291 | 18,524 | 2,572 |
| People reached % | 40% | 25% | 21% | 12% | 2% |
| People reached below national poverty lines (thousands) [footnote 82] | 19,530 | 11,653 | 9,536 | 4,550 | 563 |
| People reached below national poverty lines % | 43% | 25% | 21% | 10% | 1% |
Relative contribution of BII investees to GDP and employment in countries
Both the investee companies and the countries in which BII invests demonstrate considerable heterogeneity with respect to their size. It is therefore instructive to look at the relative impact contribution of BII investees in the countries in which they operate.
Exhibit 14 shows that there is a considerable range in BII investees’ relative employment impact as well as in the sectors where they come about. While in Cameroon it is mostly power companies that contribute to employment (in IPPs through Globeleq, Nachtigal and in T&D through Eneo), in Gabon the contributions come from the Transport sector (Owendo Port and the Transgabonaise highway). In Cameroon the contribution through the Telecoms sector is considerable but relates to only a small investment amount on the part of BII. Although BII invests about seven times as much in Cameroon as it does in Gabon, the relative impact in Gabon is larger because the country’s labour force is only one tenth of Cameroon. The pattern for GDP is by and large the same as the one shown for employment. Other countries where BII investee companies make relatively sizeable contributions, and where BII’s investments are also large are: Ghana, Côte d’Ivoire, Uganda, Nigeria and Kenya. Although BII invests about 2.5 times more in India than in the next biggest country, Uganda, the relative size of its impact is smaller because of India’s size. To a lesser extent this is also true for South Africa.
The overall picture of BII investees playing a relatively large role in a small number of small and medium-sized economies will be further substantiated in the next section, where we look in greater detail at the contribution of BII’s capital, relative to the investments of the private sector in infrastructure.
Exhibit 14: Jobs supported by BII investees as a percentage of country labour force
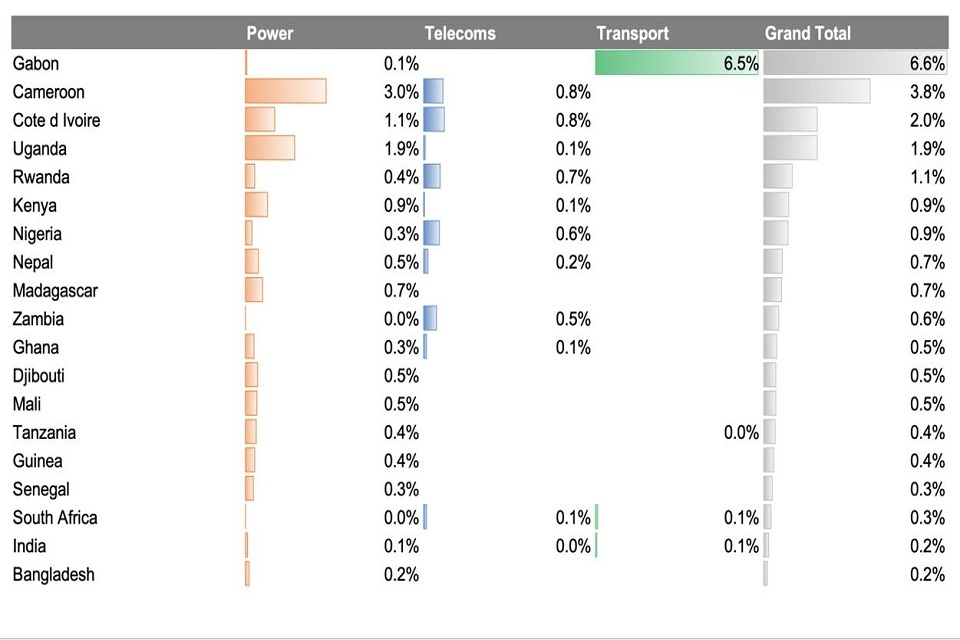
Exhibit 14
6.2 Theme 2: Contribution to private infrastructure investment
In the previous section we discussed in detail the cumulative impact of BII investees irrespective of the size of BII’s investment. While it shows that investees deliver development impact, it says little about the importance of BII’s capital for filling the infrastructure gap in general, and privately financed infrastructure in particular. A good, albeit somewhat imprecise, indication of BII’s relative contribution to infrastructure investments per country can be constructed from the World Bank’s Private Participation in Infrastructure database (PPI) [footnote 83].
The horizontal axis of Exhibit 15 (overleaf) uses the PPI data over the time period 2007–2020, to assess BII’s relative contribution to infrastructure investments in each country. Although BII’s relative contribution is likely overestimated [footnote 84] due to the incompleteness of the PPI database, it does provide an indicative picture of where BII’s capital plays a particularly important role. Despite India being the largest destination of BII’s infra investments, the size of the country minimises BII’s relative contribution, which confirms the observation that was stated in Section 6.1. Conversely, BII’s capital plays an outsized role (>5%) in Uganda, Cameroon, Côte d’Ivoire and in Kenya.
It is important to bear in mind that infrastructure projects with private participation only represent a fraction of the total (private and public) spending on infrastructure. Accurate data on the fraction of private participation in all infrastructure investment is not available, but based on a World Bank report and by looking at the countries where BII has its greatest exposure, a realistic estimate is 10–20% [footnote 85]. Assuming the lower figure of 10% (to compensate for the underestimations in the PPI database), this means that BII contributes some 0.01% (i.e. 10% of 0.1%) of all private and public infrastructure investment in India, compared to about 1.0% (i.e. 10% of 10%) in Uganda.
Exhibit 15: Relative employment contribution of all investees versus BII infrastructure investments as a fraction of all infrastructure investment with private participation for most relevant countries [footnote 86]
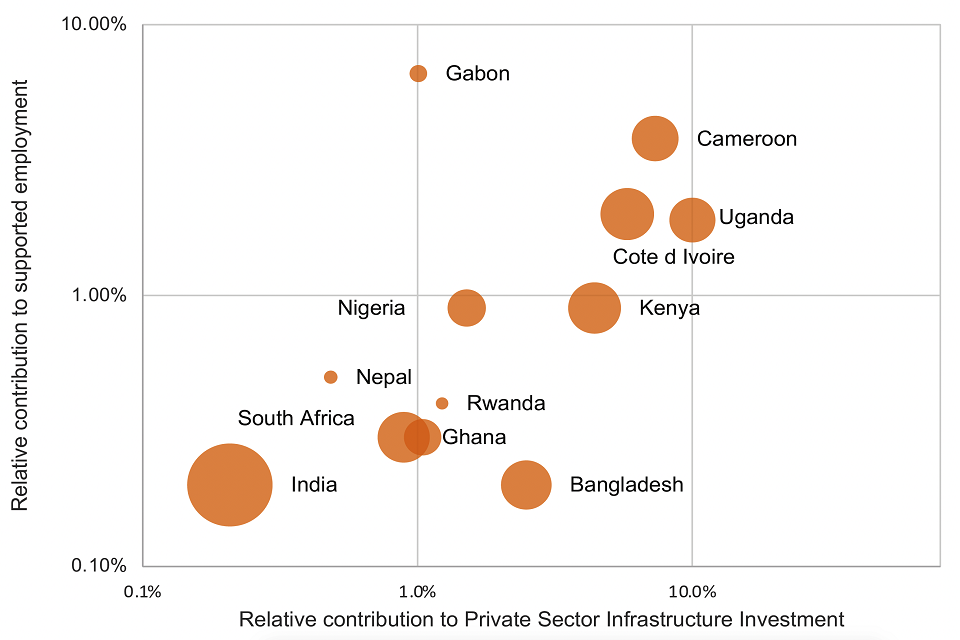
Exhibit 15
BII’s large contribution to private infrastructure in Cameroon
Cameroon is a country in which BII contributes substantially to private sector infrastructure investments. Most of the capital is invested in IPPs through Globeleq, which is 70% owned by BII, and its financing of the large hydropower plant Nachtigal.
BII is invested in nine plants, with a cumulative capacity of 1,725 MW capacity. This capacity constitutes 91% of the total 1,891 MW installed. When fully in production these assets will collectively generate approximately 9,416 GWh, which is more than Cameroon’s total current power production.
Through Actis, BII is also invested in Eneo, the country’s transmission and distribution (T&D) company. Whereas private participation is quite normal in IPPs, it is much less common in T&D which are typically publicly held companies. There is a need for investment in T&D across Africa to improve the efficiency and safety of the networks. Actis’ involvement in Eneo follows on its successful investment in Umeme, which was exited in 2014. BII has also invested, through a fund, in a company that builds and operates telecom towers.
It was shown in Section 3 that equity investments (both direct and indirect) make up 69% of its infrastructure portfolio. In contrast, the PPI financing data consist largely of debt investments. For example, of all (not just DFI) infrastructure investments with private participation made in the first half year of 2020, 17% of capital was provided as equity and the remainder through debt. This observation is important from a development impact perspective. Whereas debt finance is typically used to finance the construction and operation of assets, equity investments are needed for the early and late development stages of projects. In many emerging markets, but especially in Africa, the infrastructure gap is caused more by a lack of bankable projects than by a lack of finance [footnote 87]. BII’s ability to invest in the earlier (and often harder) development stages is therefore an important source of development impact. Good examples of this are two IPP platforms, one which BII started (Ayana), and one in which it has a controlling stake (Globeleq). These platforms develop new Power projects, which are subsequently co-financed (with debt) by other financiers.
In countries like Cameroon, Côte d’Ivoire, Kenya and Uganda, where BII plays an outsized role, both with the amount and type of capital it has deployed (horizontal axis of Exhibit 15), and in terms of the impact of its investee companies (the vertical axis), we recommend that BII considers the development of country approaches. This recommendation is developed in Section 7.
6.3. Theme 3: How BII targets investments by country needs
Countries differ in terms of their most pressing infrastructure needs in ways that are not adequately captured by BII’s DI grid score [footnote 88]. To evaluate how effectively BII has targeted these needs we inferred the relative need of a country for a particular type of investment by ranking the country’s performance on indicators closely associated with that type of investment. For instance, the need for new power generation capacity is likely to be greatest in countries that suffer from substantial power outages, and/or where power generation is expensive. It should be noted that private investors can only be expected to fill a subset of these national needs because many projects are not investable and/or are provided by the public sector.
A total of 12 targeting indicators have been defined for all infrastructure sub-sectors, based on BII’s infrastructure impact framework [footnote 89]. All investments are subsequently grouped into quintiles based on their performance on the country on the chosen targeting indicator. It is worth noting that all countries in which BII is mandated to invest are already identified as being of greater need, and that this is an additional analysis of comparative need within the investment universe. It is also important to note that for some sectors, such as Power and ICT, the use of national-level indicators is more appropriate to establish needs than for other such as transport. In transport, needs tend to be much more geographically specific and cannot be inferred from the absence of, or inadequacy of infrastructure at the country level. This analysis is intended to provide a high-level overview of targeting at national level, and the evaluation team does not propose applying this methodology at the investment level without considering other (local) factors.
Exhibit 16 shows that the Power and ICT investments cover all quintiles, from large to relatively smaller needs. However, Transport investments are mostly in countries where the need for them is smaller. Given the substantial investments in Power, and to a lesser extent in ICT, which are made in countries that are in the first and second quintile of greatest need, we judge BII’s investment targeting for these sectors as reasonably effective from a DI perspective. Transport investments could be better targeted to include countries of greatest need. But as has been previously discussed, a needs-based assessment for transport infrastructure, especially toll roads which make up most of the fifth quintile investments, requires a regional rather than a countrywide analysis, especially when considering BII’s strategic focus on trade corridors. The limitations of the analysis in Transport notwithstanding, we think that this method can help BII to target areas of greatest need more explicitly. We are aware of the tension between the ideal development profile of deals and the limited number of investable opportunities.
Exhibit 16: BII investments reaching areas of greatest (first quintile) and smallest (fifth quintile) need
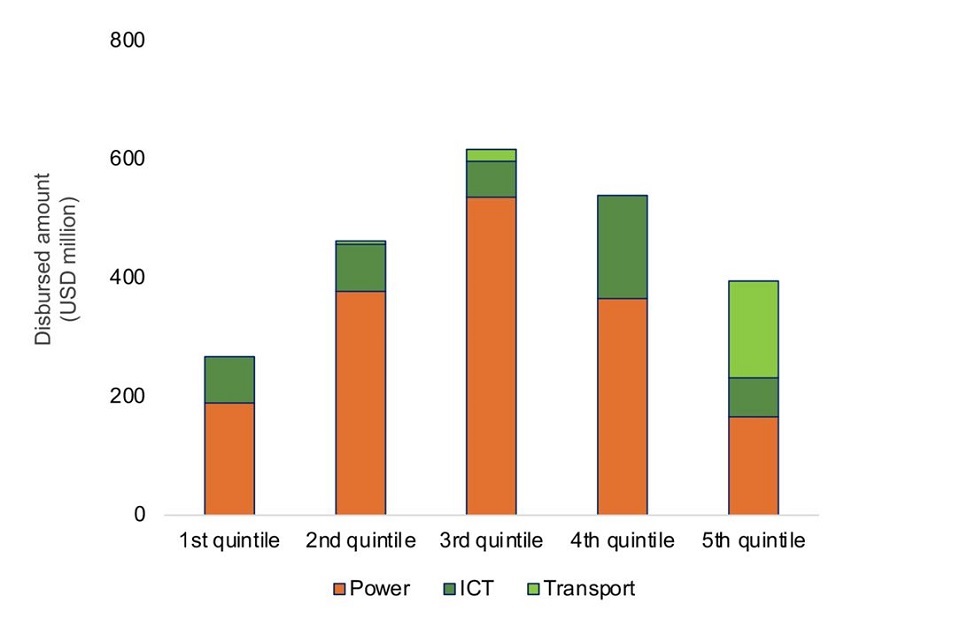
Exhibit 16
6.4. Theme 4: Climate
In its 2014 Climate Change policy, BII committed to consider climate change in each investment. In the same year, BII adopted its Coal Policy which excludes investment in coal-fired power plants except in exceptional circumstances. The 2018 HFO (heavy fuel oil) Policy did the same for heavy fuel oil plants. In 2020, BII presented its climate change strategy which included three building blocks: (i) the target of achieving net zero emissions by 2050, which is aligned with the 2015 Paris Agreement; (ii) a ‘just transition’ (decent jobs and skills); and (iii) adaptation and resilience.
BII has focused on the first of these, and excludes investments in the vast majority of the fossil fuel value chain. For example, it will not make any new investments related to coal and oil, whether in exploration, the associated transport structure or power production. While it also excludes gas exploration, it can invest in gas-fired power plants and midstream gas storage and distribution, where the primary purpose is power generation, provided that these plants are aligned with the 2050 net zero pathway of the specific countries [footnote 90].
Globally, the electricity sector is responsible for about 30% of annual GHG emissions [footnote 91]. In this section we therefore take a deeper look at the climate impact of BII’s Power investments, notably in IPPs. Exhibit 17 depicts BII’s IPP investments by year of commitment and technology. The graphs show that BII’s Power portfolio has been changing towards renewable energy, and about 48% of BII’s currently active IPP portfolio is in renewable energy. The last coal investment was made through a fund in 2010. The last direct HFO investment, an asset intended to bridge a period of power shortages until a larger hydro plant becomes operational, was committed to in 2017 [footnote 92]. The substantial increase in natural gas and HFO plants in 2015 comes from BII taking over assets from Actis that were already operational in Globeleq [footnote 93].
Exhibit 17: BII IPP commitments by generation technology and year of commitment [footnote 94]
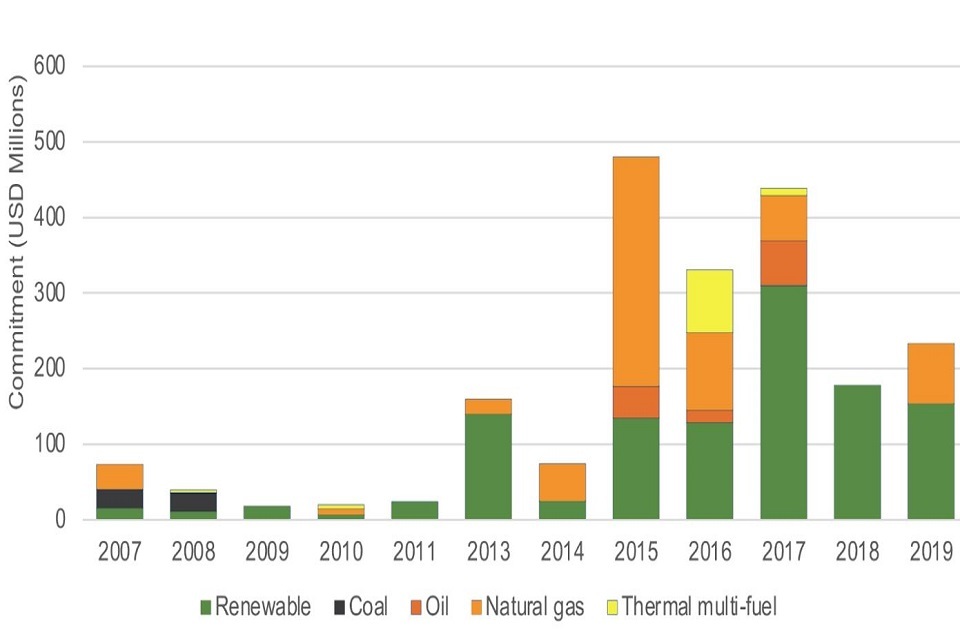
Exhibit 17
BII has analysed the actual GHG emissions and avoided emissions of the portfolio. For direct investments we deem BII’s calculations accurate, whereas for investments made through funds we think that BII should use actual power production rather than revenue data [footnote 95]. Annual GHG emissions of all IPP investments in scope amount to 13.7 million tonnes CO2 equivalent [footnote 96]. This includes both IPP invested directly and those invested through funds, but excludes exits and write-offs, as well as plants that are still under construction. Of the 13.7 million tonnes CO2 equivalent, 44% are related to direct investments, while the remaining 56% are related to IPPs invested through funds. BII estimates its emission avoidance only for its direct IPP investments to be 4.8 million tonnes. Including indirect investments, we estimate emission avoidance related to renewable IPPs to increase up to 13.9 million tonnes CO2 equivalent.
BII is a signatory of the Partnership for Carbon Accounting Financials (PCAF), which has developed accounting standards for financial institutions. Regarding attribution, PCAF requires that ‘The financial institution’s share of emissions shall be proportional to its exposure to the borrower’s or investee’s total (company or project) value’ [footnote 97]. For the IPPs invested through funds, BII applies an average attribution factor of 2.7%. In attributed terms, BII’s IPP portfolio is responsible for 1.3 million tonnes of CO2 equivalents. Of these, 84% are related to direct IPPs investments, while the remaining 16% are related to indirect ones. The attributed avoided emissions from its direct investments are estimated to be 0.5 million tonnes of CO2 equivalent, and 0.8 million tonnes when the full portfolio is considered.
Table 11: Attributed CO2 emissions and avoidance of IPPs in BII’s direct investment portfolio
| Country | Attributed CO2 emissions (tonne CO2eq) | Attributed CO2 emissions (% of BII total) | Attributed CO2 avoidance (tonne CO2eq) | Attributed CO2 avoidance (% of BII total) |
|---|---|---|---|---|
| Côte d’Ivoire | 377,424 | 28% | 0 | 0% |
| Bangladesh | 259,358 | 19% | 0 | 0% |
| Tanzania | 249,009 | 19% | 0 | 0% |
| Cameroon | 185,984 | 14% | 51,256 | 10% |
| India | 171,344 | 13% | 0 | 0% |
| Nigeria | 60,827 | 5% | 0 | 0% |
| Kenya | 29,710 | 2% | 0 | 0% |
| Africa (Various) | 2,977 | 0% | 0 | 0% |
| Mali | 2,202 | 0% | 0 | 0% |
| Ghana | 797 | 0% | 0 | 0% |
| Zimbabwe | 321 | 0% | 0 | 0% |
| South Africa | 281 | 0% | 248,245 | 49% |
| Morocco | 132 | 0% | 0 | 0% |
| Congo, Dem. Rep. | 6 | 0% | 0 | 0% |
| Uganda | 1 | 0% | 85,090 | 17% |
| Egypt | 0 | 0% | 58,528 | 11% |
| Pakistan | 0 | 0% | 55,920 | 11% |
| Namibia | 0 | 0% | 12,622 | 2% |
| Total | 1,340,373 | 100% | 511,660 | 100% |
The most important observations are:
- BII’s attributed avoided emissions (0.8 MTCO2eq. including indirect investments) are about 60% of the attributed actual emissions (1.3 MTCO2 eq.)
- 84% of the attributed emissions and 63% of the attributed avoided emissions come from BII’s direct investments.
- 28% of emissions come from IPPs located in Côte d’Ivoire. Bangladesh and Tanzania follow with 19% of total emissions each
- countries in which BII’s IPP portfolio avoids most GHG emissions are South Africa (49%), Uganda (17%), Egypt (11%) and Pakistan (11%). Apart from the substantial renewable capacity that BII has invested in South Africa, the fact that the country heavily relies on coal plants explains why carbon avoidance of renewable plants is so high
It is important to recognise that a tension can exist between development and climate impact. Many countries, especially in Africa, lack the base-load power capacity that wind and solar capacity by themselves cannot provide, but gas IPPs can provide. This base-load power is a pre-condition for moving countries to higher productivity activities and sectors, and integrating more renewable energy over time. In countries where gas is readily available, public and private sector actors consider the imposition of objectives to mitigate aspects of climate change that were not caused by them as an unfair constraint on their economic development. It is important that BII defines in which settings, and under what conditions gas investments are unavoidable, to achieve development impact and be aligned with the transition to net zero economies by 2050. For this reason, BII adopted the Guidance Note on Natural Gas Power Plants of December 2020.
6.5. Theme 5: Attribution of results
The focus of this evaluation is the development impact that BII investee companies have delivered. This answers the question of the extent to which BII has backed the ‘right’ companies. It leaves unresolved, the question of where BII achieves most development impact per dollar invested. Attribution is a much-contested topic because it involves considering financial and non-financial aspects; there is more to a successful investment than just the provision of capital.
Nevertheless, consensus seems to be emerging in the attribution of greenhouse gas emissions to financiers, prime among which is the PCAF methodology introduced in Section 6.4. It is therefore logical to apply the same methodology to the economic opportunity and standard of living impact results discussed in Section 6.1. The results are shown in Table 12, from which one can infer that the average results attribution to BII ranges from 13%-20%, depending on the impact.
Using these attributed numbers, we can estimate the effectiveness per dollar of BII investment. We estimate that US$1,000,000 of BII infrastructure investment would support 156 jobs (ongoing while BII is invested) as well as US$1,000,000 of value added annually (i.e. contribution to GDP) [footnote 99] [footnote 100], or equivalent to US$4.75m in the case of a five year BII holding. This estimation indicates that each dollar invested by BII returns itself in the form of value added to the host country in just over one year.
For comparison, the marginal return of private capital in low and lower-middle income countries is 25%, or US$250,000 per million of investment [footnote 101].
Table 12: Attributed economic opportunity and standards of living impacts by region [footnote 102]
| Region | Unattributed GDP (US$ m) | Attributed GDP (US$ m) | Unattributed jobs (’000) | Attributed jobs (’000) | Unattributed people reached (’000) | Attributed people reached (’000) |
|---|---|---|---|---|---|---|
| Africa | 11,197 | 1,691 | 2,263 | 393 | 87,531 | 22,407 |
| Asia | 6,406 | 622 | 1,236 | 122 | 64,032 | 7,882 |
| Total | 17,603 | 2,313 (13.1%) | 3,499 | 515 (14.7%) | 151,563 | 30,288 (20%) |
Exhibit 18 shows the attributed results (vertical axis), against the unattributed results (horizontal axis). The results indicate that the attributed employment results differ quite substantially for the various countries. Most of the countries are situated close to the 10% attribution line, meaning that 10% of the total employment supported by investee companies in these countries can be attributed to BII.
The importance of attribution becomes clear by comparing BII’s investments in India and Uganda in the exhibit. Although the unattributed employment in India is three times larger in India than in Uganda (almost 1 million vs 300,000), in attributed [footnote 103] terms the two countries are almost equal at about 100,000. This is because 30% of the impact of all investees in Uganda can be attributed to BII, whereas in India this is only 10% [footnote 104]. The fact that BII has a similar employment impact in Uganda with less than half of the investment amount (indicated by the size of the bubble) is largely due to the lower labour productivity in Uganda compared with India; per unit of capital invested, more employment is supported in Uganda when compared to India, although the value added per worker is lower in Uganda.
Exhibit 18: Attributed versus unattributed employment on logarithmic scale [footnote 105]
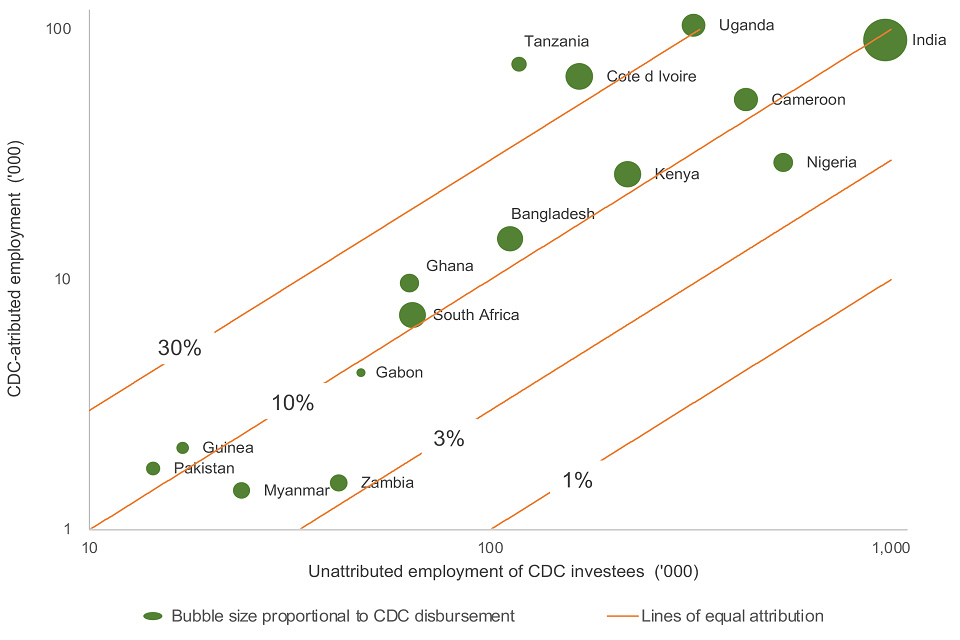
Exhibit 18
Clearly the attribution approach taken here omits the importance of value-adding activities that BII considers the second pillar of its input in addition to capital. As a PCAF signatory, BII will start reporting on its attributed carbon emissions. In our view it would be inconsistent if BII did not also provide attributed results for the other impact categories.
6.6. Theme 6: Gender
BII has taken steps to integrate a gender lens into their strategic priorities, including for the infrastructure portfolio, and to provide technical assistance to specific infrastructure investees to improve their gender outcomes. However, across both BII’s internal data and the Evidence Review, there is relatively little evidence on how infrastructure investments lead to specific outcomes and impacts for women and men who are affected by the infrastructure itself. This does not suggest that infrastructure investments do not have a positive effect on women; instead, the absence of evidence likely relates to the methodological challenges, already referenced in Section 2.3, of establishing actual uptake of infrastructure services by individuals and therefore of assessing the impacts on affected individuals’ standard of living.
In its 2017–21 Strategic Framework, BII situated women’s economic empowerment at the centre of its developmental strategic priorities in order to maximise its impact, alongside climate change, and it has since taken a number of steps to put this commitment into practice. In 2018, BII came out with a position statement on gender equality and co-founded the 2X Challenge, along with DFIs from the G7 countries [footnote 106], to support investments and initiatives that provide women in developing countries with access to leadership opportunities, quality employment, finance and enterprise support. The membership of the challenge has since grown to include additional institutions. Within the Challenge, BII developed the five 2X Criteria, with Dalberg Advisors, FinDev Canada and the 2X Challenge Working Group [footnote 107], criteria which was based on collective research and evidence.
In addition, BII leads the 2X Gender and Climate Finance Taskforce in collaboration with the European Investment Bank (EIB) and the Deutsche Investitions- und Entwicklungsgesellschaft (DEG), an initiative aimed at leveraging gender-smart investment solutions for climate action. At the official launch in January 2021, BII hosted a session on how to facilitate a transition towards net zero. Finally, based on the framework provided by the 2X Challenge, BII has launched an online gender toolkit which includes guidance on gender-smart investing and approaches, both on a portfolio level and sector-specific, for infrastructure as a whole, and off-grid solar in particular. In addition, gender is one of BII’s cross-cutting themes through which the full portfolio is viewed.
Out of the 39 direct investments, there are four investee companies which are qualified with the 2X Challenge. Table 13 presents the number of investments that meet each of the criteria, with the criteria on leadership being met by all four of the investee companies that are aligned with the 2X Challenge.
Table 13: Number of investee companies which meet the 2X criteria
| 2X criteria | Number of investments which meet criteria |
|---|---|
| Entrepreneurship: 51% women ownership or the business is founded by a woman | 0 |
| Leadership: 20–30% women in senior leadership (depending on sector) or 30% women on the board or Investment Committee | 4 |
| Employment: 30–50% share of women in the workforce (depending on sector) and one ‘quality’ indicator beyond compliance | 2 |
| Consumption: Product(s) or service(s) that specifically or disproportionally benefit women | 2 |
| Investments through financial intermediaries: 30% of the DFI loan proceeds or portfolio companies meet the 2X criteria | 0 |
There are three further investees who do not yet meet 2X criteria, but have set targets on gender, and/or implemented programmes to improve women’s employment.
BII investees report against 2X indicators, which relate to women’s representation within investees’ own operations. Table 14 outlines the data availability, (% of direct investments reporting against the indicator) and measure, (average score of those investments that have reported) for each indicator. The indicator that is most reported against (with 27% of direct investments reporting) is ‘women board members’; only 38% of reporting firms had one or more women board members. Although fewer firms reported against women senior management and women management indicators, a much higher proportion of those that did report had at least one woman senior manager (82%), or at least one woman manager (75%).
Table 14: 2019 reporting against gender indicators for the infrastructure portfolio [footnote 108]
| Indicator | Coverage (% of direct investments) | Average score of covered investments (%) |
|---|---|---|
| Shares owned by women | 21% | 3% |
| Women founder(s) | 21% | 0% |
| CEO is a woman | 23% | 0% |
| Women board members | 27% | 12% |
| Women senior management | 23% | 16% |
| Women management | 25% | 19% |
In addition to the data presented in Table 14, we estimate that direct women’s employment is about 15% based on information from companies that report on it [footnote 109]. According to BII’s own analysis of reported data, the median women employment for a BII investee (across all sectors) is 21%, if investees that report 0% women full-time equivalent are excluded [footnote 110]. The share seems to be higher for companies operating in the solar home system space. Based on three investments, we estimate average direct full-time women employment to be 41%. In these same three investments, we observe that women managers on average make up 26% of the management team. Finally, based on these three investments, we find that on average about 26% of solar home system purchases are made by women.
It is noteworthy that the proportion of direct investees reporting against these indicators is fairly low – between one-fifth and one-third of all direct investments. Further, the key indicators against which the investees are reporting are relevant in terms of tracking gender equality opportunities within investees’ own operations. There are no gender indicators that are systematically collected and reported across the infrastructure portfolio that relate to the impact pathways, outcomes or ultimate impacts in the BII Infrastructure Impact Framework, and gender does not appear on the impact framework itself.
BII provides technical support to some investees to meet their gender objectives and targets. Within the infrastructure portfolio, this technical support has included:
- in-depth gender diagnostics of Ecom Express, identifying barriers to women’s employment and supporting the development of a Gender Action Plan to address the barriers over a 5-year period
- establishing a business case for recruiting and training women to take up non-traditional roles within Owendo Mineral Port in Gabon, in collaboration with co-investors
- researching the potential benefits of introducing solar home system refrigeration solutions among local communities, especially for women, with M-KOPA assessing prospective customer bases, potential uses, anticipated impacts on behaviour and how best to maximise the impact and commercial potential of the products [footnote 111]
- developing a programme to up-skill local workers for operational jobs in one of Ayana’s power plants, which was designed with a gender lens to ensure women’s participation (such as gender-sensitive transport and bathrooms) [footnote 112]
The virtuous gender cycle in BII’s solar home system portfolio
Rural households have much to gain from affordable access to affordable energy, as it can transform the way they work and live. Women in domestic settings have the most to gain from the reduction of energy poverty. Large-scale surveys in Benin, Madagascar, Mauritius, South Africa and Ghana have shown that women devote three to five times as much time as men on domestic activities and energy collection [footnote 113]. It follows that clean and accessible energy options also have significant health implications for women in such settings [footnote 114].
Engaging female agents has been found to increase the distribution of solar home system products [footnote 115]. Impact data from BII’s investment in M-KOPA, and PEG Africa, provides some preliminary supporting evidence for this. M-KOPA is active in both Kenya and Uganda, and had about 44% and 24% female sales agents active in each market respectively in 2020. This is directly reflected in the share of new female customers in that same year; 35% in Kenya, and just 17% in Uganda. Similarly, PEG has just 6% female sales agents and only 12% of total customers are women.
It follows that solar home system companies have the opportunity to increase their revenues by engaging more female agents, while simultaneously increasing their impact on both the employment and consumption component of the 2X criteria.
The limited availability of good quality evidence linking infrastructure investments to gender outcomes and ultimate impacts is not only experienced by BII. The Evidence Review also found limited quality evidence of the gender effects of infrastructure investments. A summary of the extent of relevant evidence found through the Evidence Review systematic searches is as follows:
- There is limited evidence of gender outcomes of investments into energy transmission, and what little evidence is available is inconclusive as to whether the investments have a positive or negative effect on gender outcomes.
- The evidence of impact of off-grid power on gender and welfare is weak and inconclusive as to whether it has a positive or negative effect.
- There is weak evidence of a positive impact of mobile phone use on women’s health (from one study of women using mobile internet to access childbirth services, increasing the availability of postnatal care).
- The impact of water infrastructure on income inequality and other welfare indicators appears to be positive, but the evidence is weak.
There are established challenges in identifying the end users of infrastructure investments, and therefore in establishing how these investments affect women and men as end users differently. These challenges are compounded when trying to create and roll-out standardised gender indicators at outcome or impact level across a diverse portfolio such as BII’s infrastructure portfolio. However, an increased focus on collecting and using gender-disaggregated results data would provide BII with more actionable, portfolio-level data on its results in this important cross-cutting area. This could be complemented by specific in-depth studies to determine how specific infrastructure investments affect women and men differently and in which ways.
7. Summary of findings and recommendations
First, this section outlines the summary of findings from the sections of the report that cover the overview of the portfolio, Evidence Review and analysis of development impact across the portfolio. It then presents high-level findings that draw across different sections or are at thematic level. Lastly, it outlines our recommendations to improve British International Investment’s (BII) measurement and management of development impact in the infrastructure portfolio, which have been developed from the high-level findings.
7.1. Summary of findings from sections 3, 4 and 5
In this sub-section, we present the summary of all findings from each of Sections 3, 4 and 5; an overview of the portfolio, Evidence Review and analysis of development impact across the portfolio, respectively.
Overview of the portfolio
- infrastructure investments make up 28% of BII’s active portfolio
- the scope of this evaluation encompasses US$2,345 million that BII has disbursed to 194 companies that manage 295 separate infrastructure assets
- the infrastructure portfolio has grown substantially over the past 6 years from US$56 million in 2007 to US$2,345 million in 2020, largely due to 14 direct equity investments and 25 direct debt investments. Of the infrastructure portfolio, 43% is direct equity, 31% is direct debt and 26% is invested through infrastructure funds
- power is by far the largest sector (70%), and Independent Power Producers (IPPs) make up the bulk of that at approximately three-fifths of the entire infrastructure portfolio. ICT and Transport represent 22% and 8% respectively. WASH is an area of strategic importance but is negligible in the current portfolio
- within the portfolio 10 countries receive 75% of the disbursed capital, and the greatest amounts invested in India, Côte d’Ivoire and Kenya. The concentration in these 10 countries seems to be driven largely by the size of the country’s economy, with larger countries offering better and/or greater investment opportunities
Evidence Review
- in general, when the available evidence from the reviewed published literature is aggregated across all asset types and sectors, the evidence base is stronger for ultimate impacts and for some impact pathways than it is for outcomes
- although there is frequently strong evidence that an infrastructure investment affects ultimate impacts, the exact causal pathway by which it causes those high-level impacts to take place is not evidenced in the studies reviewed
- within the Power sector, there is more evidence available linking IPPs to the variables in the BII Impact Framework than there is available for other asset types
- for Transport, there is strong evidence available which links investments into Transport to ultimate impacts of economic opportunity, standard of living and environmental sustainability; for environmental sustainability, both positive and negative effects were found
- the evidence for ICT and Telecoms indicates positive impacts of broadband and backbone investments, particularly on economic variables, but is unclear on the impact of data centres and telephony
- there is less evidence available linking water infrastructure investments with development impact, in general, but there is good evidence on its impact on GDP and employment
Analysis of development impact across the portfolio
- the ultimate impacts of the portfolio were estimated using the evidence rules. These do not reflect the causal chain of BII’s impact framework which goes from impact pathways to outcomes to ultimate impacts. Insufficient knowledge of the relationships or investee data that involve outcomes essentially constitutes a ‘missing middle’ in the evidence chains
- across the portfolio, BII investees covered by the scope of this report [footnote 116]:
- reach 152 million consumers, or one in every twenty people living in Africa and South Asia
- support 3.5 million indirect [footnote 117] jobs, which is roughly equivalent to the working population of the Kampala metropolitan area
- generate US$17.6 billion of value added annually (i.e. contribution to GDP) [footnote 118], which is about the same as the GDP of, again, Kampala’s metropolitan area
- 80% of the investments are on track to realise their DI thesis
- both under-performance and over-performance of investments against the DI thesis is mostly due to internal reasons (strategic fit and implementation skills), but external factors (macro-economic and geopolitical context and regulatory environment) also exert their influence
- in terms of disbursed capital, the most important impact pathways of the portfolio are: additional capacity, improved service delivery, reduced prices and, to a lesser extent, cleaner capacity. The impact pathways that occur less frequently are customers reached and resource efficiency. The impact pathway climate smart infrastructure seems absent in the portfolio
- for all 39 direct investments, the BII risk-based BI due diligence process was performed, and for 30 of these BII’s, the BI team undertook more in-depth interventions to support investees. For funds, the main value-adding activities included annual BI reporting, training, ad hoc advisory and routine monitoring
- for all 39 direct investments, the BII ESG due diligence process was performed and for 23 of these a more detailed one was conducted. Deal-specific interventions were made in nine investments. For funds, the focus was on improving ESMS systems
- ten investee companies in the home solar and C&I sub-sectors received technical assistance worth US$1.25 million. A similar amount went to the support of impact opportunities beyond BII’s portfolio
7.2. High-level findings, drawn across sections and at thematic level
In this sub-section, we take the key findings from our analysis and synthesise these to draw high-level findings that relate to more than one key finding, or that are present at a thematic level. These high-level findings have been used to develop the recommendations presented in the subsequent sub-section.
-
There is considerable evidence of the development impact of different types of infrastructure investment on country-level impacts, such as GDP and employment. There is also a lot of scattered evidence of more detailed types of impact associated with specific types of investments. However, it is difficult to follow the evidence chain through the infrastructure impact framework, from impact pathways to outcomes, and finally to ultimate impacts. In particular, there is limited evidence and data on the relationships that link impact pathways to outcomes and outcomes to ultimate impacts. Therefore, outcomes are essentially the missing middle to explain how BII contributes to ultimate impacts.
-
From an impact perspective, we have identified four ‘sweet-spot’ countries: Uganda, Cameroon, Côte d’Ivoire and Kenya. In these countries BII investees have a relatively large impact (i.e. contribution to GDP and employment as outlined in Section 6.1) and BII has deployed a substantial amount of capital relative to the total amount of private investment in infrastructure (as assessed in Section 6.2).
-
Overall BII’s targeting of development impact is quite good in Power and, to a lesser extent, in ICT. In Transport it seems that BII can improve, although deal-specific and local circumstances (which were not considered in this portfolio-level analysis) are more important, especially in larger countries.
-
BII’s Power portfolio has been changing towards renewable energy; about 48% of BII’s currently active IPP portfolio is in renewable energy. Using the BII-signed PCAF methodology, attributed annual avoided and actual emissions are 4.6 and 6.4 million tonne CO2e, respectively.
-
Using the same attribution method as for the climate results, it follows that about 13% of the impact results can be attributed to BII, but variation between countries is considerable, approximately ranging between 3% and 30%.
-
Across both BII’s own portfolio-wide dataset and the reviewed evidence, there is little gender-sensitive evidence of the impact of infrastructure on women and men. This relates to the methodological challenges of identifying specific end users of large-scale infrastructure investments. Based on the evidence that is available, it is assumed that these investments do affect men and women differently. Given this evidence and the strategic importance of gender equality to both FCDO and BII, this may be an area where more data or published evidence is required to project BII’s development impact on women and men.
7.3. Recommendations
The following recommendations are developed based on the implications of the high-level findings. There are two types of recommendation presented: (i) proposed BII actions to improve use of evidence and monitoring data; and (ii) proposed actions to improve BII’s development impact. These recommendations are presented in the same order as the high-level findings (in Section 7.2) to which they relate.
-
BII could regularly update the Evidence Review with emerging evidence and the resulting evidence rules that have been extracted from the Evidence Review (while observing caution in their application). In this evaluation, the Evidence Review was steered towards the areas of most relevance for BII, and to yield provisional evidence rules that allow an approximate, but directionally correct, translation of BII inputs and impact pathways to ultimate impacts. Each of these evidence rules can be corrected and BII should strive to do so regularly. It is important that BII staff recognise that these evidence rules are not a substitute for a meticulous assessment of development impact, and are more appropriately applied across a portfolio, rather than at investment level. Related to high-level finding 1. Type of recommendation: Improving BII’s use of evidence and monitoring data.
-
We suggest that BII annually review portfolio data, and the extent to which external factors have changed and the associated implications on the actual development impact. For the various analyses reported upon in this development impact evaluation, data from many different sources had to be brought together. Because investments and external circumstances are subject to change, an annual update of the portfolio’s development impact would be useful to inform discussions on the strategic direction of the emerging portfolio. A more central data system which captures essential information from quarterly progress reports and includes external data, will enable such a yearly review. Furthermore, we encourage BII to identify a standardised set of indicators at the sub-sector level to monitor outputs and outcomes to better aggregate those throughout the portfolio. Related to high-level finding 1. Type of recommendation: Improving BII’s use of evidence and monitoring data.
-
We propose that BII determine in which countries it has substantial influence, and how it might use that influence to maximise development impact. For a limited number of countries this could lead to a ‘country development approach’ document. While the targeting approach mentioned under recommendation four addresses which countries would benefit most from a particular type of infrastructure, it does not address which type of investment would generate most development impact in a particular country. Application of a ‘country development lens’ on investment in countries where BII has substantial leverage may improve sequencing of investments and realise delivery synergies and complementarities between infrastructure sectors. Most importantly, BII is better able than most DFIs to leverage its strength in equity investment, and FCDO’s extensive network, to work with in-country partners to address a fundamental issue in infrastructure markets: the lack of investable deals and bankable projects at a country level. In this report we suggest that BII’s capital deployment and aggregate development impact of investees are good proxies for influence, although these are clearly not the only factors. Any country development approach would of course need to consider BII country and sector exposure limits. Related to high-level finding 2. Type of recommendation: Improving BII’s development impact.
-
In identifying and prioritising its potential for development impacts, we suggest that BII considers how it determines the areas of greatest needs for the different types of infrastructure to inform investment decision-making. In this evaluation we introduced an approach to determine in which countries the need for a particular type of infrastructure investment is relatively greatest. Acknowledging that not all public needs can be resolved by the private sector, elements of this approach could be considered in the planned update of the DI grid, although this approach is less well suited for investments with a more localised impact, such as Transport (especially roads) and WASH. Related to high-level finding 3. Type of recommendation: Improving BII’s development impact.
-
We recommend that BII continuously determine how to best navigate the nexus between development impact and a Paris-aligned net zero pathway. Sufficient and reliable power is a prerequisite for countries to transition to more productive activities and sectors. Renewable power generation is currently often unable to provide this so-called base-load power, except for when there are possibilities to develop geothermal and hydropower plants. In many countries, a tension may exist between BII’s development and climate objectives and therefore a balance between these may have to be found. BII’s recent gas tool already provides questions and indicators to specify in which settings and under what conditions gas investments are unavoidable, to achieve development impact. Because country policy and regulation, installed stock, available technologies and cost levels of IPPs, T&D networks, country interconnections, electricity storage, and decentralised and off-grid solutions continuously change, so should BII guidance on these matters. Related to high-level finding 4. Type of recommendation: Improving BII’s development impact.
-
We propose that BII formalises its approach to impact attribution and collects the necessary data from its investee companies. With BII now a signatory of the Partnership for Carbon Accounting Financials (PCAF), it will have to start reporting on its attributed GHG emissions. This means that BII will have to collect data on the total assets of its investees. In our opinion it also means that BII must start attributing its other development impact results. A logical first step would be to apply the PCAF methodology. Only if BII deems that that methodology is not appropriate for development impact, should it develop a more appropriate one. Related to high-level finding 5. Type of recommendation: Improving BII’s use of evidence and monitoring data.
-
We recommend that BII increases its active monitoring and management of the gendered outcomes and impacts of its infrastructure portfolio. We recommend an increased focus on collecting and using gender-disaggregated results data across investments that relate to the impact pathways, outcomes and/or ultimate impacts of the impact framework. This is relevant given the limited opportunities to draw upon external evidence to project gendered outcomes and impact. Related to high-level finding 6. Type of recommendation: Improving BII’s use of evidence and monitoring data.
List of references
African Development Bank, 2016. Empowering Women in Africa through Access to Sustainable Energy. https://www.afdb.org/fileadmin/uploads/afdb/Documents/Publications/AfDB-Gender_and_Energy_Desk_Review-EN-2016.pdf
Abe, K., Wilson, J.S., 2009. Investing in port infrastructure to lower trade costs in East Asia, Journal of East Asian Economic Integration, 15(2), Summer 201144.
Abecassis, D., Teo, D., Wei Jian, G., Kende, M., Gandal, N., 2020. Economic Impact of Google’s APAC Network Infrastructure. Analysys Mason.
Abrell, J., Rausch, S., 2016. Cross-country electricity trade, renewable energy and European transmission infrastructure policy. J. Environ. Econ. Manag. 79, 87–113. https://doi.org/10.1016/j.jeem.2016.04.001
Aderogba, B.A., Adegboye, A.A. 2019. Assessing the impact of road infrastructure on poverty reduction in developing economies: the case of Nigeria. Modern Economy, 10, 2430–2449. https://doi.org/10.4236/me.2019.1012153
Aghajani Tir, N., Momeni, F., Boboevich, G.T., 2014. Exploring the effects of water sector investment in economic development in Iran. Elsevier Enhanced Reader. Procedia – Soc. Behav. Sci. 131, 396–405. https://doi.org/10.1016/j.sbspro.2014.04.137
Aker, J.C., 2008. Does Digital Divide or Provide? The impact of cell phones on grain markets in Niger. SSRN Electron. J. https://doi.org/10.2139/ssrn.1093374
Aker, J.C., Mbiti, I.M., 2010. Mobile phones and economic development. Africa. J. Econ. Perspect. 24, 207–232. https://doi.org/10.1257/jep.24.3.207
Akerman, A., Gaarder, I., Mogstad, M., 2013. The Skill Complementarity of Broadband Internet. IZA Discuss. Pap. No7762 63.
Akpan, U.S. 2014. Impact of Regional Road Infrastructure Improvement on Intra-Regional Trade in ECOWAS. Infrastructure Consortium for Africa (ICA), c/o African Development Bank (AfDB), Tunis, Tunisia.
Albarran, P., Carrasco, R., Holl, A., 2013. Domestic transport infrastructure and firms’ export market participation. Small Business Economics 40, 879–898.
Alder, S. 2017. Chinese Roads in India: The Effect of Transport Infrastructure on Economic Development. University of North Carolina, Chapel Hill.
Alderete, M.V., 2017. An approach to the broadband effect on Latin American growth: a structural model. Cuad. Econ. 36, 549–569. https://doi.org/10.15446/cuad.econ.v36n71.54717
Alpkokin, P., Topuz Kiremitci, S., Black, J.A., Cetinavci, S., 2016. LRT and street tram policies and implementation in Turkish cities. J. Transp. Geogr. 54, 476–487. https://doi.org/10.1016/j.jtrangeo.2015.10.004
Amaghionyeodiwe, L., Annansingh-Jamieson, F., 2017. An Investigation into the Impact of Mobile Technologies on Economic Growth and Employment in the Caribbean. Athens J. Bus. Econ. 3, 263–278. https://doi.org/10.30958/ajbe.3.3.3
Anderson, R., 2018. Economic Benefits of Data Centre Investment 39.
Artal-Tur, A., Pallardo, V., Requena, F., 2016. Examining the impact of visa restrictions on international tourist flows using panel data. Estudios de Economia 43, 265–279. https://doi.org/10.4067/S0718-52862016000200005 Asian Development Bank, 2017. Economic and Financial Analysis of Peshawar Sustainable Bus Rapid Transit Corridor Project. Asian Development Bank.
Atasoy, H., 2013. The Effects of Broadband Internet Expansion on Labor Market Outcomes. ILR Rev. 66, 315–345.
Atkinson, R., Castro, D., Ezell, S., 2009.The Digital Road to Recovery: A Stimulus Plan to Create Jobs, Boost Productivity and Revitalize America. The Information Technology & Innovation Foundation (ITIF), January 2009.
Badran, M.F., 2012. The impact of broadband infrastructure on economic growth in some Arab and emerging countries. Topics in Middle Eastern and African Economies, 14. September 2012, 34. Baertsch, L., 2020. Quantifying the Economic Benefits of Public Transportation in Kampala. IGC Policy Brief 8, August 2020.
Bahia, K., Castells, P., Cruz, G., Masaki, T., Pedros, X., Pfutze, T., Rodriguez-Castelan, C., Winkler, H., 2020. The Welfare Effects of Mobile Broadband Internet: Evidence from Nigeria. World Bank, Washington, DC. https://doi.org/10.1596/1813-9450-9230
Banerjee, S.G., Morella, E., 2011. Africa’s water and sanitation infrastructure, Directions in Development – General. February 2013. The World Bank. https://doi.org/10.1596/978-0-8213-8457-2
Barbero, J., Rodriguez‐Crespo, E., 2018. The effect of broadband on European Union trade: A regional spatial approach. World Econ, 41, 2895–2913. https://doi.org/10.1111/twec.12723
Barman, M., Mahapatra, S., Palit, D., Chaudhury, M.K., 2017. Performance and impact evaluation of solar home lighting systems on the rural livelihood in Assam, India. Energy Sustain. Dev. 38, 10–20. https://doi.org/10.1016/j.esd.2017.02.004
Bartelsman, E.J., Falk, M., Hagsten, E., Polder, M., 2019. Productivity, technological innovations and broadband connectivity: firm-level evidence for ten European countries. Eurasian Bus. Rev. 9, 25–48. https://doi.org/10.1007/s40821-018-0113-0
BCG, 2014. Digital infrastructure and economic development: An analysis of the potential growth of data centers in PA as a result of the proposed data center sales and use tax exemption. The Boston Consulting Group.
Bel, G., Holst, M., 2015. Evaluation of the Impact of Bus Rapid Transit on Air Pollution (No. 201519), IREA Working Papers, IREA Working Papers. University of Barcelona, Research Institute of Applied Economics.
Bensch, G., Kluve, J., Peters, J., 2011. Impacts of Rural Electrification in Rwanda. IZA Discussion Paper Series, IZA 6195.
Bold, W., Davidson, W., 2012. Mobile Broadband: Redefining Internet Access and Empowering Individuals. Qualcomm.
Bird, J., Straub, S., 2020. The Brasília experiment: The heterogeneous impact of road access on spatial development in Brazil. World Development 127, 104739. https://doi.org/10.1016/j.worlddev.2019.104739
Bivens, J. 2012. Public Investment: The Next ‘New Thing’ for Powering Economic Growth. EPI. 18 April 2012. Bottasso, A., Conti, M., Ferrari, C., Merk, O., Tei, A., 2013. The impact of port throughput on local employment: Evidence from a panel of European regions. Transport Policy 27, 32–38. https://doi.org/10.1016/j.tranpol.2012.12.001
Bottasso, A., Conti, M., Ferrari, C., Tei, A., 2014. Ports and regional development: A spatial analysis on a panel of European regions. Transportation Research Part A: Policy and Practice 65, 44–55. https://doi.org/10.1016/j.tra.2014.04.006
Bottasso, A., Conti, M., de Sa Porto, P.C., Ferrari, C., Tei, A., 2018. Port infrastructures and trade: Empirical evidence from Brazil. Transp. Res. Part Policy Pract. 107, 126–139. https://doi.org/10.1016/j.tra.2017.11.013 Breidenbach, P., Mitze, T., 2015. The long shadow of port infrastructure in Germany: Cause or consequence of regional economic prosperity? Growth and Change 47, 378–392. https://doi.org/10.1111/grow.12130
Bris, M., Pawlak, J., Polak, J.W., 2017. How is ICT use linked to household transport expenditure? A cross-national macro analysis of the influence of home broadband access. J. Transp. Geogr. 60, 231–242. https://doi.org/10.1016/j.jtrangeo.2017.03.012
Çağlak, S.B., Aydin, G., Alkan, G., 2011. The impact of seaport investments on regional economics and developments. The International Journal of Business and Management 3, 333–339.
Calderón, C., Servén, L., 2004. The Effects of Infrastructure Development on Growth and Income Distribution. Policy Research Working Papers. The World Bank. https://doi.org/10.1596/1813-9450-340
Calderón, C, Moral-Benito, E., Servén, L. 2011. Is Infrastructure Capital Productive? A Dynamic Heterogeneous Approach, Documentos de trabajo no. 1103, Banco de España.
Capital Economics, 2014. Improving Connectivity: Stimulating the Economy Mobile Network Operators and the UK Economy. 26 November 2014.
Cariolle, J., Le Goff, M., Santoni, O., 2018. Broadband Infrastructure Deployment, Digital Vulnerability, and Local Firm Performance in Developing and Transition Countries. https://hal.archives-ouvertes.fr/hal-01758660v2 Carp, D., Barsan, E., 2003. Economic Impact Study of Constantza Port versus Constantza County. J. Coast. Res. 19, 890–897.
Cats, O., Reimal, T., Susilo, Y., 2014. Public transport pricing policy: Empirical evidence from a fare-free scheme in Tallinn, Estonia. Transp. Res. Rec. J. Transp. Res. Board 2415, 89–96. https://doi.org/10.3141/2415-10
Cavallo, E., Powell, A., 2019. Building Opportunities for Growth in a Challenging World. 2019 Latin American and Caribbean Macroeconomic Report: Inter-American Development Bank.
CDC Group, 2020a Gender Impact Data 2019 Overview, 2020
CDC Group, 2020b. Infrastructure Sector Strategy, October 2020. https://assets.cdcgroup.com/wp-content/uploads/2020/10/22160540/Infrastructure-sector-strategy.pdf
CEBR, 2019. The Economic Contribution of the UK Ports Industry: A Cebr report for Maritime UK. August 2019. Cervero, R., 2013. Bus Rapid Transit (BRT): An Efficient and Competitive Mode of Public Transport. Working Paper 2013-01. Institute of Urban and Regional Development. https://iurd.berkeley.edu/wp/2013-01.pdf
Cervero, R., 2009. Transport infrastructure and global competitiveness: Balancing mobility and livability. Ann. Am. Acad. Pol. Soc. Sci. 626, 210–225. https://doi.org/10.2307/40375931
Chandra, A., Thompson, E., 2000. Does public infrastructure affect economic activity?: Evidence from the rural interstate highway system. Regional Science and Urban Economics 30, 457–490. https://doi.org/10.1016/S0166-0462(00)00040-5
Chang, Y.-T., Shin, S.-H., Lee, P.T.-W., 2014. Economic impact of port sectors on South African economy: An input–output analysis. Transport Policy 35, 333–340. https://doi.org/10.1016/j.tranpol.2014.04.006
Chang, Y., Lee, J., Xiang Ang, W., Yi Chua, J., 2019. Energy market integration in ASEAN: Locational marginal pricing and welfare implications. J. Asian Econ. Integr. 1, 48–72. https://doi.org/10.1177/2631684618821568
Chen, W.-S., Chen, C.-Y., Chen, F.-C., Liu, C.-C., 2011. The impact of the Taipei Port Container Terminal on the Northern Region of Taiwan: A Computable General Equilibrium Model. J. Mar. Sci. Technol. 19, 7.
Cheng, D., Shi, X., Yu, J., 2020. The Impact of the Green Energy Infrastructure on Firm Productivity: Evidence from the Three Gorges Project in the People’s Republic of China. ADBI Working Paper Ser. 31.
Combs, T.S., 2017. Examining changes in travel patterns among lower wealth households after BRT investment in Bogotá, Colombia. J. Transp. Geogr. 60, 11–20. https://doi.org/10.1016/j.jtrangeo.2017.02.004
Cook, C.C., Asian Development Bank (eds), 2005. Assessing the Impact of Transport and Energy Infrastructure on Poverty Reduction. Asian Development Bank, Mandaluyong City, Metro Manila, Philippines.
Copenhagen Economics, 2015. The economic impact of Google’s data centre in Belgium. https://www.copenhageneconomics.com/publications/publication/the-economic-impact-of-googles-data-centre-in-belgium
Coşar, A.K., Demir, B., 2016. Domestic road infrastructure and international trade: Evidence from Turkey. Journal of Development Economics 118, 232–244. https://doi.org/10.1016/j.jdeveco.2015.10.001
COWI A/S, 2008. General Study of the Impact of Rural Roads in Nicaragua. OECD, Kongens Lyngby, Denmark.
Coyne, B., Denny, E., 2018. An Economic Evaluation of Future Electricity Use in Irish Data Centres. TRiSS Work. Pap. Ser. 35.
Crandall, R., Lehr, W., 2007. The Effects of Broadband Deployment on Output and Employment: A Cross-sectional Analysis of US Data. Brookings. 1 June 2007.
Crandall, R.W., Jackson, C.L., Singer, H.J., 2003. The Effect of Ubiquitous Broadband Adoption on Investment, Jobs, and the U.S. Economy. Criterion Economics. New Millennium Research Council. September 2003.
Csereklyei, Z., Qu, S., Ancev, T., 2019. The effect of wind and solar power generation on wholesale electricity prices in Australia. Energy Policy 131, 358–369. https://doi.org/10.1016/j.enpol.2019.04.007
Czernich, N., Falck, O., Kretschmer, T., Woessmann, L., 2011. Broadband Infrastructure and Economic Growth*. Econ. J. 121, 505–532. https://doi.org/10.1111/j.1468-0297.2011.02420.x
Dadson, S., Hall, J.W., Garrick, D., Sadoff, C., Grey, D., Whittington, D., 2017. Water security, risk, and economic growth: Insights from a dynamical systems model: Water security, risk, and economic growth. Water Resour. Res. 53, 6425–6438. https://doi.org/10.1002/2017WR020640
Dal Maso, M., Olsen, K.H., Dong, Y., Pedersen, M.B., Hauschild, M.Z., 2020. Sustainable development impacts of nationally determined contributions: assessing the case of mini-grids in Kenya. Clim. Policy 20, 815–831. https://doi.org/10.1080/14693062.2019.1644987
Dalgıç, B., Fazlıoğlu, B., 2020. The impact of broadband speed on productivity: findings from Turkish firms. Appl. Econ. Lett. 0, 1–4. https://doi.org/10.1080/13504851.2020.1722789
Davis, J., Kang, A., Vincent, J., Whittington, D., 2001. How Important is Improved Water Infrastructure to Microenterprises? Evidence from Uganda. World Dev. 29, 1753–1767. https://doi.org/10.1016/S0305-750X(01)00059-6
Day, T., 2019. The Role of Renewable Energy Mini-Grids in Kenya’s Electricity Sector. New Climate Institute. 49. De Soyres, F., Mulabdic, A., Ruta, M., 2019. Common Transport Infrastructure: A Quantitative Model and Estimates from the Belt and Road Initiative. Working Paper. World Bank, Washington, DC. https://doi.org/10.1596/1813-9450-8801
Deloitte, 2018. The impacts of mobile broadband and 5G: A literature review for DCMS. June 2018.
Deloitte, 2014. Value of connectivity: Economic and Social Benefits of Expanding Internet Access.
Department of Transport (Republic of South Africa), Roads, https://www.transport.gov.za/roads DFID (2019). Evaluating the Impact of CDC’s infrastructure portfolio: Terms of Reference.
Dinkelman, T., 2011. The Effects of Rural Electrification on Employment: New Evidence from South Africa. Am. Econ. Rev. 101, 3078–3108. https://doi.org/10.1257/aer.101.7.3078
Doi, M., Tiwari, P., Itoh, H., 2001. A computable general equilibrium analysis of efficiency improvements at Japanese ports. Review of Urban & Regional Development Studies 13, 187–206. https://doi.org/10.1111/1467-940X.00040
Dorothal, M., van der Linden, T., 2018. Africa Solar Impact Cases. SolarPlaza. https://sun-connect-news.org/fileadmin/DATEIEN/Dateien/New/2018_-_Africa_Solar_Impact_Cases_Report.pdf
Dot, U., Godavarthy, R., Mattson, J., Ndembe, E., 2014. Cost-Benefit Analysis of Rural and Small Urban Transit. 1 July 2014. https://doi.org/10.5038/CUTR-NCTR-RR-2012-06
Du, J., Douch, M., 2018. Infrastructure and Productivity: A Review. West Midland Combined Authority, Productivity and Skills Commission, Birmingham.
Eberhard, A., Naude, R., 2017. The South African Renewable Energy IPP Procurement Programme: Review, Lessons Learned and Proposals to Reduce Transaction Costs.
Eberhard, A., Dyson, G. (2020). What is the impact of investing in Power? Global Impact Investing Network. 6 January 2020.
Echeverry, J.C., Ibáñez, A.M., Moya, A., Hillón, L.C., Cárdenas, M., Gómez-Lobo, A., 2005. The Economics of TransMilenio, a Mass Transit System for Bogotá [with Comments]. Economía 5, 151–196.
Ecobilan, 2008. Developing a Generic Approach for FTTH Solutions using LCA Methodology. Ecobilan S.A. February 2008.
Edquist, H., Goodridge, P.R., Haskel, J., Li, X., Lindquist, E., 2017. How important are mobile broadband networks for global economic development? Working Paper. Imperial College Business School.
Edmonds, C., Fujimura, M., 2006. Impact of Cross-border Road Infrastructure on Trade and Investment in the Greater Mekong Subregion, in: Third LAEBA Annual Meeting Seoul, South Korea. Presented at the LAEBA Annual Meeting, Latin America/Caribbean and Asia/Pacific Economics and Business Association (LAEBA), Seoul, South Korea.
EEP Africa, 2018. Opportunities and challenges in the mini-grid sector in Africa – Lessons learned from the EEP Portfolio.
Efimova, E.G., Gapochka, A.A., 2020. Seaports as drivers of regional economic development: The case of Saint Petersburg and Leningrad Province. Case Studies on Transport Policy 8, 383–393. https://doi.org/10.1016/j.cstp.2019.10.003
Egger, P., Larch, M., 2008. The Bilateral and Multilateral Trade Effects of Road and Railway Transport Infrastructure. Research Gate.
EIB, 2008. Infrastructure Investment, Growth and Cohesion the Economics of Regional Transport Investment. European Investment Bank Papers, 13(2) 160.
Elburz, Z., Cubukcu, K.M., 2020. Spatial effects of transport infrastructure on regional growth: the case of Turkey. Spat. Inf. Res. 29, 19–30. https://doi.org/10.1007/s41324-020-00332-y
Ernst, J.P., 2005. Initiating Bus Rapid Transit in Jakarta, Indonesia. Transp. Res. Rec. 1903, 20–26. https://doi.org/10.1177/0361198105190300103
ESMAP, 2009. Good Practices in City Energy Efficiency – Bogota, Columbia, BRT for Urban Transport, ESMAP Energy Efficient Cities Initiative. World Bank Group, Washington, DC.
Fabritz, N., 2013. The Impact of Broadband on Economic Activity in Rural Areas: Evidence from German Municipalities. IFO Working Paper No. 166 27.
Fan, S., Chan-Kang, C., 2005. Road Development, Economic Growth, and Poverty Reduction in China (No. 138). Research Reports. International Food Policy Research Institute (IFPRI), Washington, DC.
Fan, S., Nyange, D., Rao, N., 2005. Public Investment and Poverty Reduction in Tanzania: Evidence from Household Survey Data (no. 18), DSGD Discussion Papers. International Food Policy Research Institute (IFPRI). Fay, M., Lee, H.I., Mastruzzi, M., Han, S., Cho, M., 2019. Hitting the Trillion Mark: A Look at How Much Countries are Spending on Infrastructure. Policy Research Working Paper 8730, World Bank.
Faulk, D., Hicks, M., 2010. The economic effects of bus transit in small cities. Public Finance Rev. 38, 513–539. https://doi.org/10.1177/1091142110373611
Fedderke, J.W., Bogetic, Z., n.d. Infrastructure and Growth in South Africa: Direct and Indirect Productivity Impacts of 19 Infrastructure Measures. Working Paper 39. University of Cape Town.
Forman, C., Goldfarb, A., Greenstein, S., 2010. The Internet and Local Wages: A Puzzle. Amer. Econ. Rev., 102 (1), 556–575.
Francisco, K., Helble, M., 2017. The Impact of Improved Transport Connectivity on Income, Education, and Health: The Case of the Roll-On/Roll-Off System in the Philippines. ADBI Working Paper No. 792, Asian Development Bank, Tokyo.
Freund, C.L., Weinhold, D., 2004. The effect of the Internet on international trade. J. Int. Econ. 62, 171–189. https://doi.org/10.1016/S0022-1996(03)00059-X
Frone, S., Frone, D.F., 2014. Challenges in analyzing correlation between water infrastructure and economic development. Procedia Econ. Finance 10, 197–206. https://doi.org/10.1016/S2212-5671(14)00294-9
Frontier Economics Ltd, 2017. Exploring the Economic Benefits of Strategic Roads. Department for Transport, United Kingdom, London. July 2017.
Frost and Sullivan, 2011. Economic Benefit Analysis of Developing Hong Kong into a Data Centre Hub. Office of the Government Chief Information Officer. HKSAR. https://www.datacentre.gov.hk/en/downloads/study/eeba-es-full.pdf
Gaduh, A., Gracňer, T., Rothenberg, A.D., 2017. Improving Mobility in Developing Country Cities: Evaluating Bus Rapid Transit and Other Policies in Jakarta. file:///C:/Users/Chris/AppData/Local/Temp/13269_paper_BGSS5kdt.pdf
Galperin, H., Viecens, M.F., 2017. Connected for Development? Theory and evidence about the impact of Internet technologies on poverty alleviation. Dev. Policy Rev. 35, 315–336. https://doi.org/10.1111/dpr.12210
Garcia Zaballos, A., Lopez-Rivas, R., 2020. Socioeconomic Impact of Broadband in Latin American and Caribbean Countries. Inter-American Development Bank Publications.
Ghose Bishwajit, Md. Rakibul Hoque, Sanni Yaya, 2017. Disparities in the use of mobile phone for seeking childbirth services among women in the urban areas: Bangladesh Urban Health Survey. BMC Med. Inform. Decis. Mak. 17, 1–9. https://doi.org/10.1186/s12911-017-0578-2
Gibbons, S., 2017. Econ Papers: Planes, Trains and Automobiles: The Economic Impact of Transport Infrastructure, SERC Policy Paper 13.
GIIN, 2019. Evaluating Impact Performance_Clean Energy Access, Global Impact Investing Network. 2 October 2019.
Ginting, E., Yusuf, A.A., Aji, P., Horridge, M., 2015. Economy-Wide Impact of a More Efficient Tanjung Priok Port (No. 3). Asian Development Bank, Metro Manila, Philippines.
Google, IFC, 2020. e-Conomy Africa 2020 Africa’s $180 billion Internet economy future.
Gordon, W.E., Hays, J., Pollack, E., Sanchez, D., 2011. Water Works: Rebuilding Infrastructure Creating Jobs Greening the Environment. Green for All.
Greener Journeys, 2016. The Value of the Bus to Society. Community Transport Association. Blog. 26 October 2016.
Grimes, A., Ren, C., Stevens, P., 2012. The need for speed: impacts of internet connectivity on firm productivity. J. Product. Anal. 37, 187–201. https://doi.org/10.1007/s11123-011-0237-z
Grimm, M., Munyehirwe, A., Peters, J., Sievert, M., 2015. A First Step up the Energy Ladder? Low Cost Solar Kits and Household’s Welfare in Rural Rwanda. Ruhr Economic Papers, RWI, Germany.
Groth, A., 2019. Socio-economic impacts of rural electrification in Tanzania. Int. J. Sustain. Energy Plan. Manag., 21 (2019). https://doi.org/10.5278/IJSEPM.2019.21.6
Grünfeld, L., Wang Gierloff, C., Stemland Eide, L., 2017. Economic Impact of a Hyperscale Data Center Establishment in Norway. Menon Economics.
Hagén, H.-O., Glantz, J., Nilsson, M., 2008. ICT use, broadband and productivity. Yearbook on Productivity (Statistics Sweden) 37–70.
Halaszovich, T.F., Kinra, A., 2018. The impact of distance, national transportation systems and logistics performance on FDI and international trade patterns: Results from Asian global value chains. Transp. Policy S0967070X17303670. https://doi.org/10.1016/j.tranpol.2018.09.003
Han, F., Wang, D., Li, B., 2019. Spillover Effects of Ports and Logistics Development on Economic Power: Evidence from the Chinese BTH Regions. Sustainability 11, 4316. https://doi.org/10.3390/su11164316
Hasbi, M., 2017. Impact of Very High-Speed Broadband on Local Economic Growth: Empirical Evidence. Presented at the 14th Asia-Pacific Regional Conference of the International Telecommunications Society (ITS): Mapping ICT into Transformation for the Next Information Society, Kyoto, Japan, p. 42.
Hassett, K.A., Shapiro, R.J., 2016. The Impact of Broadband and Related Information and Communications Technologies on the American Economy, 23 March 2016.
Hasson, A., Masih, M., 2017. Energy Consumption, Trade Openness, Economic Growth, Carbon Dioxide Emissions and Electricity Consumption: Evidence from South Africa based on ARDL. MPRA Paper No 79424. Hazlett, T.W., Schwall, B., Wallsten, S., 2019. The educational impact of broadband subsidies for schools under E-rate. Econ. Innov. New Technol. 28, 483–497. https://doi.org/10.1080/10438599.2018.1527554
Hensher, D.A., 2020. Clarifying the complementary contributions of cost benefit analysis and economic impact analysis in public transport investment in Hensher, D.A. (ed.) Bus Transport. Elsevier, pp. 349–363. https://doi.org/10.1016/B978-0-12-820132-9.00027-3
Hidalgo, D., Carrigan, A., 2010. BRT in Latin America High Capacity and Performance, Rapid Implementation and Low Cost. Built Environ. 36, 283–297. https://doi.org/10.2148/benv.36.3.283
Hidalgo, D., Pereira, L., Estupiñán, N., Jiménez, P.L., 2013. TransMilenio BRT system in Bogota, high performance and positive impact – Main results of an ex-post evaluation. Res. Transp. Econ. 39, 133–138. https://doi.org/10.1016/j.retrec.2012.06.005
Hidalgo, D., Yepes, T., 2005. Are Bus Rapid Transit Systems Effective in Poverty Reduction? Experience of Bogotá’s Transmilenio and Lessons for Other Cities. Presented at the TRB Annual Meeting 2005, Washington, DC.
Hine, J., Sasidharan, M., Torbaghan, M.E., Burrow, M., Usman, K., 2019. Evidence of the Impact of Rural Road Investment on Poverty Reduction and Economic Development (K4D Helpdesk Report). Institute of Development Studies, Brighton, UK.
Hintzenweg, G., 2019. Environmental and Social Impact Assessment: Nouakchott Container Terminal. Royal Haskoning DHV Nederland B.V. 126.
Hjort, J., Poulsen, J., 2019. The Arrival of Fast Internet and Employment in Africa. Am. Econ. Rev. 109, 1032–1079. https://doi.org/10.1257/aer.20161385
Hook, W., Howe, J., 2005. Transport and the Millennium Development Goals. Background Paper to the Task Force on Slum Dwellers of the Millennium Project. Green Roads for Water. Revised 14 October 2013.
HPC Hamburg Port Consulting GmbH, 2017. Development Impact Measurement of Global Seaports. Technical Note and Manual. International Finance Corporation.
Humphreys, J.M., 2018. The Economic Impact of Georgia’s Deepwater Ports on Georgia’s Economy in Fiscal Year 2017. Terry College of Business, The University of Georgia, Georgia, USA.
Hutton, G., 2012. Global Costs and Benefits of Drinking-Water Supply And Sanitation Interventions to Reach The MDG Target and Universal Coverage. World Health Organization.
IADB, 2016. Inter-American Development Bank Annual Report 2016: The Year in Review (Inter-American Development Bank Annual Report). Inter-American Development Bank.
IFC Development Impact Department, 2012. Estimating Employment Effects of Powerlinks Transmission Limited Project in India and Bhutan. World Bank Group.
IHS Markit, 2019. The Economic Contribution of Facebook Data Centres in Denmark, Ireland, and Sweden. September.
ITP and IBIS, 2009. Lagos BRT-Lite: Africa’s first bus rapid transit scheme. Integrated Transport Planning Ltd / IBIS Transport Consultants Ltd Available at: www.uitp-bhls.eu/IMG/pdf/BRT_Lite_Summary_Report_FINAL_V2.pdf
Iimi, A., 2011. Effects of Improving Infrastructure Quality on Business Costs: Evidence from Firm-Level Data in Eastern Europe and Central Asia. Dev. Econ. 49, 121–147. https://doi.org/10.1111/j.1746-1049.2011.00126.x International Energy Agency, Data and Statistics: Data Tables, https://www.iea.org/data-and-statistics/data-tables InterVISTAS Consulting Inc., 2019. 2019 Economic Impact of Port of Prince Rupert. Final Report. Vancouver, Canada.
Ismail, N.W., Mahyideen, J.M., 2015. The Impact of Infrastructure on trade and economic growth in selected economies in Asia. SSRN Electron. J. https://doi.org/10.2139/ssrn.2709294
ITU, 2019. The Economic Contribution of Broadband, Digitization and ICT Regulation. Regional Initiatives: Arab States Region, ITU. https://www.itu.int/dms_pub/itu-d/opb/pref/D-PREF-EF.BDT_ARS-2019-PDF-E.pdf ITU, 2020. Measuring digital development: ICT price trends
- International Telecommunication Union Development Sector, ITU Publications. https://www.itu.int/en/ITU-D/Statistics/Documents/publications/prices2020/ITU_ICTPriceTrends_2020.pdf
Jang, H., 2020. Market impacts of a transmission investment: Evidence from the ERCOT competitive renewable energy zones. Project. Energies 13, 3199. https://doi.org/10.3390/en13123199
Jian-ping, S., Zhenfu, L., Zhuo, C., Tongchao, L., 2017. Analysis of the relationship between port industry and economic growth based on cointegration theory, in Xu, B., Chen, Y. (eds) Presented at the MATEC Web of Conferences, 139:00226. http://dx.doi.org/10.1051/matecconf/201713900226
Jouili, T., 2016. The role of seaports in the process of economic growth. Developing Country Studies 6, 64. Jouili, T., Allouche, M.A., 2016. Impacts of seaport investment on the economic growth. International Journal of Transport Economics 43. https://doi.org/10.19272/201606704005
Jung, J., López-Bazo, E., 2020. On the regional impact of broadband on productivity: The case of Brazil. Telecommun. Policy 44, 101826. https://doi.org/10.1016/j.telpol.2019.05.002
Kahn Ribeiro, S., Kobayashi, S., Beuthe, M., Gasca, D., Greene, D.S., Lee, S., 2007. 2007 Transport and its infrastructure. Cambridge University Press. https://doi.org/10.1017/CBO9780511546013
Kathuria, R., Kedia, M., Varma, G., Bagchi, K., Sekhani, R., 2018. The anatomy of an internet blackout: Measuring the economic impact of internet shutdowns in India. Indian Council for Research on International Economic Relations.
Katz, R., 2010. La banda ancha: un objetivo irrenunciable para Brasil. Fundación Dialanet. Universidad de la Rioja. https://dialnet.unirioja.es/servlet/articulo?codigo=3634034
Katz, R., Callorda, F., 2013. Economic Impact of Broadband Deployment in Ecuador. Dirsi.
Katz, R.L., 2013. The Impact of Broadband on the Economy: Research to Date and Policy Issues, Broadband Series. Telecommunication Development Sector.
Katz, R.L., 2009. Estimating Broadband Demand and its Economic Impact in Latin America 20.
Katz, R.L., Koutroumpis, P., 2012. The Economic Impact of Broadband in The Philippines. Broadband Commission.
Katz, R.L., Vaterlaus, S., Zenhäusern, P., Suter, S., 2010. The impact of broadband on jobs and the German economy. Intereconomics 45, 26–34. https://doi.org/10.1007/s10272-010-0322-y
Katz, R.L., Zenhauser, P., Suter, S., 2008. An Evaluation of Socio-Economic Impact of a Fiber Network in Switzerland. Polynomics and Telecom Advisory Services, LLC.
Kawakami, T., Doi, M., 2004. Port capital formation and economic development in Japan: A vector autoregression approach. Papers in Regional Science 83, 723–732. https://doi.org/10.1111/j.1435-5597.2004.tb01935.x
Ketterer, J.C., 2014. The impact of wind power generation on the electricity price in Germany. Energy Econ. 44, 270–280. https://doi.org/10.1016/j.eneco.2014.04.003
Khandker, S.R., Bakht, Z., Koolwal, G.B., 2006. The Poverty Impact of Rural Roads : Evidence from Bangladesh. World Bank, Washington, DC. https://doi.org/10.1596/1813-9450-3875
King, R., Velasquez, J.M., Raifman, M., Duduta, N., Price, N., Epstein, A., n.d. Social, Environmental and Economic Impacts of BRT Systems. Bus Rapid Transit Case Studies from Around the World.
Köhlin, G., Sills, E.O., Pattanayak, S.K., Wilfong, C., 2011. Energy, Gender and Development: What are the Linkages? Where is the Evidence? Policy Research Working Papers. The World Bank. https://doi.org/10.1596/1813-9450-5800
Kolko, J., 2010. Does Broadband Boost Local Economic Development? Public Policy Institute of California.
Koutroumpis, P., 2019. The economic impact of broadband: Evidence from OECD countries. Technol. Forecast. Soc. Change 148, 119719. https://doi.org/10.1016/j.techfore.2019.119719
Lahr, M., Coughlin, E., Felder, F., 2010. Economic Impacts of Energy Infrastructure Investments. Elsevier. http://dx.doi.org/10.1016/B978-0-12-409548-9.11713-0
Lakmeeharan, K., Manji, Q., Nyairo, R., Poeltner, H., 2020. Solving Africa’s Infrastructure Paradox. McKinsey & Company. https://www.mckinsey.com/business-functions/operations/our-insights/solving-africas-infrastructure-paradox
Latif, M.A., 2002. Income, Consumption and Poverty Impact of Infrastructure Development. The Bangladesh Development Studies 28, 1–35.
Lei, L., Desai, S., Vanneman, R., 2019. The Impact of Transportation Infrastructure on Women’s Employment in India. Feminist Economics 25, 94–125. https://doi.org/10.1080/13545701.2019.1655162
Lenz, L., Munyehirwe, A., Peters, J., Sievert, M., 2017. Does large-scale infrastructure investment alleviate poverty? Impacts of Rwanda’s electricity access roll-out program. World Dev. 89, 88–110. https://doi.org/10.1016/j.worlddev.2016.08.003
Leung, T.C., Ping, K.P., Tsui, K.K., 2019. What can deregulators deregulate? The case of electricity. J. Regul. Econ. 56, 1–32. https://doi.org/10.1007/s11149-019-09386-9
Leung, J., Tantirigama, T., 2011. Contribution of transport to economic growth and productivity in New Zealand. 34th Australasian Transport Research Forum (ATRF) Proceedings. World Transit Research, Adelaide, Australia. Li, S., Liu, Y., 2020. Using big data to evaluate the impacts of transportation infrastructure investment: The case of subway systems in Beijing. 3ie Impact Evaluation Report 115. New Delhi: International Initiative for Impact Evaluation (3ie). Available at: https://doi.org/10.23846/DPW1IE115
Liebenau, J., Atkinson, R.D., Kärrberg, P., Castro, D., Ezell, S.J., 2009. The UK’s Digital Road to Recovery. SSRN Scholarly Paper No. ID 1396687. Social Science Research Network, Rochester, NY. https://doi.org/10.2139/ssrn.1396687
Lin, T.-Y., Chiu, S.-H., 2018. sustainable performance of low-carbon energy infrastructure investment on regional development: Evidence from China. Sustainability 10, 4657. https://doi.org/10.3390/su10124657
Lipscomb, M., Mobarak, A.M., Barham, T., 2013. Development effects of electrification: Evidence from the topographic placement of hydropower plants in Brazil. Am. Econ. J. Appl. Econ. 5, 200–231. https://doi.org/10.1257/app.5.2.200
Liu, Y.-H., Prince, J., Wallsten, S., 2018. Distinguishing bandwidth and latency in households’ willingness-to-pay for broadband internet speed. Inf. Econ. Policy 45, 1–15. https://doi.org/10.1016/j.infoecopol.2018.07.001 Lowe, M., Papageorgiou, C., Perez-Sebastian, F. 2019. The public and private marginal product of capital. Economica 86.
Lüdering, J., 2016. Low Latency Internet and Economic Growth: A Simultaneous Approach. Presented at the 27th European Regional Conference of the International Telecommunications Society (ITS): ‘The Evolution of the North-South Telecommunications Divide: The Role for Europe,’ Cambridge, UK, p. 20.
MacNeill, T., Wozniak, D., 2018. The economic, social, and environmental impacts of cruise tourism. Tourism Management 66, 387–404. https://doi.org/10.1016/j.tourman.2017.11.002
Magnum Economics, 2020. The Impact of Data Centers on the State and Local Economies of Virginia. Northern Virginia Technology Council.
Maier, E., Constant, S., Ahmad, A., 2020. Gender in Energy Interventions in Fragile and Conflict Situations in the Middle East and North Africa Region. World Bank, Washington, DC. https://doi.org/10.1596/34036
Malamud, O., Cueto, S., Cristia, J., Beuermann, D.W., 2019. Do children benefit from internet access? Experimental evidence from Peru. J. Dev. Econ. 138, 41–56. https://doi.org/10.1016/j.jdeveco.2018.11.005
Malik, S., Abbas, Q., 2009. Socio-economic Impact of Cellular Phones Growth in Pakistan: An Empirical Analysis. Pak. J. Soc. Sci. PJSS 29, 15.
Manzo, F., Bruno, R., 2015. A Flowing Economy: How Clean Water Infrastructure Investments Support Good Jobs in Chicago and in Illinois. Illionois Economic Policy Institute.
Martincus, C.V., Carballo, J., Cusolito, A., 2017. Roads, exports and employment: Evidence from a developing country. Journal of Development Economics 125, 21–39. https://doi.org/10.1016/j.jdeveco.2016.10.002
Mateo-Mantecón, I., Coto-Millán, P., Villaverde-Castro, J., Pesquera-González, M.Á., 2012. Economic impact of a port on the hinterland: application to Santander’s port. Int. J. Shipp. Transp. Logist. 4, 235–249. https://doi.org/10.1504/IJSTL.2012.047487
Matinga, M.N., Gill, B., Winther, T., 2019. Rice cookers, social media, and unruly women: Disentangling electricity’s gendered implications in rural Nepal. Front. Energy Res. 6. https://doi.org/10.3389/fenrg.2018.00140 Mazzone, A., 2019. Decentralised energy systems and sustainable livelihoods, what are the links? Evidence from two isolated villages of the Brazilian amazon. Energy Build. 186, 138–146. https://doi.org/10.1016/j.enbuild.2019.01.027
Merk, O.M., Manshanden, W.J.J., Dröes, M.I., 2013. Inter-Regional Spillovers of Seaports: The Case of North-West Europe. International Journal of Transport Economics/Rivista internazionale di economia dei trasporti 40, 401–417.
McIntyre, A., El-Ashram, A., Ronci, M., Reynaud, J., Che, N., Wang, K., Acevedo, S., Lutz, M., Strodel, F., Osueke, A., Yun, H., 2016. Caribbean Energy: Macro-Related Challenges. IMF Work. Pap. 16, 67.
Meeks, R., 2014. Water Works: The Economic Impact of Water Infrastructure. Discussion Paper. Harvard Environmental Economics Program.
Moner-Girona, M., Solano-Peralta, M., Lazopoulou, M., Ackom, E.K., Vallve, X., Szabó, S., 2018. Electrification of sub-Saharan Africa through PV/hybrid mini-grids: Reducing the gap between current business models and on-site experience. Renew. Sustain. Energy Rev. 91, 1148–1161. https://doi.org/10.1016/j.rser.2018.04.018
Morrissey, K., Burthoo-Barah, S.B., Dawoonauth, M., Scandizzo, P.L., 2019. Exploring the distributional impact of investment in the port sector on households in Mauritius: A social accounting matrix approach. Mar. Policy 99, 324–333. https://doi.org/10.1016/j.marpol.2018.10.047
Moyo, B., 2011. Do water cuts affect productivity? Case study of African manufacturing firms. Water SA. African Journals Online. https://doi.org/10.4314/wsa.v37i3.68486
Mu, R., van de Walle, D., 2007. Rural Roads and Local Market Development in Vietnam. Working Paper No. 4340. Policy Research Working Papers. World Bank, Washington, DC. https://doi.org/10.1596/1813-9450-4340 Musouwir, T.H., 2010. Water and Economic Development: Correlation Between Investment in The Water Sector and Economic Growth of Developing Countries. https://www.rid.go.th/thaicid/_6_activity/YPF-INACID/YPF_01_Tesar_H_M.pdf
Muto, M., Yamano, T., 2009. The Impact of Mobile Phone Coverage Expansion on Market Participation: Panel Data Evidence from Uganda. World Dev. 37, 1887–1896. https://doi.org/10.1016/j.worlddev.2009.05.004
Namubiru, M., Ngaka, W., 2018. The EFFECT of ICT on households’ food security in Uganda. Evidence from Acholi sub region in northern Uganda. International Journal of Technology and Management 3(1). June 2018. Nelson, A., Appleyard, B., Kannan, S., Ewing, R., Miller, M., Eskic, D., 2013. Bus rapid transit and economic development: Case study of the Eugene-Springfield BRT system. J. Public transp. 16, 41–57. https://doi.org/10.5038/2375-0901.16.3.3
Net Balance Management Group Pty Ltd., 2014. Assessment of the Economic Impact of Cruise Ships to Vanuatu. World Bank, Washington, DC. International Finance Corporation. https://openknowledge.worldbank.org/handle/10986/23836 License: CC BY-NC-ND 3.0 IGO.
OECD, 2014. Cloud computing: The concept, impacts and the role of government policy. OECD Digital Economy Papers 240. https://doi.org/10.1787/5jxzf4lcc7f5-en
Okunlola, A., Evbuomwan, O., Zaheer, H., Winklmaier, J., 2018. Assessment of decentralized hybrid mini-grids in sub-Saharan Africa: Market analysis, least-cost modelling, and job creation Analysis, in Mpholo, M., Steuerwald, D., Kukeera, T. (eds), Africa-EU Renewable Energy Research and Innovation Symposium 2018 (RERIS 2018), Springer Proceedings in Energy. Springer International Publishing, Cham, pp. 21–34. https://doi.org/10.1007/978-3-319-93438-9_2
Oliver, Z., Clark-Sutton, K., VanLear, S., Aramayo, L., Lim, B., Moss, C., Zayed, S., Petrusa, J., 2018. The Impact of Facebook’s US Data Center Fleet. RTI International.
Olgunleye, A., Ajibola, O., Enilolobo, O., Shogunle, O. 2018, Influence of road transport infrastructure on agricultural sector development in Nigeria. Logistics & Sustainable Transport, 9, 39–50. 1 February 2018. Doi: 10.2478/jlst-2018-0004
Ortego, A., Valero, A., Abadías, A., 2017. Environmental Impacts of Promoting New Public Transport Systems in Urban Mobility: A Case Study. 30 September 2017. https://doi.org/10.13044/J.SDEWES.D5.0143
Oxford Economics, 2018. Google Data Centers – Economic Impact and Community Benefit. https://www.oxfordeconomics.com/recent-releases/d8d830e4-6327-460e-95a5-c695a32916d9
Parikh, P., Fu, K., Parikh, H., McRobie, A., George, G., 2015. Infrastructure Provision, Gender, and Poverty in Indian Slums. World Dev. 66, 468–486. https://doi.org/10.1016/j.worlddev.2014.09.014
Park, J.S., Seo, Y.-J., 2016. The impact of seaports on the regional economies in South Korea: Panel evidence from the augmented Solow model. Transportation Research Part E: Logistics and Transportation Review 85, 107–119. https://doi.org/10.1016/j.tre.2015.11.009
Pasha, O., Wyczalkowski, C., Sohrabian, D., Lendel, I., 2020. Transit effects on poverty, employment, and rent in Cuyahoga County, Ohio. Transp. Policy 88, 33–41. https://doi.org/10.1016/j.tranpol.2020.01.013
Pelissie du Rausas, M., Manyika, J., Hazan, E., Bughin, J., Chui, M., Said, R., 2011. Internet matters: The Net’s sweeping impact on growth, jobs, and prosperity. McKinsey Global Institute.
Peters, J., Vance, C., Harsdorff, M., 2011. Grid extension in rural Benin: Micro-manufacturers and the electrification trap. World Dev. 39, 773–783. https://doi.org/10.1016/j.worlddev.2010.09.015
Pirie, G., 2013. Sustainable urban mobility in ‘Anglophone’ sub-Saharan Africa, in United Nations (ed.) Global Report on Human Settlements 2013. UN-Habitat.
Poliquin, C.W., 2020. The Wage and Inequality Impacts of Broadband Internet. University of California. 21 April 2020.
Popova, Y., 2016. Relations between Wellbeing and Transport Infrastructure of the Country, in Procedia Engineering, RelStat-2016: Proceedings of the 16th International Scientific Conference Reliability and Statistics in Transportation and Communication 19–22 October 2016. Transport and Telecommunication Institute, Riga, Latvia. Presented at the 6th Conference on Reliability and Statistics in Transportation and Communication, Procedia Engineering, pp. 579–588. https://doi.org/10.1016/j.proeng.2017.01.112
Ports Regulator of South Africa. (2016). South African Port Capacity and Utilisation Report, 2015–2016.
Pueyo, A., Carreras, M., Ngoo, G., 2020. Exploring the linkages between energy, gender, and enterprise: Evidence from Tanzania. World Dev. 128, 104840. https://doi.org/10.1016/j.worlddev.2019.104840
Pueyo, A., DeMartino, S., 2018. The impact of solar mini-grids on Kenya’s rural enterprises. Energy Sustain. Dev. 45, 28–37. https://doi.org/10.1016/j.esd.2018.04.002
Purvins, A., Gerbelova, H., Sereno, L., Minnebo, P., 2021. Social welfare impact from enhanced Trans-Asian electricity trade. Energy 215, 119106. https://doi.org/10.1016/j.energy.2020.119106
Quiang, C.Z., Rossotto, C.M., 2009. Economic Impacts of Broadband. Inf. Commun. Dev. 2009 Extending Reach Increasing Impact 35–50.
Quinn, A., Safriet, C., Feeney, K., Lauf, V., 2014. National Economic and Labor Impacts of the Water Utility Sector: Executive Report. Water Research Foundation.
Ramachandran, V., Shah, M.K., Moss, T., 2018. How Do African Firms Respond to Unreliable Power? Exploring Firm Heterogeneity Using K-Means Clustering. Working Papers 493, Center for Global Development. 20 August 2018.
Ramboll Environ, 2017. Economic Analysis of Water Infrastructure and Fisheries Habitat Restoration Needs. State of Washington Office of Financial Management, Olympia, WA.
Rao, N.D., Agarwal, A., Wood, D., 2016. Impacts of Small-Scale Electricity. A study of small-scale rural communities in India and Nepal. World Resource Institute, India.
Regeneris, 2018. The Economic Impact of Full Fibre Infrastructure in 100 UK Towns and Cities. Report by Regeneris Consulting for CityFibre. March 2018.
Röller, L.-H., Waverman, L., 2001. Telecommunications infrastructure and economic development. A simultaneous approach. Am. Econ. Rev. 91, 23.
Roşca, V.I., 2018. The impact of public transportation investments made by the municipality of Bucharest upon quality of life. J. Community Posit. Pract. 18, 39–49.
Rosson, P., Adcock, F., Costa, R., Robinson, J., 2011. Impacts of Transportation Infrastructure on the US Cotton Industry.
Saidi, S., Mani, V., Mefteh, H., Shahbaz, M., Akhtar, P., 2020. Dynamic linkages between transport, logistics, foreign direct Investment, and economic growth: Empirical evidence from developing countries. Transportation Research Part A: Policy and Practice 141, 277–293. https://doi.org/10.1016/j.tra.2020.09.020
Santos, A.M.P., Salvador, R., Dias, J.C.Q., Soares, C.G., 2018. Assessment of port economic impacts on regional economy with a case study on the Port of Lisbon. Marit. Policy Manag. 45, 684–698. https://doi.org/10.1080/03088839.2018.1471536
Scholl, L., Martínez, D., Mitnik, O.A., Oviedo, D., Yáñez-Pagans, P., 2018. A Rapid Road to Employment?: The Impacts of a Bus Rapid Transit System in Lima. Inter-American Development Bank. https://doi.org/10.18235/0001527
Scott, A., Darko, E., Seth, P., Rud, J.-P., 2013. Job Creation Impact Study: Bugoye Hydropower Plant, Uganda. Overseas Development Institute.
Seo, Y.-J., Park, J.S., 2018. The role of seaports in regional employment: evidence from South Korea. Regional Studies 52, 80–92. https://doi.org/10.1080/00343404.2016.1262014
Shan, J., Yu, M., Lee, C.-Y., 2014. An empirical investigation of the seaport’s economic impact: Evidence from major ports in China. Transportation Research Part E: Logistics and Transportation Review 69, 41–53. https://doi.org/10.1016/j.tre.2014.05.010
Shideler, D., Badasyan, N., Taylor, L., 2007. The economic impact of broadband deployment in Kentucky. Federal Reserve Bank of St. Louis. Regional Economic Development 3, 2.
Shinyekwa, I.M.B., Ntale, A., 2017. The Role of Economic Infrastructure Promoting Exports of Manufactured Products: Trade facilitation and industrialisation in the EAC. Economic Policy Research Center 139. September 2017.
Song, L., van Geenhuizen, M., 2014. Port infrastructure investment and regional economic growth in China: Panel evidence in port regions and provinces. Transport Policy 36, 173–183. https://doi.org/10.1016/j.tranpol.2014.08.003
Standal, K., Winther, T., 2016. Empowerment through energy? Impact of electricity on care work practices and gender relations. Forum Dev. Stud. 43, 27–45. https://doi.org/10.1080/08039410.2015.1134642
Steward Redqueen, 2018. The Impact of Power Investments in Honduras. Finnfund. August 2018.
Steward Redqueen, 2017. The Link Between Power Investments and Jobs in Senegal. Private Infrastructure Development Group.
Steward Redqueen, 2016. What is the Link Between Power and Jobs in Uganda? Final Report. CDC. November 2016.
Stockinger, B., 2017. The Effect of Broadband Internet on Establishments’ Employment Growth: Evidence from Germany. IAB Discuss. Pap. 56.
Stoddard, L., Abiecunas, J., O’Connell, R., 2006. Economic, Energy, and Environmental Benefits of Concentrating Solar Power in California (No. NREL/SR-550-39291, 881924). https://doi.org/10.2172/881924
Stupak, J.M., 2018. Economic impact of infrastructure investment, in: González, J.V. (ed.), U.S. Infrastructure: Government Programs and Economic Impacts. Nova Science Publishers, Incorporated, New York, United States, pp. 25–49.
Thelle, M., Rytter Sunesen, E., Jeppesen, T., Haag Theilgaard, C., Kantanen, K., Martikainen, E., Basalisco, B., 2017. Finland’s Economic Opportunities from Data Centre Investments. Copenhagen Economics.
Thompson, H.G., Garbacz, C., n.d. Broadband Impacts on State GDP: Direct and Indirect Impacts. https://www.itu.int/net/wsis/stocktaking/docs/activities/1287145862/Ohio_University.pdf
Tiwari, G., Jain, D., 2012. Accessibility and safety indicators for all road users: case study Delhi BRT. Special Section on Rail Transit Systems and High Speed Rail. J. Transp. Geogr., 22, 87–95. https://doi.org/10.1016/j.jtrangeo.2011.11.020
Toba, N., 2003. Welfare Impacts of Electricity Generation Sector Reform in the Philippines. ERD Work. Pap. No 44 41. Tong, T., Yu, E., Roberts, R.K., 2014. Dynamics of transport infrastructure, exports and economic growth in the United States. Journal of the Transportation Research Forum 53, 1–18.
Tsivanidis, N., 2019a. Evaluating the Impact of Urban Transit Infrastructure: Evidence from Bogotá’s TransMilenio. Berkley, University of California. https://www.cemfi.es/ftp/pdf/papers/pew/TransMilenio_2.2019.pdf
Tsivanidis, N., 2019b. The Aggregate and Distributional Effects of Urban Transit Infrastructure: Evidence from Bogotá’s TransMilenio. Dartmouth College. https://www.cemfi.es/ftp/pdf/papers/pew/TransMilenio_2.2019.pdf
UNESCO (ed.), 2016. Water and Jobs, The United Nations World Water Development Report. UNESCO, Paris.
UNESCO, 2019. Water, Crucial for Achieving SDGs in Review at the UN High-Level Political Forum (HLPF) 2019. Policy Brief. https://en.unesco.org/sites/default/files/hlpf_policy_brief_final.pdf
US International Trade Commission, 2009. Sub-Saharan Africa: Effects of Infrastructure Conditions on Export Competitiveness, Third Annual Report. USITC Publ. 4071 195.
Value of Water Campaign, 2017. The Economic Benefits of Investing in Water Infrastructure. Thevalueofwater.org
Vaz, E., Venter, C., 2012. The Effectiveness of Bus Rapid Transit as Part of a Poverty Reduction Strategy: Some Early Impact in Johannesburg. https://repository.up.ac.za/bitstream/handle/2263/20221/Vaz_Effectiveness(2012).pdf?sequence=3
Vergauwen, B., 2010. © Association for European Transport and contributors 2010 Ex-Post Analysis of an Infrastructure Project in the Port of Antwerp. https://aetransport.org/past-etc-papers/conference-papers-pre-2009/conference-papers-2010
Wang, C., Lim, M.K., Zhang, X., Zhao, L., Lee, P.T.-W., 2020. Railway and road infrastructure in the Belt and Road Initiative countries: Estimating the impact of transport infrastructure on economic growth. Transportation Research Part A: Policy and Practice 134, 288–307. https://doi.org/10.1016/j.tra.2020.02.009
Wang, Y., Wang, N., 2019. The role of the port industry in China’s national economy: An input–output analysis. Transport Policy 78, 1–7. https://doi.org/10.1016/j.tranpol.2019.03.007
Waverman, L., 2009. Economic Impact of Broadband: An Empirical Study. LECG. 22 February 2009.
Wendle, J., 2013. Assessing the impacts of new IPPs at country level? Case study on Kenya. Blog Private Sector and Development.
Wessel, J., 2019. Evaluating the transport-mode-specific trade effects of different transport infrastructure types. Transp. Policy 78, 42–57. https://doi.org/10.1016/j.tranpol.2019.04.002
What Works Centre, 2015. Evidence Review 7: Transport. What Works Centre for Local Economic Growth, London, United Kingdom.
SIWI, 2005. Making Water a Part of Economic Development: The Economic Benefits of Improved Water Management and Services. Stockholm International Water Institute.
Wieck, R., Vidal, M., 2011. Investment in telecommunications infrastructure, growth and employment recent research. Int. J. Manag. Netw. Econ. 2, 135. https://doi.org/10.1504/IJMNE.2011.043351
Wiegand, M., Koomen, E., Pradhan, M.P., Edmonds, C., 2017. The Impact of Road Development on Household Welfare in Rural Papua New Guinea. Tinbergen Institute Discussion Paper No. 17-076/V. Tinbergen Institute, Rochester, NY. https://doi.org/10.2139/ssrn.3021792
Wilson, J.S., Mann, C.L., Otsuki, T., 2003. Trade Facilitation and Economic Development: A New Approach to Quantifying the Impact. World Bank Econ. Rev. 17, 367–389. https://doi.org/10.1093/wber/lhg027
Wöhrnschimmel, H., Zuk, M., Martínez-Villa, G., Cerón, J., Cárdenas, B., Rojas-Bracho, L., Fernández-Bremauntz, A., 2008. The impact of a Bus Rapid Transit system on commuters’ exposure to Benzene, CO, PM2.5 and PM10 in Mexico City. Atmospheric Environment 42, 8194–8203. https://doi.org/10.1016/j.atmosenv.2008.07.062
World Bank, Public Participation in Infrastructure (PPI) 2020 Half year Report, 2020.
World Bank, 2016. Digital Dividends, World Development Report 2016.
World Bank, 2008. The Welfare Impact of Rural Electrification: A Reassessment of the Costs and Benefits. The World Bank. https://doi.org/10.1596/978-0-8213-7367-5
World Resource Institute, 2017. Climate Analysis Indicators Tool. http://cait.wri.org/ Wright, L., Fulton, L., 2005. Climate Change Mitigation and Transport in Developing Nations. Transp. Rev. 25, 691–717. https://doi.org/10.1080/01441640500360951
Xu, J.-H., Yi, B.-W., Fan, Y., 2020. Economic viability and regulation effects of infrastructure investments for inter-regional electricity transmission and trade in China. Energy Econ. 91, 104890. https://doi.org/10.1016/j.eneco.2020.104890
Yang, F., Zhang, S., Sun, C., 2020. Energy infrastructure investment and regional inequality: Evidence from China’s power grid. Sci. Total Environ. 749, 142384. https://doi.org/10.1016/j.scitotenv.2020.142384
Yang, Y., Zhang, P., Ni, S., 2014. Assessment of the impacts of urban rail transit on metropolitan regions using system dynamics model. Sustainable mobility in metropolitan regions. Transp. Res. Procedia 4, 521–534. International Scientific Conference on Mobility and Transport. Conference Proceedings. https://doi.org/10.1016/j.trpro.2014.11.040
Zafir, S.R.M., Razali, N.M.M., Hashim, T.J.T., 2016. Relationship between loss of load expectation and reserve margin for optimal generation. J. Teknol. 78. https://doi.org/10.11113/jt.v78.8783
Zeyringer, M., Pachauri, S., Schmid, E., Schmidt, J., Worrell, E., Morawetz, U.B., 2015. Analyzing grid extension and stand-alone photovoltaic systems for the cost-effective electrification of Kenya. Energy Sustain. Dev. 25, 75–86. https://doi.org/10.1016/j.esd.2015.01.003
Zandi, M. 2011. U.S. Macro Outlook: Compromise Boosts Stimulus. Moody’s Analytics. 8 December 2010. https://www.economy.com/economicview/analysis/195470
Zhao, D., Zhen-fu, L., Yu-tao, Z., Xiao, C., Shan-shan, L., 2020. Measurement and spatial spillover effects of port comprehensive strength: Empirical evidence from China. Transport Policy 99, 288–298. https://doi.org/10.1016/j.tranpol.2020.09.006
Zhong, S., Qiu, L., Sun, B., 2020. Internet and firm development. Int. J. Crowd Sci. 4, 171–187. https://doi.org/10.1108/IJCS-11-2019-0032
Zhou, Y., Zhang, Y., Ma, D., Lu, J., Luo, W., Fu, Y., Li, S., Feng, J., Huang, C., Ge, W., Zhu, H., 2020. Port-Related Emissions, Environmental Impacts and Their Implication on Green Traffic Policy in Shanghai. Sustainability 12, 4162. https://doi.org/10.3390/su12104162
Zou, W., Zhang, F., Zhuang, Z., Song, H., 2019. Energy and Economic Impacts of China’s 2016 Economic Investment Plan for Transport Infrastructure Construction: An Input-Output Path Analysis.
-
From 4 April 2022, CDC changed its name to British International Investment (BII). ↩
-
Over the course of this evaluation the BII team was reorganised to combine infrastructure and climate. Although climate is one of the themes addressed in this report, the evaluation concerns only BII’s past infrastructure work. ↩
-
Specifically, all BII infrastructure investments into power, transport, ICT and water that were committed between 3 December 2007 and 30 August 2020, are in scope. For these investments, disbursed amounts are as per 30 January 2021. ↩
-
Excluding double counts, e.g. Globeleq was invested in indirectly through Actis in 2009 and directly in 2015. ↩
-
Active portfolio refers to current, partially realised and written down deals, but excludes fully realised and written off deals. ↩
-
Refer to Table 2 for the variables for which evidence rules were applied. ↩
-
Figures based on contribution at the time of research; The numbers stated here cannot be compared to BII’s latest annual report because it includes exited investments, projected impacts of assets under construction. This covers all indirect effects (indirect, induced and enabled). ↩
-
This is a shift of GDP to a higher level but it does not affect the GDP growth rate. ↩
-
For BII attribution see Theme 5. ↩
-
BII’s stake in indirect investments is on average more than five times smaller than direct investments. ↩
-
The impact of investees which are directly invested in, and through a fund are categorised as direct investments. ↩
-
The impact of gas investments is not included. To prevent double counting the impact at multiple parts of the value chain, all impact is attributed to the power producer, rather than the gas supply. ↩
-
This only reflects the number of households where BII’s investees are actively involved in reaching new customers. It does not include the number of estimated people reached through the additional IPP capacity, or the customers reached by mobile network operators (MNOs). ↩
-
Two investments have been excluded: one due to a lack of defined DI metrics and the other because no disbursement has yet been made. ↩
-
For US$316 million of investments, no detailed information is available on the exposure to different states within India, nor is the exact location of much relevance for the largest infrastructure subsector, IPPs ↩
-
Scope 1-2. By also including Scope 3 emissions we estimate that emissions would rise by 30%. ↩
-
An asset which supports US$1,000,000 of GDP annually can do so over the entire duration of the investment. In each year of its lifetime the GDP is higher by this amount. ↩
-
From 4 April 2022, CDC changed its name to British International Investment (BII). ↩
-
Access to safe drinking water, affordable power, internet and public transport are all Sustainable Development Goal indicators. ↩
-
Specifically, all BII infrastructure investments into power, transport, ICT and Telecoms and water that were committed between 3 December 2007 and 30 August 2020 are in scope. For these investments, disbursed amounts are as per 31 January 2021. ↩
-
A quality scoring framework was applied which consisted of eight criteria, each of which was scored from 1 to 3 according to the rubric in the framework. The criteria covered the quality of the conceptual framework, methodology and results of the study. ↩
-
Version as per March 2021. ↩
-
Modelled impact pathway indicators are: annual generation (GWh), net generation cost (% change) and annual renewable generation (GWh). ↩
-
Modelled ultimate impact indicators are: total people reached (million), indirect jobs (thousands), GDP contribution (US$ million), annual CO2 avoidance (kilotonne CO2 equiv.) and annual CO2 emitted (kilotonne CO2 equiv.). ↩
-
All BII infrastructure investments into power, transport, ICT and water that were committed between 3 December 2007 and 30 August 2020 are in scope. For these investments, disbursed amounts are as at 31 January 2021. ↩
-
Excluding double counts, e.g. Globeleq was invested in indirectly through Actis in 2009 and directly in 2015. Active portfolio refers to current, partially realised and written down deals, but excludes fully realized and written off deals. ↩
-
Commitment figures are reported as delivered by BII. Throughout the report, analysis is done with disbursement figures rather than commitment. ↩
-
US$111 million of the US$157 million out of scope investments made through generalist funds are in ICT. Including these would increase the share of ICT to 25% and Power would decrease to 67%, with Transport largely unchanged. ↩
-
WASH sector is barely visible at 12 o’clock. ↩
-
An example of complementarity is Eranove, a company which is active in water and electricity distribution. Because it is invested in though the generalist fund ECP II, it is outside the scope of this Portfolio Evaluation. ↩
-
Note that Liquid Telecom was rebranded as Liquid Intelligent Technologies in 2021. ↩
-
Cook and Asian Development Bank, 2005; Csereklyei et al., 2019; Eberhard and Naude, 2017; Ketterer, 2014; Leung et al., 2019; McIntyre et al., 2016; Steward Redqueen, 2016; Steward Redqueen, 2017; Steward Redqueen, 2018; Wendle, 2013. ↩
-
See Evidence Rule #1 in section 3.3. Supporting studies are: Dinkelman, 2011; Dorothal and van der Linden, 2018; Eberhard and Naude, 2017; Lahr et al., 2010; Lenz et al., 2017; Lipscomb et al., 2013; Scott et al., 2013; Steward Redqueen, 2016; Steward Redqueen, 2017; Steward Redqueen, 2018; Stoddard et al., 2006. ↩
-
See Evidence Rule #3 in section 4.3. Supporting studies are: Alder, 2017; Bird and Straub, 2020; Calderon and Serven, 2004; Cavallo and Powell, 2019; Chandra and Thompson, 2000; Du et al., 2018; EIB, 2008; Elburz and Cubukcu, 2020; Fan and Chan-Keng, 2005; Ismail and Mahyideen, 2015; Leung and Tantirigama, 2011; Li et al., 2017; Olgunlenye et al., 2018; Saidi et al., 2020; Shatz et al., 2011; Stupak, 2018; Wang et al., 2020; What Works Centre, 2015. ↩
-
Akpan, 2014; Albarran and Carrasco, 2013; Cosar and Demir, 2014; Edmonds and Fujimura, 2006; Egger and Larch, 2008; Frontier Economics, 2017; Halaszovich and Kinra, 2018; IADB, 2016; Ismail and Mahyideen, 2015; Martinicus et al., 2017; Shinyekwa and Ntale, 2017; Tong et al., 2014; Wessel, 2019; What Works Centre, 2015. ↩
-
See Evidence Rule #4 in section 3.3. ↩
-
Aderogba and Adegboye, 2019; Cook et al., 2005; COWI A/S, 2008; Fan and Chan-Kang, 2004; Fan et al., 2004; Fan, et al., 2005; Hine et al., 2019; Khandker et al., 2006; Latif, 2002; Lei et al., 2019; Mu and de Walle, 2007; Popova, 2016; Wiegand et al., 2017. ↩
-
Abe and Wilson, 2009; Australian Aid et al., 2014; Bottasso et al., 2018; Halaszovich and Kinra, 2018; Ismail and Mahyideen, 2015; Rosson et al., 2011; US International Trade Commission, 2009; Vergauwen, 2010; Wessel, 2019; Wilson et al., 2003. ↩
-
Artal-Tur et al., 2016; Net Balance Management Group Pty Ltd., 2014; Bottasso et al., 2013; Çağlak et al., 2011; Carp and Barsan, 2003; CEBR, 2019; Chang, et al., 2014; Efimova and Gapochka, 2020; HPC Hamburg Port Consulting GmbH, 2017; Humphreys, 2017; Intervistas, 2019; MacNeill and Wozniak, 2018; Mateo-Mantecon et al., 2012; Hintzenweg, 2019; Santos et al., 2018; Seo and Park, 2018. ↩
-
See Evidence Rule #2 in section 3.3. Supporting studies are: Bottaso et al., 2014; Breidenbach and Mitze, 2015; CEBR, 2019; de Soyres et al., 2019; Doi et al., 2001; Efimova and Gapochka, 2020; Ginting et al., 2015; Han et al., 2019; HPC Hamburg Port Consulting GmbH, 2017; Humphreys, 2017; Jianping et al, 2017; Jouli and Allouche, 2016; Jouli, 2016; Kawakami and Doi, 2004; Merk et al., 2013; Morrissey et al., 2019; Park and Seo, 2016; Saidi et al., 2020; Santos et al., 2018; Shan, 2014; Song and van Geenhuizen, 2014; Wan and Wang, 2019; Zhao et al., 2020 ↩
-
The overall strength of evidence against standard of living is indicated as weak (despite limited evidence on incomes) to account for the searches having found no evidence for a large number of other standard of living variables. ↩
-
In line with BII’s Infrastructure strategy, for urban infrastructure, the evidence review focused on urban mobility including electric transport systems. ↩
-
Baertsch, 2020; Cats et al., 2014; Cervero, 2013; Combs, 2017; ESMAP, 2009; Gaduh et al., 2017; ITP and IBIS, 2009; King et al., n.d.; Pirie, 2013; Roşca, 2018; Yang et al., 2014. ↩
-
Alpkokin et al., 2016; Asian Development Bank, 2017); Baertsch, 2020; Echeverry et al., 2004; Ernst, 2005; ESMAP, 2009; Gaduh et al., 2017; Hidalgo and Yepes, 2005; Hidalgo et al., 2013; King et al., n.d.; Li and Liu, 2020; Tiwari and Jain, 2012; Tsivanidis, 2019b; Vaz and Venter, 2012. ↩
-
Asian Development Bank, 2017; Bel and Holst, 2015; Combs, 2017; ESMAP, 2009; Hidalgo et al., 2013; Kahn Ribeiro et al., 2007; King et al., n.d.; Li and Liu, 2020; Ortego et al., 2017; Wöhrnschimmel et al., 2008; Wright and Fulton, 2005. ↩
-
Bartelsman et al., 2019; Cariolle et al., 2018; Dalgıç and Fazlıoğlu, 2020; Garcia Zaballos and Lopez-Rivas, 2020; Grimes et al., 2012; Hagén et al., 2008; Hassett and Shapiro, 2016; Jung and López-Bazo, 2020; Thompson and Garbacz, n.d.; Waverman, 2009; Zhong et al., 2020. ↩
-
Abecassis et al., 2020; Atasoy, 2013; Atkinson et al., 2009; Bahia et al., 2020; Crandall and Lehr, 2007; Crandall et al., 2003; Fabritz, 2013; Garcia Zaballos and Lopez-Rivas, 2020; Google and IFC, 2020; Hassett and Shapiro, 2016; Hjort and Poulsen, 2019; Katz and Callorda, 2013; Katz et al., 2008; Katz, 2009; Katz, 2010; Katz, 2013; Kolko, 2010; Koutroumpis, 2019; Liebenau et al., 2009; Pelissie du Rausas et al., 2011; Poliquin, 2020; Shideler et al., 2007; Stockinger, 2017; Wieck and Vidal, 2011. ↩
-
Abecassis et al., 2020; Alderete, 2017; Amaghionyeodiwe and Annansingh-Jamieson, 2017; Badran, 2012; Czernich et al., 2011; Deloitte, 2014; Galperin and Viecens, 2017; Garcia Zaballos and Lopez-Rivas, 2020; Google and IFC, 2020; Hassett and Shapiro, 2016; ITU, 2019; Kathuria et al., 2018; Katz and Callorda, 2013; Katz and Koutroumpis, 2012; Katz et al., 2010; Katz, 2009; Katz, 2013; Koutroumpis, 2019; Lüdering, 2016; Quiang and Rossotto, 2009; Regeneris, 2018; Thompson and Garbacz, n.d.; World Bank, 2016. ↩
-
Anderson, 2018; BCG, 2014; Frost and Sullivan, 2011; Grünfeld et al., 2017; IHS Markit, 2019; Magnum Economics, 2020; OECD, 2014; Oliver et al., 2018; Oxford Economics, 2018; Thelle et al., 2017. ↩
-
Amaghionyeodiwe and Annansingh-Jamieson, 2017; Bold and Davidson, 2012; Calderón and Servén, 2004; Capital Economics, 2014; Edquist et al., 2017; ITU, 2019; Kathuria et al., 2018; Katz and Koutroumpis, 2012; Koutroumpis, 2019; Röller and Waverman, 2001. ↩
-
Aghajani Tir et al., 2014; Banerjee and Morella, 2011; Dadson et al., 2017; Frone and Frone, 2014; Gordon et al., 2011; Manzo and Bruno, 2015; Meeks, 2014; Musouwir, 2010; Quinn et al., 2014; SIWI, 2005; UNESCO, 2019; Value of Water Campaign, 2017. ↩
-
The other 16 were not used because: (i) they are not directly applicable to BII’s portfolio (e.g. evidence on rural roads does not apply to toll roads); (ii) the evidence refers to indexes which cannot be reconstructed for a single asset (e.g. quality of port infrastructure); (iii) better approximation methods are available, e.g. the Joint Impact Model or direct estimations of power cost effects based on actual investment information and country-specific data on existing stock; or (iv) the monitoring data required for application was not available. ↩
-
Figures based on contribution at the time of research; The numbers stated here cannot be compared to BII’s latest annual report because it includes exited investments, projected impacts of assets under construction. ↩
-
This covers all indirect effects (indirect, induced and enabled). ↩
-
This is a shift of GDP to a higher level but it does not affect the GDP growth rate. ↩
-
To prevent double counting of power production and fuel delivery of impact, the GDP, indirect jobs, people reached and CO2 emissions from midstream gas, are excluded from these results. ↩
-
An additional 176 million customers are reached through investment in MNOs. These are excluded from the aggregate figures. ↩
-
Climate impact is discussed in detail in Section 6.4. ↩
-
Figures based on contribution at the time of research; The numbers stated here cannot be compared to BII’s latest annual report because it includes exited investments, projected impacts of assets under construction. ↩
-
This covers all indirect effects (indirect, induced and enabled). ↩
-
This is a shift of GDP to a higher level but it does not affect the GDP growth rate. ↩
-
For BII attribution see Theme 5. ↩
-
BII’s stake in indirect investments is on average more than five times smaller than direct investments. ↩
-
Impact of investees which are invested in directly and through a fund are categorized here as direct investment. ↩
-
Not included is the impact of gas investments. To prevent double counting impact at multiple parts of the value chain, all impact is attributed to the power producer, rather than the gas supply. ↩
-
It should be noted that new capacity is not by definition a greenfield investment. The Portfolio Review distinguishes between greenfield investments (e.g. a new power plant), brownfield + investments (e.g. an existing company that expands its FTTH network), and brownfield investments (e.g. an infrastructure asset with no capacity expansion). ↩
-
This does not include the number of customers reached by telecom towers, which is unknown. ↩
-
BII disbursement amounts are stated because some large impacts are associated with small investments. ↩
-
Average difference between levelised cost of electricity (LCOE) of BII investee and countrywide average LCOE, weighted by MWh production. ↩
-
Includes broadband SME customers (27,954) and mini-grid SME customers (850). ↩
-
Excluded from the aggregate figures. ↩
-
Average reduction of Umeme and Eneo, weighted by disbursement amounts. ↩
-
Includes greenfield BII assets which are not yet operational. Compared to 2018 installed capacity per country. ↩
-
In this report we use weighted average LCOE, where each generation technology is weighted by its contribution to actual power generation, which depends on installed capacity and the average use of that capacity, the capacity factor. ↩
-
Estimated by comparing the average LCOE of the asset’s generation technology with country-average LCOE. ↩
-
From 2008-2014 Uganda had approximately 35 million inhabitants and an average household size of 4.5 members. Cameroon had approximately 25 million inhabitants with an average household size of 5.0. ↩
-
Two investments could not be rated, due to a lack of clear DI indicators and no disbursements being made respectively. ↩
-
We intend to revisit the DI performance in 2 years, after second phase of this evaluation has ended. ↩
-
For the 30 direct investments where the BI team made more in-depth interventions, there were at least two interventions in each case, and 130 interventions in total across these 30 investments. In some cases interventions were also made across several different underlying assets within an investment. ↩
-
We received detailed data for 30 of the 39 direct investments and assume that BII performed the standard level of due diligence and monitoring for the missing nine investments. It is likely that more was done for these deals. ↩
-
For about half of total disbursements in India no data is available on the state in which the investment is located. Additionally for investment in mobile network operators with operations in multiple countries, impacts cannot be associated to a specific country category. ↩
-
The estimation of people reached below the poverty line is calculated by multiplying the number of people reached in each country with the poverty headcount percentage at national poverty lines. We have made no assessment as to whether these people are equally likely to be reached as the population overall. ↩
-
Private Participation in Infrastructure (PPI) 2020 Half-year Report, World Bank, 2020. Projects included in the database do not have to be entirely privately owned, financed or operated, some have public participation as well. ↩
-
The magnitude of the overestimation bias is unknown and differs per country, but the PPI acknowledges that it mostly misses the smaller deals. The most extreme example is Tanzania where substantial PPI data gaps cause the BII’s estimated relative contribution to be unrealistic. ↩
-
Fay et al., 2019. ↩
-
The size of the bubbles scales with the amount of BII capital invested, and we draw attention to the logarithmic scale of both axes. BII’s relative contribution in Uganda appears unrealistically high. We note that the PPI database does not include two large new hydro investments as they are public investments. Egypt and Pakistan do not appear in the chart as their vertical axis value is below 0.01%. ↩
-
Lakmeehara et al., 2020. ↩
-
In infrastructure, the DI Grid score essentially expresses only country difficulty. ↩
-
The indicators used for the targeting analysis are specific to the subsector level: uutage frequency (IPP; T&D; C&I; and midstream gas); levelised cost of electricity and CO2 intensity of electricity production (IPPs), % rural population without electricity access (home solar; off-grid and mini-grid), T&D losses; share of gas going to electricity consumption (midstream gas); Logistic Performance Index (roads and logistic); Liner Shipping Connectivity Index (ports); mobile network coverage and mobile network performance (TowerCos and other mobile); Internet Bandwidth (backbone fibre and data centres). ↩
-
We refer for more detail to BII’s fossil fuel policy of December 2020. Investments that predate this policy have not been evaluated against it. ↩
-
World Resource Institute, 2017. ↩
-
In 2019 one more HFO investment was made through a fund that BII committed to in 2017, prior to the 2018 HFO policy. ↩
-
Since 2009, BII has owned the majority of Globeleq through its 84% stake in the Actis Infrastructure II fund. Here we allocate the Globeleq investment to 2015 to avoid double counting. It is also noteworthy that Globeleq’s Tsavo HFO plant in Kenya will be phased out in 2021 after which the company will have one HFO plant left in its portfolio. ↩
-
BII has invested twice in Globeleq: in 2009 through Actis, and in 2015 directly. The first investment is omitted here. We did not receive data on the original direct commitment to Globeleq in 2015 and assume that the commitment is equal to the disbursement. Fund IPP investments have been allocated to the date of BII commitment to the fund and take in proportion to the relative size of the IPP investment in the fund’s portfolio. ↩
-
For direct investments, BII’s calculations are based on fuel purchases, which is the most accurate data source. Indirect emissions have been calculated using the Joint Impact Model, which uses IPP revenue data. In the absence of data on fuel consumption, we think that BII can improve this by considering the actual power generation (GWh) together with the standard emission factors for the used generation technology. ↩
-
Scope 1-2. By also including Scope 3 emissions we estimate that emissions would increase by approximately 30%. ↩
-
https://carbonaccountingfinancials.com/files/downloads/PCAF-Global-GHG-Standard.pdf ↩
-
Do not include IPPs invested through funds. ↩
-
An asset which supports US$1,000,000 of GDP annually can do so over the entire duration of the investment. In each year of its lifetime the GDP is higher by this amount. ↩
-
Zandi, 2011 found that in the USA a $1 increase of infrastructure spending generates $0.57 of additional GDP. Bivens, 2012 provides a range of US$0.17–0.45. Rates of returns in developing markets are likely higher because of greater scarcity, which is in heuristic agreement with the $0.99 obtained here (USD 2,314 million GDP contribution on USD 2,345 million investment). ↩
-
Lowe et al., 2019. ↩
-
Midstream gas investments are excluded from all results; MNO investments are excluded from people reached to prevent inflation of results. ↩
-
Attribution calculated according to PCAF methodology introduced in Section 6.4. ↩
-
The high attribution share in Uganda is due to an impactful direct investment in the T&D space. ↩
-
The larger BII’s disbursements in a country (larger bubble size) the higher the country is expected in the graph. Exceptions to this are mostly caused by data gaps which have been filled with the average attribution rate for that sector. ↩
-
FinDev Canada; BII; OPIC (now DFC); CDP; Proparco; JBIC and JICA; DEG. ↩
-
2X Challenge Working Group Reference Guide (squarespace.com) [accessed 24 August 2021]. ↩
-
These calculations are based on the underlying data analysed and reported in the Gender Impact Data 2019 Overview; however, the scope of investees included in this analysis is as per the scope of the evaluation (which differs from the definition of infrastructure portfolio used in the Gender Impact Data report) and therefore aggregate figures will differ from those included in the Gender Impact Data 2019 Overview report. ↩
-
Based on limited data (25% coverage of total investments, both direct and indirect). ↩
-
CDC Group, 2020a. ↩
-
CDC Group, 2020b. ↩
-
2X Challenge, ‘Launch of the 2X Gender and Climate Finance Taskforce’, January 2021; https://www.2xchallenge.org/new-blog/2021/1/12/investing-in-women-tackling-climate-change [accessed 3 June 2021]. ↩
-
Köhlin et al., 2011. ↩
-
African Development Bank, 2016. ↩
-
Ibid. ↩
-
Figures based on contribution at the time of research; The numbers stated here cannot be compared to BII’s latest annual report because it includes exited investments, projected impacts of assets under construction. ↩
-
This covers all indirect effects (indirect, induced and enabled). ↩
-
This is a shift of GDP to a higher level but it does not affect the GDP growth rate. ↩