Estimating the economic and social value of volunteering
Published 11 July 2025
Applies to England

© Crown copyright 2025
This publication is licensed under the terms of the Open Government Licence v3.0 except where otherwise stated. To view this licence, visit nationalarchives.gov.uk/doc/open-government-licence/version/3 or write to the Information Policy Team, The National Archives, Kew, London TW9 4DU, or email: psi@nationalarchives.gov.uk.
Where we have identified any third party copyright information you will need to obtain permission from the copyright holders concerned.
This publication is available at https://www.gov.uk/government/publications/estimating-the-economic-and-social-value-of-volunteering/estimating-the-economic-and-social-value-of-volunteering
1. Estimating the economic and social value of volunteering
About London Economics
London Economics is one of Europe’s leading specialist economics and policy consultancies headquartered in London. We advise clients in both the public and private sectors on economic and financial analysis, policy development and evaluation, business strategy, and regulatory and competition policy.
Our consultants are highly-qualified economists with experience in applying a wide variety of analytical techniques to assist our work, including cost-benefit analysis, multi-criteria analysis, policy simulation, scenario building, statistical analysis and mathematical modelling. We are also experienced in using a wide range of data collection techniques including literature reviews, survey questionnaires, interviews and focus groups.
Head Office:
Somerset House, New Wing
Strand
London
WC2R 1LA
United Kingdom
+44 (0)20 3701 7700
Acknowledgements
We would like to acknowledge the useful guidance and feedback provided by the DCMS team, Basis Social and NPC. We would like to thank all those who participated in the practitioner group and advisory group for their helpful comments when devising the methodology for this report. Responsibility for the contents of this report remains with London Economics.
Authors
-
James Cannings, Senior Economic Consultant, jcannings@londoneconomics.co.uk
-
Ella Lingard, Economic Consultant, elingard@londoneconomics.co.uk
-
Moritz Profanter, Economic Consultant, mprofanter@londoneconomics.co.uk
-
Pietro Patrignani, Principal Consultant, ppatrignani@londoneconomics.co.uk
-
Dr Gavan Conlon, Partner, gconlon@londoneconomics.co.uk
2. Executive Summary
The Department for Culture, Media and Sport (DCMS) commissioned London Economics, working with Basis Social and New Philanthropy Capital (NPC) to monetise the economic and social value of volunteering in England. The work implements a methodology developed for DCMS by combining desk research and stakeholder workshops with academics, local government officials, funders, and voluntary, community, and social enterprise (VCSE) organisations.
This report examines the benefits of adult formal volunteering, which refers to giving unpaid help to groups or clubs by individuals aged 16 and over and aligns with the DCMS’s Community Life Survey (CLS) definition. The report estimates the monetary value of formal volunteering activity in England in 2021/22. During that period, approximately 12 million people formally volunteered at least once.
The report examines 5 strands of the value of volunteering:
-
The replacement cost of volunteering, which values the benefits of volunteering by valuing the cost of replacing volunteers with paid staff.
-
The wellbeing benefits to volunteers, which values the benefits of life satisfaction improvements for volunteers as a result of volunteering.
-
The effect of volunteering on employment outcomes, which examines the effect of volunteering on the hourly pay, hours worked and the probability of paid employment of volunteers.
-
The effect of volunteering on healthcare costs, which examines the effect of volunteering on the number of healthcare appointments (GP, outpatient and inpatient) of volunteers.
-
The effect of volunteering on social outcomes, which examines the effect of volunteering on a range of social outcomes of volunteers, such as isolation, loneliness, and belonging to a neighbourhood.
We provided monetary estimates for the first two strands (replacement cost and wellbeing benefits), but we could not provide monetary estimates for other strands, as we did not identify robust statistical relationships between volunteering and those outcomes. Instead, we present results from our econometric analysis for those strands.
In addition to the above strands, there are many benefits that, while just as important as those included in this analysis, could not be included due to data limitations. These benefits are included in a conceptual framework that was developed as part of the methodology for this work and are shown in Annex A1.1.3.
The total economic impact of formal volunteering activity in England in 2021/22, based on the replacement cost and wellbeing benefits of volunteering, was estimated at £24.69 billion.[footnote 1] This represents an average economic impact of £2,012 per volunteer. The other main results from the report are as follows:
-
The cost of replacing volunteers with paid staff in England in 2021/22 (the replacement cost) was estimated at £16.43 billion.
-
The value for the replacement cost of volunteering was driven predominantly by the most frequent volunteers (those who volunteered at least once a week), with 63% of the total impact originating from that group. This result highlights the importance of retaining the most frequent volunteers, and encouraging more frequent volunteering, to maximise the impact of volunteers.
-
The replacement cost of formal volunteering in 2021/22 was equivalent to £1,339 per volunteer.
-
The monetised value of the wellbeing benefits experienced by volunteers in England in 2021/22 was estimated at £8.26 billion.
-
This wellbeing benefit was equivalent to £673 per volunteer.
-
Volunteering at least once a year leads to a 0.033-unit increase in volunteers’ life satisfaction on a 1 to 7-point scale. This effect is largest for those who volunteer at least once a month but less than once a week (a 0.061-unit increase).
-
We identified limited evidence to suggest that volunteering increases the likelihood of paid employment one year after becoming a volunteer, but it has a positive impact on employment two and three years after becoming a volunteer. We found a positive effect on employment for those aged 16 to 25, but a negative for those aged 46 to 65. These results suggest that volunteering may act as a pathway to work, particularly for younger people, although our analysis does not identify specific factors that would cause this employment effect (such as building skills).
-
Volunteering in the last 12 months is associated with 1.2% lower pay than non-volunteers in the following year. This effect is strongest for those who volunteer at least once a week, as this is associated with a 2.8% lower hourly pay in the next year, compared to non-volunteers. However, the effect does not persist over time, except for those who volunteer at least once a week. In addition, this effect may not be causal, as external factors may both increase volunteering incidence and affect individuals having lower hourly pay, such as an increase in a partner’s wages.
-
We identified weak evidence that volunteering leads to a small decrease in the number of hours worked by volunteers in paid employment (by around 8 minutes per week), but only for volunteers over the age of 25. Those aged under 25 work for more hours after volunteering, which suggests that volunteering may complement paid work for younger people but act as a substitute for paid work for older people (albeit to a limited extent).
-
We examined the impact of volunteering on the number of healthcare appointments for volunteers to understand how their improved health outcomes could decrease government healthcare costs. We identified weak evidence to suggest that volunteering leads to a small decrease in the number of days spent by volunteers as an inpatient, but there was limited evidence to suggest that volunteering affects the number of GP appointments or outpatient visits of volunteers.
-
Volunteers are 2.4 percentage points more likely than non-volunteers to agree that they feel a sense of belonging to their neighbourhood and are 10.4 percentage points more likely to express a willingness to improve their neighbourhood. However, these results cannot be treated as a causal effect, as these factors may also cause individuals to start volunteering.
-
There is very weak evidence to suggest that volunteers are more likely to report feeling isolated, having a lack of companionship, feeling left out or feeling lonely than non-volunteers.
3. Introduction
The Department for Culture, Media and Sport (DCMS) commissioned London Economics, working with Basis Social and New Philanthropy Capital (NPC), to monetise the economic and social value of volunteering in England. The work forms part of a wider programme of volunteering research commissioned by DCMS, which is designed to strengthen the evidence base around volunteering. This report aims to examine the value generated by formal volunteering activity in 2021/22, matching that year’s Community Life Survey (see Section 4 for more details).
This work implements a methodology developed for DCMS using a combination of desk research and stakeholder workshops with academics and practitioners (local government officials, funders, and voluntary, community and social enterprise organisations). While the initial methodology developed considered both the benefits and costs of volunteering, this report only considers the benefits of volunteering due to the difficulty of accurately capturing the costs of volunteering. In addition, there are many benefits that, while just as important as those included in this analysis, could not be included due to data limitations. These benefits, alongside a conceptual framework, further information on the development of the methodology, and the reasons for excluding some benefits and costs, can be found in Annex 1.
The methodology used here is designed to be general, focusing on adult formal volunteering activity in England.[footnote 2] ‘Adult formal volunteering’ refers to ‘the giving of unpaid help to groups or clubs by those aged 16 and over’, aligning with the definition used in DCMS’s Community Life Survey (DCMS, 2023). The scope is limited to adult formal volunteering activity as formal volunteering is the type of volunteering activity that DCMS has primarily supported through its funding activities in recent years. The restriction of the analysis to adult volunteering is a result of data availability.
DCMS commissioned this report to be able to articulate the value generated by volunteers in monetary terms across a wide range of dimensions, including wellbeing, following HM Treasury’s 2021 Green Book update on guidance for wellbeing appraisal (HM Treasury, 2022). The work is intended to make the case for investment in volunteering that is linked to other policy objectives, and in a way that achieves the needs of local communities.
While the methodological framework used here focuses on England, we see this as a starting point to comprehensively capture the value of volunteering across more outcomes than in previous valuations of volunteering (such as the inclusion of wellbeing and employment outcomes). We anticipate that the methods and derived parameters could be used to analyse the impact of specific volunteering programmes or to provide more local-level estimates of the value of volunteering. There were also parts of the methodology that were developed but not implemented in this analysis. We describe these methodologies in Annex A1.2 and Annex A1.4 to allow these proposed approaches to be adopted in other studies.
While previous studies have examined some of the strands considered in this work, generally speaking, they are neither up to date, nor have they considered the wider range of potential sources of value incorporated into this study. We have not identified any previous study in the UK that has considered as wide a range of sources of value as examined in this work.[footnote 3]
The total economic and social value of volunteering presented here can be considered an underestimate relative to the full range of benefits from volunteering. We were unable to monetise some strands of analysis, due to the econometric results not being sufficiently robust.[footnote 4] In some cases, this could be due to potential effect sizes being small, which makes it difficult to draw robust conclusions.
The report is based on 2021/22 volunteering data, where formal volunteering levels were lower than in previous years. While these figures may have been impacted by the COVID-19 pandemic and associated guidance introduced in the UK, it should be noted that the latest 2023/24 data suggests that formal volunteering levels have not increased since the pandemic.
In this report, we outline the key data sources used in Section 4, then detail our econometric strategy in Section 5.
This report then considers the economic and social value of volunteering across 5 strands:
-
The replacement cost of volunteering, which values the labour value of volunteering by estimating the cost (to volunteer-involving organisations) of replacing volunteers with paid staff Section 6.
-
The wellbeing benefits to volunteers, which values the benefits of life satisfaction improvements for volunteers as a result of volunteering Section 8.
-
The effect of volunteering on employment outcomes, which examines the effect of volunteering on the hourly pay, hours worked and the probability of paid employment of volunteers Section 6.
-
The effect of volunteering on healthcare costs, which considers the effect of volunteering on the number of healthcare appointments (GP, outpatient and inpatient) of volunteers Section 9.
-
The effect of volunteering on social outcomes, which examines the effect of volunteering on a range of social outcomes of volunteers, such as isolation, loneliness, and the sense of belonging to a neighbourhood Section 10.
We then present the total value of volunteering of the monetised outcomes (replacement cost and wellbeing benefits) in Section 11.
4. Key data sources
Across our methodologies, we use two key secondary data sources: the Community Life Survey and Understanding Society, which are described below. Additional secondary data sources (for example, ONS mid-year population estimates) were used to monetise elements of the proposed methodology and are described further in the relevant sections.
4.1 Community Life Survey
The Community Life Survey is a representative survey of adults aged 16 or above in England, run regularly by DCMS.[footnote 5] At the time of analysis, the most recently published wave provided data from October 2021 to September 2022.[footnote 6] The survey provides information on the type and frequency of volunteering.[footnote 7] We used the following data in our analysis:
-
Frequency of formal volunteering in the last 12 months (at least once a week; less than once a week but at least once a month; less than once a month).
-
Type of formal volunteering activity (within the last 12 months).[footnote 8]
-
Number of hours volunteered formally within the last four weeks.[footnote 9]
It is important to note that formal volunteering incidence was lower than in previous years in the 2021/22 survey. While these figures may have been impacted by the COVID-19 pandemic and associated guidance introduced in the UK, it should be noted that the latest 2023/24 data suggests that formal volunteering levels have not increased since the pandemic.
4.2 Understanding Society
Understanding Society is the largest household longitudinal survey in the UK, conducted with a sample of around 40,000 households.[footnote 10] It has run since 2009, and combined with its predecessor, the British Household Panel Survey (BHPS), provides yearly data since 1991. It provides data on the incidence and frequency of volunteering and the number of hours formally volunteered by adults (aged 16 and over) in the last 12 months. At the time of this analysis, the most recent data on volunteering was available from 2018-2020 (wave 10),[footnote 11] but data on other variables is available in subsequent waves, up to wave 13 (2021-2023). It asks questions about:
-
Whether individuals have formally volunteered in the last 12 months.[footnote 12]
-
Frequency of formal volunteering in the last 12 months.
Data on these volunteering variables was collected in the following years: 2010-12 (wave 2), 2012-14 (wave 4), 2014-16 (wave 6), 2016-18 (wave 8) and 2018-20 (wave 10).
Alongside volunteering data, the survey provides detailed information on the social and economic characteristics of respondents, such as life satisfaction, health, and income. Its longitudinal design, which follows the same individuals over time, allows for an analysis of how each individual’s outcomes change over time. The longitudinal design, combined with volunteering and outcome data, has been used frequently within the academic literature to estimate the effect of volunteering on outcomes, such as life satisfaction (Lawton and others, 2021), mental wellbeing (Tabassum and others, 2016) and employment outcomes (Paine and others, 2013; Wilson and others, 2020). The consistent use of Understanding Society in peer-reviewed articles to estimate the impact of volunteering indicates its reliability for producing robust estimates.
5. Econometric strategy
We used Understanding Society to derive parameters to estimate the impact of volunteering on:
-
Wellbeing improvements of volunteers.
-
Employment outcomes of volunteers.
-
Healthcare costs of volunteers for the government.
-
Social outcomes of volunteers.
The outcome variables used are shown in Table 1.
Our analysis estimated the impact of volunteering based on two volunteering variables available in Understanding Society:
-
Incidence of volunteering: whether individuals volunteered in the past 12 months.
-
Frequency of volunteering: how often individuals volunteered in the past 12 months.[footnote 13]
Where possible, we used volunteering data from five waves of Understanding Society.[footnote 14]
Table 1: Understanding Society variables used in the econometric analysis
| Outcome | Understanding Society variable(s) |
|---|---|
| Wellbeing improvements for volunteers | Satisfaction with life overall (1-to-7-point scale) |
| Improved employment outcomes for volunteers | Paid employment status, Hourly pay, Weekly hours worked, Total gross personal monthly labour income |
| Reduced healthcare costs for the government and individuals[footnote 15] | Number of times visiting a GP in the last 12 months, Number of times attending a hospital or clinic as an outpatient in the last 12 months, Number of days as an inpatient in the last 12 months |
| Individual social benefits for volunteers[footnote 16] | Feeling of belonging to the neighbourhood, Willingness to improve the neighbourhood, Social isolation, Lack of companionship, Feeling left out, Feeling lonely |
Note: Variables are available in all waves of Understanding Society unless otherwise specified.
Source: London Economics’ analysis of Understanding Society
5.1 Addressing selection bias
To estimate the value of volunteering using survey data, the main issue that needs to be overcome relates to selection bias. Individuals volunteer for a reason and therefore volunteers potentially differ from non-volunteers in terms of their personal or socioeconomic characteristics. For example, simply comparing the wellbeing outcomes of volunteers to non-volunteers would yield a biased outcome. The reason for this is that individuals who choose to volunteer may have had higher wellbeing than non-volunteers, even if they had chosen not to volunteer.[footnote 17] In other words, higher wellbeing may increase the probability of becoming a volunteer (Stuart and others, 2020).
To address this, we used fixed effects estimation[footnote 18] through the incorporation of control variables to overcome this selection bias issue. This approach is in line with previous literature (for example, Lawton and others, 2021; Wilson and others, 2020). Fixed effects estimation overcomes selection issues by controlling for time-invariant individual characteristics, reducing bias from unobservable characteristics that affect both the decision to volunteer, and the measured outcomes that are likely to be inherent personal characteristics (for example, altruism) that do not change over time. There may still be time-variant factors that bias our estimates (specifically, any time-variant factors that correlate with the probability of volunteering and the outcomes of volunteering) that we are unable to control for. However, the rich dataset of time-varying control variables within Understanding Society should minimise this issue. When presenting the results of the analysis, we highlight where the results may be driven by this shortcoming of fixed effects estimation.
5.2 Estimation equations
We used two estimation equations for each type of volunteering variable (incidence and frequency), depending on whether we estimated the effect of volunteering at time t or time t-1 on outcome variables at time t.[footnote 19]
For wellbeing and social outcomes, we estimated the effect of volunteering at time t on outcomes at time t, as these benefits are expected to be immediate. For these outcomes, we used estimation equation (1) for volunteering incidence and (2) for volunteering frequency:
-
yᵢₜ = αᵢ + β₁Vᵢₜ + β₂Xᵢₜ + εᵢₜ
-
yᵢₜ = αᵢ + β₁Wᵢₜ + β₂Xᵢₜ + εᵢₜ
Where:
-
yᵢₜ represents the outcome at time t (for example, wellbeing, social benefits)
-
αᵢ represents time-invariant individual-specific characteristics that affect the outcome
-
Vᵢₜ represents whether an individual formally volunteers at time t (volunteering incidence)
-
Wᵢₜ represents the frequency of volunteering at time t, with four categories:
* 0, has not volunteered in the last 12 months
* 1, has volunteered less than once a month in the last 12 months
* 2, has volunteered less than once a week but at least once a month in the last 12 months
* 3, has volunteered at least once a week in the last 12 months
- Xᵢₜ represents a vector of time-varying factors at time t that affect the outcome ( ).[footnote 20]
For employment and healthcare outcomes, we analysed the effect of volunteering at time t-1 on outcomes at time t, reflecting the potential delayed effects of volunteering on these measures. For this analysis, we used estimation equations (3) and (4):
-
yᵢₜ = αᵢ + β₁Vᵢ₍ₜ₋₁₎ + β₂Xᵢₜ + εᵢₜ
-
yᵢₜ = αᵢ + β₁Wᵢ₍ₜ₋₁₎ + β₂Xᵢₜ + εᵢₜ
Where:
-
yᵢₜ represents the outcome at time t (for example, wages, number of GP appointments)
-
Vᵢ₍ₜ₋₁₎ represents whether an individual formally volunteers at time t-1
-
Wᵢ₍ₜ₋₁₎ represents the frequency of volunteering at time t-1
The control variables used in the regressions are provided in Annex A1.9.1.
5.3 Econometric models
The type of econometric model used[footnote 21] in our analysis varied depending on the nature of the outcome variable:
-
For binary outcome variables (for example, employment status), we used a fixed effects logistic model.[footnote 22]
-
For ordinal outcome variables (for example, GP appointments, and outpatient visits), we used fixed effects ordered logistic models.[footnote 23][footnote 24]
-
For all other outcome variables (for example, wellbeing, wages, hours worked, and inpatient days), we used fixed effects models.
As a result, the interpretation of the regression coefficients varies across outcome variables. The interpretations are explained in the relevant sections.
We applied a range of econometric specifications in addition to the main specifications, including ordinary least squares (OLS) models. We conducted additional robustness checks by examining the effect of volunteering at time t-2 and t-3, on employment and healthcare outcomes at time t. We also explored whether the impact of volunteering varied across different age groups. For wellbeing, since we focus on the effect of volunteering at time t on wellbeing at time t (due to the immediate nature of the benefits), we applied a first-difference estimation to assess the change in wellbeing based on changes in volunteering status between time t-2 and time t.[footnote 25] These additional results are provided in Annex A1.9.
6. Replacement cost of volunteering
One important element of the economic value of volunteering is the value of the activities undertaken by volunteers. In previous literature (for example, International Labour Organization (ILO) Department of Statistics, 2021; Nesta, 2020; Office for National Statistics, 2013), the replacement cost method has been used to value the labour cost of volunteering. This method considers the cost that volunteer-involving organisations would incur to replace volunteers with paid staff to maintain the provision of their services.
In other words, the replacement cost method takes an ‘input’ approach, viewing volunteers’ activities as a benefit to VIOs by calculating the labour costs avoided by involving volunteers instead of paid staff. While this approach is also applied here, the replacement cost can also be considered as a proxy for the added value of the ‘output’ of volunteering activities. In other words, the replacement cost method estimates the added value of the services provided by volunteers by estimating the value of the labour used to produce these outputs.[footnote 26] The assumptions and limitations implied by this method are discussed in more detail in Section 6.2.
6.1 Methodology
The replacement cost method assumes a counterfactual where volunteers are absent and VIOs would need to employ paid staff to maintain the provision of their services. The approach values volunteer hours by considering the market wage rate that would be required to pay a given volunteer. We built upon the approach used by the Office for National Statistics (ONS) in the Household Satellite Accounts (Office for National Statistics, 2013), and more recently by Martin and Franklin (2022). Broadly, the approach identified the key activities undertaken by volunteers, which were matched to proxy wages associated with each activity. These wages were then multiplied by the estimated number of hours volunteered in each activity in 2021/22 to determine the replacement cost of volunteering in 2021/22.
Specifically, using a seven-step approach, we:
-
Assigned the 13 volunteering activity types from the 2021/22 Community Life Survey to proxy Standard Occupational Classification (SOC) 2020 occupations, based on an ONS mapping (Office for National Statistics, 2013).[footnote 27] The mapping is presented in Table 26 in Annex A1.7(#a17-replacement-cost-mapping).
-
Assigned a proxy wage to each volunteering activity type using annual median pay data by SOC occupation from the 2021 Annual Survey of Hours and Earnings (Office for National Statistics, 2024a).[footnote 28]
-
Estimated the share of volunteers associated with each proxy SOC occupation (based on volunteering activities) by volunteering frequency category using the 2021/22 Community Life Survey.
-
Estimated the number of volunteers in England in 2021/22 by frequency category, by multiplying the share of volunteers in each volunteering frequency category (as a share of all respondents) from the 2021/22 Community Life Survey by the population of England aged 16 and over in mid-2021 (Office for National Statistics, 2023).
-
Estimated the total number of hours volunteered within each volunteering frequency category in 2021/22, by initially multiplying the average number of hours volunteered in the last 4 weeks by frequency category[footnote 29] by the number of volunteers in England by frequency category (from step 4). This four-weekly figure was then converted to a yearly figure.
-
Estimated the total number of hours volunteered in each proxy SOC occupation (by frequency category), by multiplying the outputs from steps 3 and 5.
-
Estimated the total replacement cost of formal volunteering in 2021/22 by multiplying the output from step 6 by the associated proxy wage associated with each SOC occupation (from step 2) then aggregating across SOC occupations.
6.2 Assumptions and limitations
The replacement cost approach values volunteering from an economic perspective and implicitly assumes perfect substitutability between volunteers and paid staff. In other words, it assumes that replacing one full-time equivalent volunteer with one full-time equivalent paid staff member would result in the same outcomes. Whilst it provides a method to produce a monetary value of the work undertaken by volunteers, it may not align with how volunteers or VIOs view volunteering, as it can be seen as characterising volunteering as ‘free labour’. It can also lead to certain types of volunteering appearing more valuable than others because the market wage associated with those activities is higher. In addition, many in the VCSE sector would argue that volunteering is fundamentally different from paid work and therefore is not comparable. In future work, these limitations could be addressed by estimating a factor to adjust the replacement cost (for example, using primary data collection), but calculating such a factor has logistical and conceptual difficulties (see Annex A1.5 for further discussion).
Other limitations relate to the lack of granularity of volunteering activity data, meaning that relatively broad occupations are matched to each volunteering activity type, which may not fully reflect the nature of volunteering activities and the associated cost of replacing them. Additionally, the CLS only provides data on whether or not volunteers participate in certain activities, and the overall frequency of volunteering, but does not provide data specifically on the frequency of volunteering in each activity. Therefore, those volunteering across activity types are assumed to spend equal time in each activity type. Finally, we assume that there would be no general equilibrium effects (effects on market wages) if volunteers were replaced by paid staff. This assumption will hold at the margin, but if all volunteers were replaced by paid staff, the market wage would be likely to increase due to increased labour demand.
We also do not include any non-wage costs of employment, such as National Insurance or pension contributions. While these costs would be relevant if an organisation decided to replace volunteers with paid staff, they are not relevant in valuing the activities undertaken by volunteers.
6.3 Monetisation results
We estimated that the total replacement cost of volunteers in England in 2021/22 stood at £16.433 billion.[footnote 30] This represents the labour costs that VIOs avoided by involving volunteers rather than paid staff. In other words, in the absence of volunteers, VIOs would have needed to pay a total of £16.433 billion to staff to maintain the provision of volunteering outputs in England in 2021/22 (assuming no general equilibrium effects).
This result was driven predominantly by the most frequent volunteers (at least once a week), who accounted for around 63% of the impact (£10.276 billion), despite only making up around 30% of volunteers (see Annex A1.6 for the total number of volunteers and hours volunteered). This was because they contributed around 2.4 times the number of weekly hours of those who volunteered less than once a week but at least once a month, and 6.4 times the quantity of those who volunteered less often than once a month. Those volunteering less than once a week but at least once a month accounted for 26% of the total impact (£4.312 billion), with the least frequent volunteers (less than once a month) accounting for the remaining 11% of the impact (£1.846 billion).
The results would suggest the importance of retaining existing frequent volunteers and encouraging volunteers to volunteer more frequently, given the large contribution that they make to the overall economic value of volunteering.
The overall magnitude of the results is similar to those found in other studies. For example, in the Household Satellite Account, the Office for National Statistics estimated the value of organisation-based volunteering to the UK economy in 2022 to be £14.636 billion (Office for National Statistics, 2024d).
Table 2: Total replacement cost by volunteering frequency
| Volunteering frequency | Total hours volunteered in 2021/22 (A) | Average value of volunteering per hour (B) | Total replacement cost (A*B) |
|---|---|---|---|
| At least once a week | 766.7m | £13.40 | £10.276bn |
| Less than once a week but at least once a month | 327.6m | £13.16 | £4.312bn |
| Less often than once a month | 150.6m | £12.25 | £1.846bn |
| Total | 1,244.9m | £13.20 | £16.433bn |
Note: Totals may not add up due to rounding. The average value of volunteering per hour was calculated by dividing the total replacement cost in each volunteering frequency category by the corresponding number of hours volunteered.
Source: London Economics’ analysis of Community Life Survey, Annual Survey of Hours and Earnings and Office for National
We also estimated the average replacement cost per volunteer in each frequency category (see Table 3). These figures are obtained by dividing the total replacement cost by the number of volunteers in each frequency category. As with the overall results presented in Table 2, those volunteering at least once a week have, on average, the highest replacement cost (£2,746) compared to other frequency categories.
Table 3: Average replacement cost per volunteer by volunteering frequency
| Volunteering frequency | Average replacement cost per volunteer |
|---|---|
| At least once a week | £2,746 |
| Less than once a week but at least once a month | £1,131 |
| Less often than once a month | £391 |
| At least once in the past 12 months | £1,339 |
Note: Figures are rounded to the nearest pound. The estimate of the average replacement cost of those who volunteered at least once in the past 12 months (£1,339) represents the average across all formal volunteers in England in 2021/22.
Source: London Economics’ analysis of Community Life Survey, Annual Survey of Hours and Earnings and Office for National Statistics population data.
7. Wellbeing benefits to volunteers
Previous studies found that there was a positive relationship between volunteering and the wellbeing of volunteers (Lawton and others, 2021; Stuart and others, 2020). A number of other studies have identified a range of potential mechanisms for this effect, such as social interactions (Dolan and others, 2021), engagement in physical activity (for example, outdoor activities, sports), and improved health (Nichol and others, 2024).
While wellbeing can be defined in different ways (for example, subjective life satisfaction, mental and physical wellbeing), one common approach has been to use the subjective life satisfaction index as a proxy for wellbeing (Dolan and others 2021; Lawton and others 2021).[footnote 31] We used a life satisfaction index as a proxy for wellbeing, as it is recommended for wellbeing monetisation in the Green Book supplementary guidance on wellbeing (HM Treasury, 2022); is available in Understanding Society data; and can be monetised using ‘wellbeing adjusted life years’ (WELLBYs). The WELLBY value measures the monetary value of a one-unit improvement in self-reported life satisfaction (on a 0-10 scale) in one year (HM Treasury, 2022).
In this section, we only consider the impact of volunteering on the wellbeing of volunteers. The ‘beneficiaries’ of volunteering activities (or ‘service users’)[footnote 32] may also experience wellbeing improvements from volunteering. We discuss the reasoning behind their exclusion further in Annex A1.1.
7.1 Methodology to monetise the impact of volunteering on volunteer wellbeing
We monetised the impact of volunteering on wellbeing using the three inputs shown in Table 4.
Table 4: Wellbeing monetisation inputs
| Input | Description | Source |
|---|---|---|
| A | Impact of volunteering on life satisfaction | Estimates of the impact of volunteering on wellbeing from Understanding Society |
| B | Central value of a WELLBY in 2021 prices | Calculations based on HM Treasury (2022) guidance |
| C | Number of volunteers in England in 2021/22 | 2021/22 Community Life Survey and ONS population estimates |
| A*B*C | Total value of wellbeing benefits of volunteering in 2021/22 |
Source: London Economics’ analysis
This three-step monetisation method is used widely in the literature when estimating the impact of formal volunteering incidence on wellbeing.[footnote 33] We define volunteering incidence as having volunteered at least once in the last 12 months.
Step 1: Estimate the impact of volunteering on life satisfaction
We used Understanding Society to estimate the quantitative impact of volunteering incidence on wellbeing. Our econometric strategy to estimate these wellbeing impacts, and more information on the key variables used, is provided in more detail in Section 5.
We produced an estimate for the effect of volunteering incidence (having volunteered at least once in the past 12 months) and three different estimates for the impact of volunteering by frequency of volunteering activity.[footnote 34] The estimates represent the unit increase on a 1-to-7-point life satisfaction scale that is associated with volunteering incidence and volunteering frequency.[footnote 35] Our main estimates presented in this section are based on volunteering incidence, but we present the results and monetisation inputs for volunteering frequency in Table 27 in Annex A1.8.
Step 2: Adjust the central WELLBY value to 2021 prices and to a 1-to-7-point scale
According to Green Book supplementary guidance, the WELLBY value stood at £13,000 in 2019 prices. We converted this to 2021 prices using the following equation:[footnote 36]
Next, we multiplied the WELLBY value by 11/7 to convert the estimate from a 0-to-10 scale to a 1-to-7 scale, as recommended in the Green Book supplementary guidance (HM Treasury, 2022). This transformation was necessary because the life satisfaction variable used in the Understanding Society analysis is based on a 1-to-7 scale, while the WELLBY value is based on a 0-to-10 scale.
Step 3: Calculate the number of volunteers in England in 2021/22
Following the same approach as used in the replacement cost method (see Section 6, we estimated the number of volunteers using the 2021/22 CLS and 2021 ONS annual mid-year population statistics for individuals aged 16 years or above.
7.2 Econometric results
Following our econometric strategy from Section 5, we estimated the impact of volunteering on life satisfaction using Understanding Society. We also produced estimates of this impact for different age groups to show how the impact of volunteering on wellbeing differs by age. Table 5 presents the results from these regressions.
Estimating the impact of volunteering incidence on life satisfaction across all age groups produced a coefficient of 0.033 which is statistically significant at the 1% level (indicating a strong significance). This means that volunteering at least once in the past 12 months results in a 0.033-unit increase on a 1-to-7-point life satisfaction scale relative to those who do not volunteer.[footnote 37]
Our estimates by age suggest that volunteers aged between 45 to 65 experience the highest increases in wellbeing from volunteering (a 0.047-unit increase). The estimates for other age groups are not statistically significant, meaning there is not enough evidence to make a conclusive statement about the size of the wellbeing benefits of volunteering for these age groups. However, the coefficients are all positive, suggesting that the positive relationship between volunteering and life satisfaction may hold across age groups.
Considering the impact broken down by volunteering frequency, the impact of volunteering on life satisfaction was highest for those volunteering at least once a month but less than once a week (a 0.061-unit increase). This result is statistically significant at the 1% level and suggests that volunteering at this frequency may represent an ideal level of volunteering to achieve the highest wellbeing benefits. This effect also holds across almost all age groups, with the average impact of volunteering at least once a month but less than once a week on life satisfaction being the highest in most age groups compared to the other frequency categories. Volunteers aged over 65 are the only exception, where volunteering at least once a week has the highest wellbeing benefits (a 0.065-unit increase).
Based on these findings, it was appropriate to monetise the results. This was because the overall results for the impact of volunteering in the past 12 months were strongly significant, the positive effect held across age groups and alternative econometric specifications (see Annex A1.9), and the results aligned with other findings from the academic literature. For example, Lawton and others (2021) found an overall effect size of 0.041 using a similar methodology and older data, compared to the overall effect size of 0.033 identified here.
Table 5: Regression coefficients for the impact of volunteering on life satisfaction
| All ages | Aged 16–25 | Aged 26–45 | Aged 46–65 | Aged over 65 | |
|---|---|---|---|---|---|
| Volunteering incidence | |||||
| At least once in the past 12 months | 0.033*** | 0.017 | 0.029 | 0.047** | 0.029 |
| Observations | 183,939 | 25,428 | 57,687 | 63,100 | 37,724 |
| Volunteering frequency | |||||
| Less than once a month | 0.017 | 0.010 | 0.009 | 0.031 | -0.003 |
| At least once a month but less than once a week | 0.061*** | 0.132** | 0.054 | 0.087*** | 0.012 |
| At least once a week | 0.034** | -0.011 | 0.041 | 0.036 | 0.065* |
| Observations | 183,863 | 25,410 | 57,674 | 63,075 | 37,704 |
Note: Based on a fixed effects model estimating the impact of volunteering at time t on life satisfaction at time t. Each column is based on two regressions: one for volunteering incidence (a binary variable based on whether an individual volunteers or not) and one for volunteering frequency. A coefficient of 0.033 suggests that, on average, volunteering leads to a 0.033-unit increase on a 1-to-7-point life satisfaction scale. The *-signs indicate the statistical significance of the estimates: *** p-value < 0.01, ** p-value < 0.05, * p-value < 0.1. Values in bold indicate statistical significance at the 10% level or higher.
Source: London Economics’ analysis of Understanding Society
7.3 Monetisation results
Based on the incidence of volunteering, we estimate the total wellbeing benefit of volunteering for volunteers in England to be approximately £8.257 billion in 2021/22 (see Table 6), total wellbeing benefit and average wellbeing benefit per volunteer). This figure is obtained by multiplying our core estimate of the average impact of volunteering incidence on life satisfaction (0.033) by the total number of volunteers in England in 2021/22 (12.3 million) and the 2021 WELLBY value, adjusted to a 1-to-7-point scale (£20,634).
We also estimated the average wellbeing benefit per volunteer by multiplying the average impact of volunteering on life satisfaction with the 2021 WELLBY value, adjusted to a 1-to-7-point scale. This amounts to £673 per volunteer and represents the average increase in wellbeing from volunteering at least once in the past 12 months relative to not volunteering.
Table 6: Estimates of the inputs for the wellbeing monetisation, total wellbeing benefit and average wellbeing benefit per volunteer
| Average impact of volunteering on life satisfaction (A) | 2021 WELLBY value adjusted to a 1–7-point scale (B) | Number of volunteers in 2021/22 (C) | Total wellbeing benefit (A*B*C) | Average wellbeing benefit per volunteer (A*B) | |
|---|---|---|---|---|---|
| At least once in the past 12 months | 0.033*** | £20,634 | 12.27m | £8.257bn | £673 |
Note: The *-signs indicate the statistical significance of the estimates: *** p-value < 0.01, ** p-value < 0.05, * p-value < 0.1. The 95% confidence interval for the point estimate of the impact of volunteering on life satisfaction (0.033) is [0.012, 0.053]. Total wellbeing benefit may not sum due to rounding.
Source: London Economics’ analysis of Understanding Society, Green Book and Community Life Survey data
8. Effect of volunteering on employment outcomes
Previous literature suggests that volunteering may have various employment benefits. Firstly, volunteering could increase the probability of employment, acting as a pathway into paid work. Paine and others (2013) examined this using Understanding Society and found that volunteering had a small but significant effect on the probability of employment, but the direction of the effect varied across volunteering frequency categories. Volunteers may move into employment due to improvements in human and social capital, as a consequence of activities such as skills training and confidence building. For example, Degli Antoni (2015) found that participation in activities that developed social networks and increased human capital also increased the probability of being employed. Secondly, there is evidence that individuals may acquire a variety of skills (for example, communication and teamwork) through volunteering (Kamerade, 2015), and social capital within firms through employer-supported volunteering (Muthuri and others, 2009).
Alongside the wellbeing benefits to volunteers from volunteering (see Section 7), the skills acquired through volunteering may increase volunteers’ productivity in paid employment. While it is difficult to directly measure productivity improvements through the skills acquired through volunteering, a commonly used approach is to use individual wages as a proxy for productivity.
On the other hand, the relationship between volunteering and employment outcomes could also be negative. Volunteers may decide to work less to have more time for volunteering. This may reduce the hours that volunteers work in paid jobs compared to people who do not volunteer, especially as individuals move towards retirement.
To examine these effects, following our econometric strategy from Section 5, we estimated the impact of volunteering on three employment outcomes:
-
The likelihood of employment
-
Hourly wages
-
Hours worked per week
While not included here, we also present results for the impact of volunteering on monthly wages in Annex A1.9.3.
In our main specification, we consider the impact of volunteering at time t-1 and the outcomes at time t. We also conducted subgroup analyses of each outcome to examine how the effects vary by age group and considered the impact of volunteering on employment outcomes over a longer time period (two or three years after volunteering).
8.1 Assumptions and limitations
Our estimates may not fully capture the employment benefits of volunteering, as there are several methodological challenges. Firstly, data limitations mean that it is not possible to directly measure the impact of volunteering on building skills or productivity improvements. As a result, we use proxies for this, such as hourly pay and employment probability. For example, volunteering may increase productivity in employment through improved teamwork or work ethic which may not translate into higher wages. Secondly, the impact of volunteering on employment outcomes may not be immediate. Skills built through volunteering may take several years to lead to improved employment outcomes. The time periods available in Understanding Society mean that it is not possible to examine the effect of volunteering over a longer time period. Finally, employment decisions may be linked to volunteering decisions. For example, an individual may choose to volunteer because they plan to reduce their hours worked in paid employment. While we used fixed effects estimation and lagged volunteering variables to address this, there may still be some bias in our estimates as a result of it.
Moreover, we decided to not monetise the results of our estimation because they generally provide inconclusive evidence about the presence and size of employment benefits. Unlike the estimate of the impact of volunteering on wellbeing, our estimates of the employment benefits are not as consistently robust. We provide reasoning for not monetising each impact in the sections below. In Annex A1.2, we outline a method that we would have used to monetise the estimates if they had been robust.
8.2 Econometric results
Impact on the probability of paid employment
To understand whether volunteering builds skills that help individuals find employment, we estimated the impact of volunteering on the probability of being in paid employment for volunteers. To look at this, we used a dummy variable, which indicates whether or not an individual is in paid employment. Table 7 shows the estimates by volunteering incidence, frequency and age group.
Table 7 reports partial elasticities, which represent a percentage change in the probability of employment, relative to the baseline employment rate of non-volunteers. For example, a partial elasticity of 0.1 with a 50% baseline employment rate of non-volunteers implies that volunteering increases the probability of employment by 5 percentage points, from 50% to 55%. Note that the baseline employment rate changes across specifications, so the partial elasticities are not comparable across specifications. However, within each specification, the partial elasticities are comparable across frequency categories, as they share the same baseline. Some partial elasticities may appear large, but they may be relative to a low baseline.[footnote 38] Therefore, when comparing across specifications, more attention should be paid to the signs of the partial elasticities (positive or negative) than to their magnitude.
We estimated that volunteering at least once in the past 12 months at time t-1 increases the probability of paid employment at time t by 0.9%. However, this result is not statistically significant and hence does not provide sufficient evidence of a positive impact of volunteering in the past 12 months on employment. This positive result was driven by less frequent volunteers (those volunteering less than once a week), with those volunteering at least once a week experiencing a decrease in their probability of paid employment. Again, the results by frequency were not statistically significant.
Considering the results by age, for those aged 16 to 25, volunteering once in the past 12 months increases the probability of paid employment by 9.1% and is statistically significant. This result is mainly driven by those who volunteer more frequently. For the same age group, volunteering at least once a week increases the likelihood of employment by 17.1%.
We find the opposite effect for volunteers aged 46 to 65, with a decrease in the likelihood of employment by 2.6% for those volunteering at least once in the past year. However, this result is not statistically significant. The effect is stronger for more frequent volunteers, with those aged 46 to 65 volunteering at least once a week experiencing a statistically significant decrease in the probability of paid employment of 7.8%. The positive effect on employment for younger people and negative effect for older people may explain why there is no significant effect in the average effect across all ages.
These results provide weak evidence that volunteering may be a substitute for paid work for older people, but could act as a pathway to work for younger people. Due to the lack of statistical significance, we did not monetise these results.
Table 7: Partial elasticities for the impact of volunteering on the likelihood of employment
| All ages | Aged 16–25 | Aged 26–45 | Aged 46–65 | |
|---|---|---|---|---|
| Volunteering incidence | ||||
| At least once in the past 12 months | 0.009 | 0.091** | 0.020 | -0.026 |
| Observations | 31,824 | 6,235 | 7,909 | 14,129 |
| Volunteering frequency | ||||
| Less than once a month | 0.022 | 0.013 | 0.026 | 0.031 |
| At least once a month but less than once a week | 0.031 | 0.120 | 0.025 | -0.014 |
| At least once a week | -0.011 | 0.171*** | 0.014 | -0.078** |
| Observations | 31,806 | 6,228 | 7,907 | 14,121 |
Note: The figures shown are partial elasticities, based on a fixed effects logistic model, for individuals aged 16 to 65, estimating the impact of volunteering at time t-1 on employment at time t. The results are based on two regressions: one for volunteering incidence (a binary variable based on whether an individual volunteers or not) and one for volunteering frequency. A partial elasticity of 0.009 suggests that, on average, volunteering in the past 12 months is associated with a 0.9% increase in the probability of being employed in the following year, relative to the baseline employment rate for non-volunteers. The *-signs indicate the statistical significance of the estimates: *** p-value < 0.01, ** p-value < 0.05, * p-value < 0.1. Values in bold indicate statistical significance at the 10% level or higher.
Source: London Economics’ analysis of Understanding Society
However, one year may be insufficient for employment benefits to be realised, so we also estimated the impact of volunteering at time t-2 and t-3 on employment at time t (see Table 8). We found that the impact of volunteering was stronger over a two- and three-year time period than after one year, with a 6.2% increase in the probability of employment after two years, and 3.4% after three years. These estimates are both statistically significant at the 5% level. The results also hold across all volunteering frequency categories after two years, with the results becoming stronger as individuals volunteer more. After three years, the partial elasticates are broadly similar across all volunteering frequency categories, but are not statistically significant for those volunteering at least once a month but less than once a week. The results hold across all age groups after two years, but there was only a positive and significant effect for those aged 46 to 65 after three years (see Table 31 in Annex A1.9.3). These results provide some evidence that volunteering could act as a pathway into paid work, as the employment benefits of volunteering may be realised only after a few years of volunteering. However, through our analysis, we cannot identify the specific factors that would cause this employment effect.
Table 8: Partial elasticities for the impact of volunteering at time t-2 and t-3 on the likelihood of employment at time t
| Second lag (t-2) | Third lag (t-3) | |
|---|---|---|
| Volunteering incidence | ||
| At least once in the past 12 months | 0.062** | 0.034** |
| Observations | 28,034 | 24,367 |
| Volunteering frequency | ||
| Less than once a month | 0.039** | 0.036* |
| At least once a month but less than once a week | 0.060** | 0.029 |
| At least once a week | 0.080*** | 0.034* |
| Observations | 28,015 | 24,355 |
Note: The figures shown are partial elasticities, based on a fixed effects logistic model, for individuals aged 16 to 65, estimating the impact of volunteering at time t-2 or t-3 on employment at time t. The results are based on two regressions: one for volunteering incidence (a binary variable based on whether an individual volunteers or not) and one for volunteering frequency. A partial elasticity of 0.062 suggests that, on average, volunteering in the past 12 months is associated with a 6.2% increase in the probability of being employed in two years’ time (for the second lag), relative to the baseline employment rate for non-volunteers. The *-signs indicate the statistical significance of the estimates: *** p-value < 0.01, ** p-value < 0.05, * p-value < 0.1. Values in bold indicate statistical significance at the 10% level or higher.
Source: London Economics’ analysis of Understanding Society
Impact on hourly pay
To examine how volunteering impacts the productivity of volunteers, we used hourly pay as a proxy for the productivity of volunteers in paid work. Table 9 shows the estimates by volunteering incidence, frequency and age group.
We estimate that volunteering at least once in the last 12 months has a negative and significant effect on hourly pay, and is associated with 1.2% lower hourly pay compared to non-volunteers in the following year. This result is primarily driven by the most frequent volunteers, as those who volunteered at least once a week experience 2.8% lower hourly pay than those who do not volunteer, which is again statistically significant. While this negative effect holds across all age groups, it was only statistically significant for those aged 26 to 45.
Our estimates by age group suggest that the impact of volunteering on hourly pay varies substantially by age. Among the youngest group (aged 16 to 25), volunteering in the past 12 months was associated with 5.1% lower hourly pay, with the negative effect persisting across all frequency categories, but becoming weaker for more frequent volunteers. For those aged 26 to 45, there is a small but not statistically significant effect of 0.5% higher hourly pay. However, within this age group, those volunteering less than once a week experienced 1.9% higher hourly pay than those who did not volunteer. Those volunteering at least once a week experienced 2.1% lower hourly pay than those who did not volunteer. For the oldest group (aged 46 to 65), volunteering at least once in the last 12 months was associated with a small but not statistically significant lower hourly pay (0.9%), which was driven by the most frequent and least frequent volunteers.
Table 9: Regression coefficients for the impact of volunteering on hourly pay
| All ages | Aged 16–25 | Aged 26–45 | Aged 46–65 | |
|---|---|---|---|---|
| Volunteering incidence | ||||
| At least once in the past 12 months | -0.012** | -0.051*** | 0.005 | -0.009 |
| Observations | 77,265 | 8,617 | 35,245 | 33,403 |
| Volunteering frequency | ||||
| Less than once a month | -0.005 | -0.069*** | 0.019* | -0.009 |
| At least once a month but less than once a week | 0.000 | -0.050 | 0.019 | 0.002 |
| At least once a week | -0.028*** | -0.028 | -0.021** | -0.018 |
| Observations | 77,241 | 8,612 | 35,238 | 33,391 |
Note: Based on a fixed effects model estimating the impact of volunteering at time t-1 on hourly pay at time t, for individuals aged 16 to 65. Each column is based on two regressions: one for volunteering incidence (a binary variable based on whether an individual volunteers or not) and one for volunteering frequency. A coefficient of -0.012 suggests that, on average, volunteering in the past 12 months is associated with a 1.2% lower hourly pay in the following year, relative to non-volunteers. The *-signs indicate the statistical significance of the estimates: *** p-value < 0.01, ** p-value < 0.05, * p-value < 0.1. Values in bold indicate statistical significance at the 10% level or higher.
Source: London Economics’ analysis of Understanding Society
Looking at the effect over a longer time period, the effect remained negative, but was smaller and not statistically significant after two and three years, at -0.7% and -0.9% respectively (see Table 10). However, for those volunteering at least once a week, a negative and statistically significant effect on hourly pay persists after two and three years, at -2.1% and -2.6% respectively.
The results in this section should be interpreted with caution, as they may capture the impact of external factors, rather than the causal effect of volunteering on hourly pay. For example, it could be the case that individuals volunteer for the same reasons that they have a lower-paid job (for instance as a result of a partner’s higher or increasing earnings). Given that we cannot be sure about how those external factors may influence our estimates, we decided not to monetise the results in this section.
Table 10: Regression coefficients for the impact of volunteering at time t-2 and t-3 on hourly pay at time t
| Second lag (t-2) | Third lag (t-3) | |
|---|---|---|
| Volunteering incidence | ||
| At least once in the past 12 months | -0.007 | -0.009 |
| Observations | 69,131 | 62,623 |
| Volunteering frequency | ||
| Less than once a month | -0.004 | 0.003 |
| At least once a month but less than once a week | 0.010 | -0.007 |
| At least once a week | -0.021*** | -0.026*** |
| Observations | 69,110 | 62,607 |
Note: Based on a fixed effects model estimating the impact of volunteering at time t-2 and t-3 on hourly pay at time t, for individuals aged 16 to 65. Each column is based on two regressions: one for volunteering incidence (a binary variable based on whether an individual volunteers or not) and one for volunteering frequency. A coefficient of -0.007 suggests that, on average, volunteering in the past 12 months is associated with a 0.7% lower hourly pay in two years’ time (for the second lag), relative to non-volunteers. The *-signs indicate the statistical significance of the estimates: *** p-value < 0.01, ** p-value < 0.05, * p-value < 0.1. Values in bold indicate statistical significance at the 10% level or higher.
Source: London Economics’ analysis of Understanding Society
Impact on hours worked
Table 11 presents estimates of the effect of volunteering on weekly hours worked in paid employment for volunteers. We estimate that those who volunteer at least once in the past 12 months and are in paid employment work 0.13 fewer hours (equivalent to around 8 fewer minutes) per week, compared to individuals in paid employment who do not volunteer. This result would suggest that volunteers sometimes substitute paid work for volunteering, but that the extent of substitution is relatively limited, given the small size of the effect and the limited statistical significance of the result (at the 10% level).
The results vary substantially by age. Volunteering at least once in the past 12 months has a positive effect (an increase in the number of hours worked) for those aged 16 to 25, who work an average of 0.595 hours more per week in the following year, compared to individuals who do not volunteer. However, it has a negative effect (a decrease in the number of hours worked) for those in other age categories, with 0.123 fewer hours worked per week for those aged 26 to 45 and 0.150 fewer hours worked per week for those aged 46 to 65. For those aged 16 to 25, the positive effect on hours worked is strongest for more frequent volunteers, while for those aged 46 to 65, the negative effect is strongest for more frequent volunteers. Therefore, these results provide some evidence that volunteering is complementary to work for younger volunteers, and is a substitute for work for older volunteers. However, the estimates presented in Table 11 have limited statistical significance and therefore only provide limited evidence on the effect of volunteering on hours worked, meaning that some caution should be exercised when interpreting the results.
Table 11: Regression coefficients for the impact of volunteering on hours worked
| All ages | Aged 16-25 | Aged 26-45 | Aged 46-65 | |
|---|---|---|---|---|
| Volunteering incidence | ||||
| At least once in the past 12 months | -0.130* | 0.595* | -0.123 | -0.150 |
| Observations | 77,265 | 8,617 | 35,245 | 33,403 |
| Volunteering frequency | ||||
| Less than once a month | -0.091 | 0.170 | -0.199 | -0.001 |
| At least once a month but less than once a week | -0.168 | 1.144 | 0.084 | -0.331* |
| At least once a week | -0.139 | 0.936* | -0.116 | -0.226 |
| Observations | 77,241 | 8,612 | 35,238 | 33,391 |
Note: Based on fixed effects model estimating the impact of volunteering at time t-1 on weekly hours worked at time t, for individuals aged 16 to 65. The results are based on two regressions: one for volunteering incidence (a binary variable based on whether an individual volunteers or not) and one for volunteering frequency. A coefficient of -0.130 suggests that, on average, volunteering in the past 12 months is associated with a 0.130-hour reduction in weekly hours worked in the following year. The *-signs indicate the statistical significance of the estimates: *** p-value < 0.01, ** p-value < 0.05, * p-value < 0.1. Values in bold indicate statistical significance at the 10% level or higher.
Source: London Economics’ analysis of Understanding Society
Estimates of the impact of volunteering on hours worked over a two and three year period are presented in Table 33 in Annex A1.9.3. These coefficients are not statistically significant and show a smaller negative effect of volunteering on hours worked.
Due to the limited statistical significance of these results, we did not monetise the effect of volunteering on hours worked.
8.3 Summary of the employment impacts
Overall, our results present relatively weak evidence on the impact of volunteering on employment outcomes, as the effects identified are relatively small and often not statistically significant. There is some evidence that volunteering may increase the probability of being in paid employment, particularly over a longer time period (two or three years after volunteering). When examining the effects one year after volunteering, the impact appears to be positive for younger people (aged 16 to 25) but negative for older people (aged 46 to 65), suggesting that volunteering may complement employment for younger people while potentially substituting for work for older people.
The results for the effect of volunteering on hours worked in paid employment show similar results. They show weak evidence of an overall decrease in hours worked, with increases in hours worked for younger people and decreases for those aged 26 and over. The results also suggest that volunteering is associated with lower hourly pay for volunteers, particularly for those who volunteer at least once a week. However, this finding may be linked to the decision to volunteer, rather than volunteering having a direct negative effect on skills or productivity.
9. Effect of volunteering on healthcare costs
Alongside the positive effect of volunteering on subjective wellbeing (see Section 7), previous research has found that volunteers often report better physical health compared to non-volunteers (Binder, 2015; NCVO, 2019). As a result, volunteers may require fewer healthcare appointments, leading to potential cost savings for the NHS, and therefore, the government.[footnote 39] As mentioned in Section 5, healthier individuals may self-select into volunteering, meaning that improved health may increase the probability of volunteering. We account for this selection bias in the econometric strategy (for example, through fixed effects estimation) to isolate the effect of volunteering on healthcare appointments. Following the econometric strategy outlined in Section 5, we estimate the impact of volunteering at time t-1 on the number of healthcare appointments at time t.
Based on the data available in Understanding Society, we estimated the impact of volunteering on three outcomes:
-
Number of GP visits per year
-
Number of outpatient visits per year
-
Number of days spent in hospital as an inpatient per year
In Understanding Society, the GP and outpatient variables are coded differently from inpatient variables. As a result, in this section, we present results for GP and outpatient visits in bands,[footnote 40] as provided in Understanding Society, while inpatient days are presented as a continuous variable. As a result, our econometric approach differs across these outcome variables.[footnote 41]
9.1 Econometric results
Impact on GP visits
Considering the effect of volunteering on GP visits, we found no significant effect of volunteering in the past 12 months on the number of GP visits a volunteer makes in the following year (see Table 12). The regression results suggest that the relationship is negative and small, such that volunteering decreases the number of GP visits per year, but this result was not statistically significant. Considering the results by frequency, the effect is strongest and statistically significant at the 10% level for those who volunteer at least once a month but less than once a week. Those who volunteer at least once a month but less than once a week are 1.8 percentage points more likely to have zero GP appointments per year relative to non-volunteers. For other frequency groups, volunteering decreases the number of GP appointments, but the effect is smaller and not statistically significant.
Table 12: Regression coefficients for the impact of volunteering on the number of GP visits of volunteers per year, by volunteering frequency
| Number of GP visits per year | Volunteered at least once in the past 12 months | Volunteered less than once a month | Volunteered at least once a month but less than once a week | Volunteered at least once a week |
|---|---|---|---|---|
| None | 0.007 | 0.005 | 0.018* | 0.003 |
| One to two | 0.003 | 0.002 | 0.007* | 0.001 |
| Three to five | -0.004 | -0.003 | -0.011* | -0.002 |
| Six to ten | -0.003 | -0.003 | -0.008* | -0.001 |
| More than ten | -0.002 | -0.002 | -0.006* | -0.001 |
| Observations | 55,190 | 55,138 | 55,138 | 55,138 |
Note: Based on a fixed effects ordered logistic model. The table is based on two regressions: one for volunteering incidence (a binary variable based on whether an individual volunteers or not) and one for volunteering frequency. A coefficient of 0.007 suggests that being a volunteer increases the likelihood of being in a category by 0.7 percentage points. The number of observations for volunteering frequency is based on the total number of observations used in that regression across all volunteering frequencies. The *-signs indicate the statistical significance of the estimates: *** p-value < 0.01, ** p-value < 0.05, * p-value < 0.1. Values in bold indicate statistical significance at the 10% level or higher.
Source: London Economics’ analysis of Understanding Society
Impact on outpatient visits
Considering the effect of volunteering on outpatient visits, as with GP visits, we found no significant effect of volunteering in the past 12 months on the number of outpatient visits a volunteer makes in the following year (see Table 13). The regression results suggest close to a zero effect overall. Considering the results by frequency, volunteering less than once a month appears to slightly decrease the likelihood of having no outpatient visits per year, and volunteering either at least once a month but less than once a week, or volunteering at least once a week slightly increases the likelihood of having no outpatient visits. Again, these results are not statistically significant, so they should be interpreted with caution.
Table 13: Regression coefficients for the impact of volunteering on the number of outpatient visits of volunteers per year, by volunteering frequency
| Number of outpatient visits per year | Volunteered at least once in the past 12 months | Volunteered less than once a month | Volunteered at least once a month but less than once a week | Volunteered at least once a week |
|---|---|---|---|---|
| None | 0.001 | -0.019 | 0.021 | 0.008 |
| One to two | -0.000 | 0.003 | -0.004 | -0.001 |
| Three to five | -0.000 | 0.008 | -0.008 | -0.003 |
| Six to ten | -0.000 | 0.004 | -0.005 | -0.002 |
| More than ten | -0.000 | 0.003 | -0.004 | -0.001 |
| Observations | 48,350 | 48,317 | 48,317 | 48,317 |
Note: Based on a fixed effects ordered logistic model. The table is based on two regressions: one for volunteering incidence (a binary variable based on whether an individual volunteers or not) and one for volunteering frequency. A coefficient of 0.001 suggests that being a volunteer increases the likelihood of being in a category by 0.1 percentage points. The number of observations for volunteering frequency is based on the total number of observations used in that regression across all volunteering frequencies. The *-signs indicate the statistical significance of the estimates: *** p-value < 0.01, ** p-value < 0.05, * p-value < 0.1. Values in bold indicate statistical significance at the 10% level or higher.
Source: London Economics’ analysis of Understanding Society
Impact on inpatient days
Considering the effect of volunteering on inpatient days, we found that volunteering slightly decreases the number of days spent as an inpatient in the following year, by around 0.127 days on average (see Table 14). This result was statistically significant at the 10% level. The effect was strongest (and significant at the 10% level) for those volunteering at least once a week (0.170 fewer days spent as an inpatient). The overall negative effect held across all age bands for those volunteering at least once in the past 12 months, and was largest for the youngest (16 to 25) and oldest (over 65) age groups, but ultimately was not statistically significant for any age group.
Table 14: Regression coefficients for the impact of volunteering on the number of inpatient days of volunteers per year
| All ages | Aged 16-25 | Aged 26-45 | Aged 46-65 | Aged over 65 | |
|---|---|---|---|---|---|
| Volunteering incidence | |||||
| At least once in the past 12 months | -0.127* | -0.329 | -0.039 | -0.018 | -0.163 |
| Observations | 87,273 | 9,181 | 24,587 | 32,068 | 21,437 |
| Volunteering frequency | |||||
| Less than once a month | -0.092 | -0.046 | -0.077 | -0.023 | -0.053 |
| At least once a month but less than once a week | -0.119 | -0.355 | 0.139 | -0.100 | -0.332 |
| At least once a week | -0.170* | -0.659 | -0.090 | 0.042 | -0.171 |
| Observations | 87,214 | 9,170 | 24,577 | 32,047 | 21,420 |
Note: Based on a fixed effects model for the impact of volunteering at time t-1 on inpatient days at time t. Each column is based on two regressions: one for volunteering incidence (a binary variable based on whether an individual volunteers or not) and one for volunteering frequency. A coefficient of -0.127 suggests that, on average, volunteering in one year leads to 0.127 fewer days spent as an inpatient in the following year. The *-signs indicate the statistical significance of the estimates: *** p-value < 0.01, ** p-value < 0.05, * p-value < 0.1. Values in bold indicate statistical significance at the 10% level or higher.
Source: London Economics’ analysis of Understanding Society
9.2 Summary of the healthcare impacts
Considering the results across all types of healthcare appointments, while the results generally indicated that volunteering decreases the number of healthcare appointments of volunteers, the results were generally not statistically significant or robust (see Annex A1.9.4 for robustness checks, including the impact on composite healthcare costs). Therefore, as we were unable to find sufficient evidence to suggest that volunteering decreases the number of healthcare appointments of volunteers, we have not monetised the results of this strand.
The lack of robust results may be driven to some extent by a limited sample size, as we were only able to use three waves of Understanding Society due to the availability of the healthcare and volunteering variables. In addition, the effect of volunteering on healthcare appointments, particularly over a short time horizon, would be expected to be relatively small.[footnote 42] Therefore, while there might be an effect of volunteering on healthcare appointments, it might not be possible to detect it.
10. 8 Effect of volunteering on social outcomes
Previous research suggests that volunteering has a wide range of social benefits to the volunteer and wider society (Abrams and others, 2023). These benefits are related to social and community cohesion (for example, feeling connected to the neighbourhood, and increased civic trust), social capital (for example, stronger social relationships), and soft skills (for example, improved communication skills). The effect of volunteering on soft and social skills was also found to be strong among young people (13 to 14-year-olds) (See and others, 2017). Some of the mechanisms driving these benefits are increased social interactions, trust, pro-social behaviour, and the feeling of making a social impact while volunteering (Abrams and others, 2023).
Understanding Society includes the following variables that can be used as proxies for social benefits:
-
Social isolation
-
Lack of companionship
-
Feeling left out
-
Feeling lonely
-
Feeling of belonging to the neighbourhood
-
Willingness to improve the neighbourhood
However, it is difficult to monetise the effect of volunteering on these variables because a monetary social capital value (like for wellbeing) does not exist. Moreover, there is also the risk of double-counting as some of the social benefits may themselves be mechanisms that drive the impact of volunteering on wellbeing.
The variables used as proxies for social benefits are only available in limited waves of Understanding Society, meaning the impact of volunteering on social benefits can only be estimated in one time period. Hence, we cannot use a fixed effects model to account for the fact that individuals’ social outcomes could influence their likelihood to volunteer (thereby introducing selection bias to our estimates). For example, an individual could choose to volunteer because they feel lonely, rather than volunteering causing loneliness.
Nevertheless, we estimated the social benefits of volunteering using data from Understanding Society without monetising the results, applying the estimation strategy from Section 5. Due to the potential selection bias, our estimates do not represent causal effects, but associations between volunteering and social outcomes.
10.1 Econometric results
In Table 15 and Table 16, we report the regression coefficients estimating the impact of volunteering on the feeling of belonging to and willingness to improve the neighbourhood, respectively. We consider the impact of volunteering on social outcomes within the same time period, as we expect the benefits to be immediate.
Considering the effect of volunteering on the feeling of belonging to the neighbourhood (see Table 15), we found that people who volunteered at least once in the past 12 months are 2.4 percentage points more likely to agree and 0.8 percentage points less likely to disagree with the statement that they belong to their neighbourhood. These results are statistically significant at the 1% level. The results are similar by frequency of volunteering activity, and are largest for the weekly volunteers, who are 3.0 percentage points more likely to agree with the statement than non-volunteers.
Table 15: Regression coefficients for the impact of volunteering on the feeling of belonging to the neighbourhood, by volunteering frequency
| Volunteered at least once in the past 12 months | Volunteered less than once a month | Volunteered at least once a month but less than once a week | Volunteered at least once a week | |
|---|---|---|---|---|
| Disagree | -0.008*** | -0.007*** | -0.004 | -0.009*** |
| Neither agree nor disagree | -0.017*** | -0.015** | -0.009 | -0.021*** |
| Agree | 0.024*** | 0.023*** | 0.014 | 0.030*** |
| Observations | 35,338 | 35,317 | 35,317 | 35,317 |
Note: Based on an ordered logistic model. The coefficient of 0.024 suggests that volunteering is associated with a 2.4 percentage point increase in the likelihood of agreeing with the statement that one feels a sense of belonging to their neighbourhood. The table is based on two regressions: one for volunteering incidence (a binary variable based on whether an individual volunteers or not) and one for volunteering frequency. The number of observations for volunteering frequency is based on the total number of observations used in that regression across all volunteering frequencies. Based on the following statement: ‘I feel like I belong to this neighbourhood’. The *-signs indicate the statistical significance of the estimates: *** p-value < 0.01, ** p-value < 0.05, * p-value < 0.1. Values in bold indicate statistical significance at the 10% level or higher.
Source: London Economics’ analysis of Understanding Society
Our estimates indicate a positive impact of volunteering on the willingness to improve the neighbourhood, with a larger effect than on the sense of belonging. Specifically, volunteering at least once in the past 12 months is associated with a 10.4 percentage point increase in the probability of agreeing with the statement that they are willing to improve their neighbourhood (see Table 16). This effect size is consistent across frequency categories, with the largest effect for those volunteering at least once a month but less than once a week (an 11.1 percentage point increase in the probability of agreeing with the statement).
Table 16: Regression coefficients for the impact of volunteering on the willingness to improve the neighbourhood, by volunteering frequency
| Volunteered at least once in the past 12 months | Volunteered less than once a month | Volunteered at least once a month but less than once a week | Volunteered at least once a week | |
|---|---|---|---|---|
| Disagree | -0.037*** | -0.029*** | -0.036*** | -0.033*** |
| Neither agree nor disagree | -0.067*** | -0.058*** | -0.075*** | -0.068*** |
| Agree | 0.104*** | 0.087*** | 0.111*** | 0.101*** |
| Observations | 35,316 | 35,295 | 35,295 | 35,295 |
Note: Based on an ordered logistic model. The coefficient of 0.104 suggests that volunteering is associated with a 10.4 percentage point increase in the likelihood of agreeing with the statement that one is willing to improve their neighbourhood. The table is based on two regressions: one for volunteering incidence (a binary variable based on whether an individual volunteers or not) and one for volunteering frequency. The number of observations for volunteering frequency is based on the total number of observations used in that regression across all volunteering frequencies. Based on the following statement: ‘I would be willing to work together with others on something to improve my neighbourhood’. The *-signs indicate the statistical significance of the estimates: *** p-value < 0.01, ** p-value < 0.05, * p-value < 0.1. Values in bold indicate statistical significance at the 10% level or higher.
Source: London Economics’ analysis of Understanding Society
The results above suggest that there is strong evidence of a positive association between volunteering and the feeling of belonging and willingness to improve one’s neighbourhood. However, while most of these results are statistically significant at the 1% level, we cannot conclude that volunteering has a causal effect on these outcomes. For example, it could be the case that individuals choose to volunteer because they already have a stronger feeling of belonging to, and willingness to improve, their neighbourhood. Further research would be necessary to identify the causal effects of volunteering on social outcomes and the mechanisms driving volunteering, which may be possible as further waves of Understanding Society are released.
We also produced estimates for other social outcomes, such as social isolation, which are included in Annex A1.9.5. Though they are typically not statistically significant at the 10% level, they do suggest that volunteers are more likely to report feeling isolated, having a lack of companionship, feeling left out, or feeling lonely. However, this evidence is relatively weak due to the lack of statistical significance and suggests that these factors could be a motivation for starting to volunteer.
11. Total impact of volunteering
We estimate the total economic impact of formal volunteering in England in 2021/22 to be £24.690 billion (see Table 17), based on the 12.3 million formal volunteers in England in 2021/22. This is the sum of the replacement cost of volunteers (£16.433 billion) and the total monetary value of the wellbeing increases from volunteering at least once in the last 12 months (£8.257 billion).
Table 17: Total economic impact
| Volunteering frequency | Replacement cost | Wellbeing benefit | Total |
|---|---|---|---|
| At least once in the past 12 months | £16.433bn | £8.257bn | £24.690bn |
Source: London Economics’ analysis.
We estimated the average economic impact per volunteer in England in 2021/22 to be £2,012 (see Table 18). This is the sum of the average replacement cost per volunteer (£1,339) and the wellbeing benefit per volunteer (£673).
Table 18: Average economic impact per volunteer
| Volunteering frequency | Replacement cost per volunteer | Wellbeing benefit per volunteer | Total |
|---|---|---|---|
| At least once in the past 12 months | £1,339 | £673 | £2,012 |
Note: Figures rounded to the nearest pound.
Source: London Economics’ analysis.
We have excluded the employment benefits, healthcare costs saved and social outcomes from the monetisation for reasons discussed in Sections 8, 9 and 10. Moreover, we excluded several other potential benefits from volunteering that we presented in our conceptual framework (see Annex A1.1.3) due to reasons discussed in Annex A1.3 and A1.5. This does not mean that these benefits are less relevant, but that methodological, conceptual and logistical challenges prevented us from providing a monetary figure.
12. Annex
12.1 Annex 1: Technical annex
12.2 A1.1 Background and scope of the research project
In late 2023, DCMS commissioned London Economics, working with Basis Social and NPC, to develop a methodology to assess the economic and social value of volunteering in England. That phase of the project (referred to as ‘part A’) informed the methodology used in this report (referred to as ‘part B’). DCMS’s objective in commissioning this report was to articulate the value generated by volunteers in monetary terms across a wide range of dimensions, including wellbeing, following HM Treasury’s 2021 Green Book update on guidance for wellbeing appraisal (HM Treasury, 2022). There was also a desire to monetise the value of volunteering expressed during a number of stakeholder consultations with members of VCSE organisations (undertaken by NPC and Basis Social in early 2023). The work is intended to make the case for investment in volunteering that is linked to other policy objectives, and in a way that achieves the needs of local communities.
In part A, we undertook desk research to review the literature about the economic and social value of volunteering and the data sources to estimate and monetise the value of volunteering. The desk research considered a wide range of UK and international sources, which empirically estimate different aspects of the value of volunteering.
London Economics also undertook stakeholder engagement with an expert advisory group and a practitioners’ group. In total, we held four stakeholder workshops, alongside a small number of follow-up interviews.[footnote 43] Three workshops were held with a small expert advisory group of individuals selected due to their significant experience with voluntary sector data and their understanding of the methodological challenges associated with estimating the value of volunteering. The advisory group made substantial contributions to refine the proposed methodology. One workshop was held with a separate practitioner group of local government officials, funders, and VCSE organisations. This stakeholder engagement was essential in helping to capture the full range of value created by volunteers, as well as understanding the key requirements for volunteer-involving organisations to capture the value of volunteering.
We combined the insights from the desk research and stakeholder engagement to develop a conceptual framework and methodology to estimate and monetise the economic and social value of volunteering.
As the nature of volunteering varies widely, the methodology and conceptual framework necessarily lack the specific features of different types of volunteering.[footnote 44] However, it was designed to allow DCMS to understand the value of volunteering across the country based on a wide range of concepts of value, which could aid the volunteering sector in supporting arguments to fund volunteering. This conceptual framework could be applied to specific sectors or types of volunteering in the future, which would allow for a consistent method to measure the value of volunteering in different settings.
In part B, we have applied the methodology that we proposed in part A to the greatest extent possible and monetised several volunteering outcomes identified in the conceptual framework. We decided to exclude certain outcomes from the monetisation because of the lack of data and conceptual difficulties in measuring certain outcomes. We discuss these difficulties in more detail in Annex A1.3 and A1.5.
The next sections provide a summary of part A of this research project, which includes a presentation of the conceptual framework and the methodologies that we devised to estimate and monetise the benefits and costs that were excluded from the main analysis.
A1.1.1 Developing the conceptual framework
The conceptual framework shows the socioeconomic outcomes of volunteering, and the costs and benefits for those involved. It follows the logic of a theory of change. This means that it outlines which inputs and costs are needed for specific volunteering outputs, and how these outputs lead to outcomes and impacts (benefits) of volunteering. The conceptual framework is split into four strands based on the groups benefiting from volunteering:
-
Participants: The value of volunteering to both volunteers and the beneficiaries of volunteering activity. ‘Beneficiaries’ may be service users, but there may be wider individual beneficiaries that are not considered service users, depending on the type of volunteering. These groups have been included together as both groups receive many of the same benefits from volunteering.
-
Organisations: The value of volunteering to both organisations that use volunteers (both within and outside the voluntary sector) and those that do not use volunteers. The latter group also captures workplace volunteering and therefore the benefits that organisations receive from their employees volunteering.
-
Government: The value of volunteering to the government, such as the Exchequer benefits from volunteering activity related to higher employment rates and reduced healthcare costs.
-
Society: The wider value of volunteering to communities and wider society, such as positive externalities from volunteering activity.
We devised a conceptual framework for each of the four groups, each of which is structured based on the following factors:
-
Inputs and associated costs: The inputs required for volunteering and the associated costs.
-
Volunteering outputs: The immediate outputs from volunteering activity.
-
Intermediate outcomes: The intermediate outcomes from volunteering activity, which are usually a consequence of the initial volunteering outputs. In many cases, the intermediate outcome can be considered the mechanism for how the final outcome is realised. For example, the social interactions (the volunteering output) that result from a volunteering activity increase the wellbeing of a volunteer (the final outcome) by improving the volunteer’s sense of belonging (the intermediate outcome) (see Figure 1).
-
Final outcomes: The consequence of the intermediate outcomes, which is ultimately what would be measured (if feasible).
We categorised the final outcomes into four types of capital. The categories are:
-
Human capital: Benefits related to hard or soft skills, individual mental and physical wellbeing, or employment and educational outcomes.
-
Social capital: Benefits related to social and community cohesion (for example, social trust, involvement in communities) and social networks (for example, social relationships, social recognition) for individuals, organisations, governments, and wider society.
-
Economic capital: Benefits related to organisations’ financial capital and economic performance.
-
Environmental capital: Benefits related to natural resources and environmental amenities (for example, green spaces).
A1.1.2 Factors influencing the value of volunteering
Alongside the four strands of the conceptual framework, a set of overarching ‘influencing factors’ has been developed. These characterise the volunteer experience and volunteering activities, and in turn, determine the value of volunteering. These 14 influencing factors are listed below and were developed primarily based on the stakeholder consultation. These influencing factors are not necessarily ‘stand-alone’, as there may be some overlap between factors, and some are likely to influence each other. For example, a volunteer’s characteristics are likely to influence their reason for volunteering.
-
The reason for volunteering (for example, building own skills, wellbeing, helping the community, social prescribing)
-
Skills and work experience before volunteering
-
Frequency of volunteering
-
Volunteering mode (whether in person or online)
-
Type of volunteering activity
-
Volunteer characteristics (for example, age, social class, gender, employment status, disability status)
-
Volunteer experience (for example, work experience)
-
Volunteer engagement
-
Organisational reliance on volunteers
-
The level of volunteers’ responsibility within organisations
-
Volunteers’ lived experience
-
State capacity (for example, if volunteering activity needs to replace state-funded provision)
-
External awards (for example, time banks)
-
Volunteering infrastructure
A1.1.3 Conceptual framework by strand

Figure 1: Value of volunteering to participants
Source: London Economics
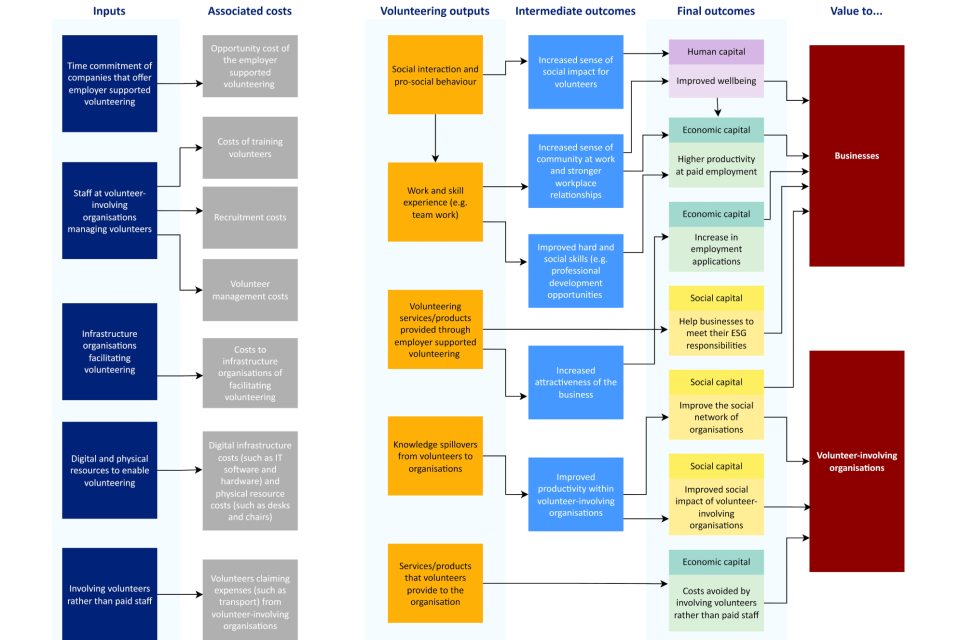
Figure 2: Value of volunteering to organisations
Source: London Economics
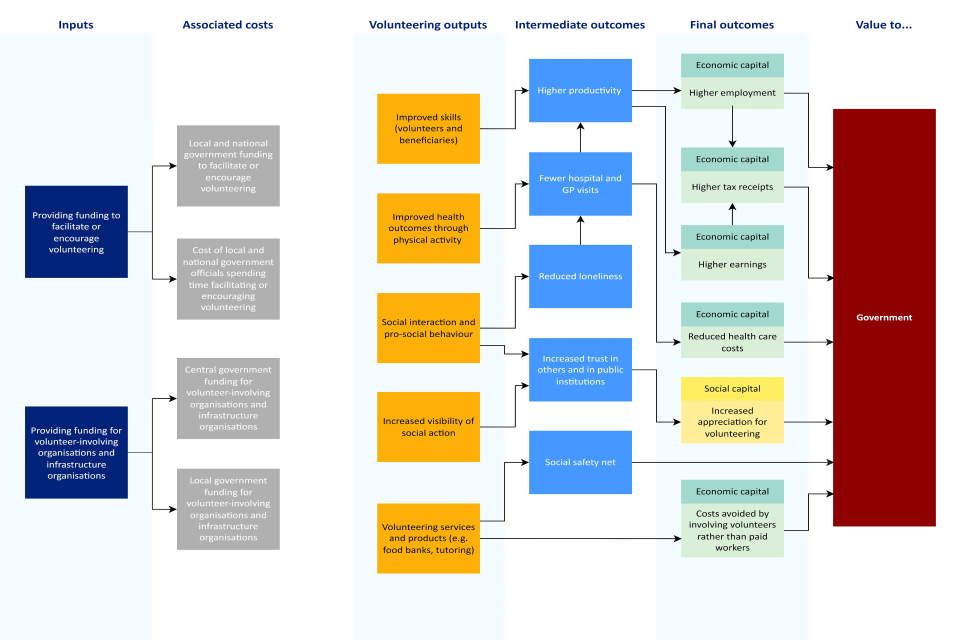
Figure 3: Value of volunteering to government
Source: London Economics
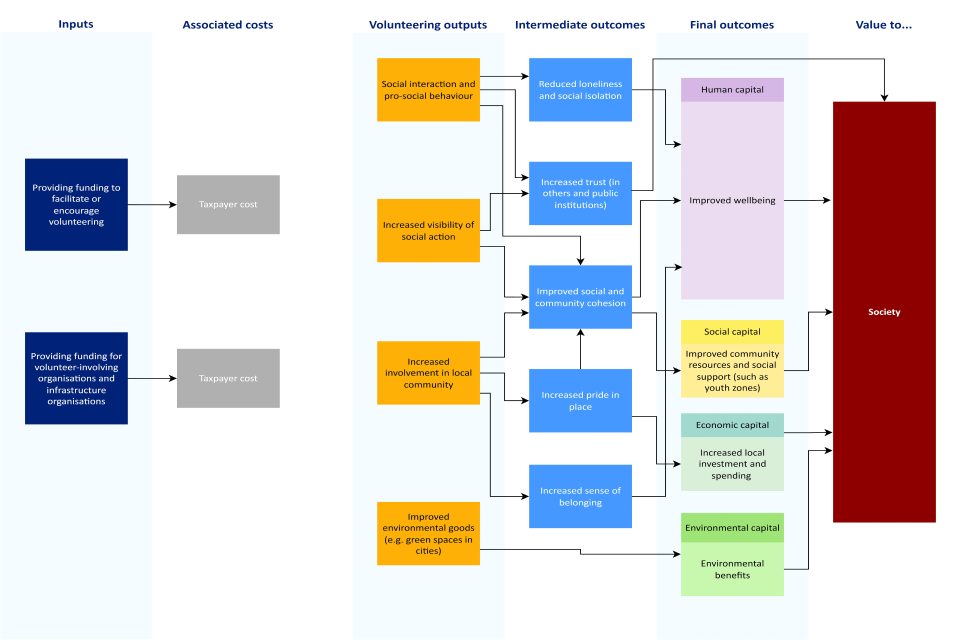
Figure 4: Value of volunteering to society
Source: London Economics
12.3 A1.2 Methods to monetise the employment outcomes and healthcare costs saved
While we were able to monetise the replacement cost of volunteering and the impact of volunteering on wellbeing (as outlined in Section 6) and Section 7), we were not able to monetise the impact of volunteering on employment outcomes or healthcare costs saved (see Section 8 and Section 9. This was because these estimates were not sufficiently robust. However, during part A of this project, we developed methodologies to monetise the impact of those other strands. Despite not using those methods here, we present the method we proposed in part A to monetise the employment outcomes and healthcare costs saved, and the change in tax revenues associated with employment outcomes. This provides a monetisation toolkit for future research which researchers can use if they find more robust estimates of the impact of volunteering on volunteers’ employment outcomes and healthcare costs.
A1.2.1 Wage benefits for volunteers
Table 19 displays the inputs into the wage benefit monetisation.
Table 19: Inputs into wage benefits estimation
| Input | Description | Source |
|---|---|---|
| A | Impact of volunteering on monthly wages (percentage change) | Estimates of the impact of volunteering on wages for individuals aged 16 to 65 who are currently employed using Understanding Society |
| B | Median annual wage in England | Annual Survey of Hours and Earnings |
| C | Number of volunteers aged 16 to 65 in paid employment in England in 2021/22 | Community Life Survey and ONS population estimates |
| A×B×C | Total value of the wage benefits of volunteering in England in 2021/22 | - |
Source: London Economics’ analysis.
We identified the impact of volunteering on both hourly and monthly wages for those aged 16 to 65 in employment through analysis of Understanding Society (as shown in Section 6 and Annex A1.9.3).[footnote 45] To calculate the final monetised benefit, the estimated average change in wages would be multiplied by the median annual wage in England and the number of volunteers aged 16 to 65 in paid employment in England in 2021/22.
The number of volunteers aged 16 to 65 in paid employment in England in 2021/22 can be estimated using Community Life Survey data on whether individuals have volunteered and have been employed in the last 12 months, multiplied by ONS population estimates for England in mid-year 2021 (Office for National Statistics, 2023).
The median annual wage in England in 2021/22 can be estimated using median annual pay in England in 2021 from the Annual Survey of Hours and Earnings (Office for National Statistics, 2021).[footnote 46]
If the dataset used to estimate the impact of volunteering on wages contains information on the volunteering frequency, two sets of estimates can be produced:
-
one estimate for the impact of volunteering incidence (for example, having volunteered at least once in the past 12 months)
-
estimates for the impact of volunteering frequency by frequency category (for example, volunteering at least once a week)
The calculation would yield the net effect of volunteering on wages, accounting for the fact that some volunteers may experience a lower wage due to volunteering, while others might experience a higher wage. Previous studies have indicated that the impact of volunteering on wages is influenced by factors such as occupation and previous work experience. For example, Wilson and others (2020) found a positive effect of volunteering on earnings only for individuals in professional and managerial occupations in the UK (using the BHPS and fixed effects estimation). Qvist and Munk (2018) also used fixed effects estimation (similar to our econometric strategy – see Section 5 to examine volunteers in Denmark and found that positive wage effects from volunteering were only apparent in the early stages of an individual’s career and diminished as work experience increased. Higher employee wellbeing has also been linked to increased labour productivity (Christensen, 2017; DiMaria and others, 2019).
Given the variation in effects across different groups, it may not be appropriate to monetise the results for the entire population. The identified effect also captures two effects: an effect on productivity (through the hourly wage) and an effect on the number of hours worked. To avoid double-counting when monetising, we would advise combining these effects through the monthly wage, rather than monetising hourly wage and hours worked effects separately.
The next step would involve calculating the change in tax revenue for the government resulting from the net effect of volunteering on wages. The change in tax revenue can be calculated by estimating National Insurance contributions (both employer and employee), income tax, and VAT receipts arising from the additional income.[footnote 47] The total value of the estimated wage benefits can then be apportioned to the government and volunteers, which would provide the wage benefits both in terms of increased tax revenue and individual benefits.
A1.2.2 Employment benefits for volunteers
Previous literature suggests that volunteering may also increase the probability of employment, acting as a pathway into paid work. This may be due to improvements in human and social capital, as a consequence of activities such as skills training and confidence building. Degli Antoni (2015) conducted an econometric analysis to investigate the effect of volunteering on employment, finding that participation in activities that developed social networks and increased human capital also increased the probability of being employed.
Table 20 displays the inputs into the employment benefits monetisation.
Table 20: Inputs into employment benefits monetisation
| Input | Description | Source |
|---|---|---|
| A | Impact of volunteering on employment | Estimates of the impact of volunteering on the likelihood of employment using Understanding Society |
| B | Median annual wage of volunteers in England | Annual Survey of Hours and Earnings |
| C | Number of volunteers aged 16 to 65 in England in 2021/22 | Community Life Survey and ONS population estimates |
| A×B×C | Total value of the employment benefits of volunteering in 2021/22 | - |
Source: London Economics’ analysis.
We identified the impact of volunteering on the likelihood of employment for those aged 16 to 65 through analysis of Understanding Society (as outlined in Section 8).[footnote 48] To monetise the impact of volunteering on employment, the estimated average change in employment would be multiplied by the number of volunteers aged 16 to 65 in England in 2021/22 and the median annual wage for the same period.
The number of volunteers aged 16 to 65 in England in 2021/22 can be estimated by using Community Life Survey data on whether individuals have volunteered in the last 12 months, multiplied by ONS population estimates for England in mid-year 2021 (Office for National Statistics, 2023).
The median annual wage of volunteers in employment in 2021/22 can be estimated using median annual pay in England in 2021 from the Annual Survey of Hours and Earnings (Office for National Statistics, 2021).[footnote 49]
The calculation provides the net effect of volunteering on employment, accounting for the possibility that some volunteers may experience a decrease in employment while volunteering. Paine and others (2013) analysed the effect of volunteering on employment using the BHPS and fixed effects estimation and found that the effect varied depending on different factors such as age, the frequency of volunteering, and the reasons for unemployment.
As for the monetisation of the wage benefits, the employment benefits for volunteers can be monetised based on volunteering incidence and frequency.
The change in tax revenue for the government resulting from the net effect of volunteering on employment can be calculated by estimating National Insurance contributions (both employer and employee), income tax, and VAT receipts arising from the additional income of more individuals being in paid work, or the number of hours they work increasing.[footnote 50] The total value can then be apportioned to the government and the volunteers.
A1.2.3 Healthcare costs saved
During our literature review for part A, we found that, besides improved subjective wellbeing, volunteers often report better physical health compared to non-volunteers (Binder, 2015; NCVO, 2019). As a result, volunteers may require fewer healthcare appointments, leading to potential cost savings for the NHS, and therefore, the government.[footnote 51] As mentioned in Section 9, healthier individuals may self-select into volunteering, meaning increased physical health may increase the probability of becoming a volunteer. It is important to account for this selection bias in the econometric strategy (for example, through fixed effects estimation) to isolate the effect of volunteering on healthcare appointments.
Table 21 displays the inputs into the reduced healthcare costs monetisation.
Table 21: Inputs into reduced healthcare costs monetisation
| Input | Description | Source |
|---|---|---|
| A | Impact of volunteering on the frequency of healthcare appointments | Estimates of the impact of volunteering on the frequency of healthcare appointments (GP, outpatient, and inpatient) using Understanding Society |
| B | Average cost to the NHS of healthcare appointments | Derived from NHS England’s National Cost Collection data, NHS England’s Hospital Episodes Statistic data, and Personal Social Services Research Unit (PSSRU)’s Unit Costs of Health and Social Care |
| C | Number of volunteers in England in 2021/22 | Community Life Survey and ONS population estimates |
| A×B×C | Total value of the reduced healthcare costs due to volunteering in 2021/22 | - |
Source: London Economics’ analysis.
We identified the impact of volunteering on the frequency of healthcare appointments through analysis of Understanding Society (as outlined in Section 9.[footnote 52] The monetisation of this impact can be based on the average costs of healthcare appointments or visits. The final monetised benefit can be determined by multiplying the estimated average reduction in the frequency of each healthcare appointment type by the corresponding average cost of the appointment and the number of volunteers in England in 2021/22.
The average costs per healthcare appointment in 2021/22 can be calculated as follows:
-
For GP appointments, the average cost can be based on the typical length of a GP appointment, which was £41 for a 9-minute appointment in 2021/2022. This can be obtained from the PSSRU’s Unit Costs of Health and Social Care (Jones and others, 2023).
-
For outpatient appointments, the cost can be derived from the weighted average of outpatient attendance costs sourced from NHS England’s National Cost Collection data, which was £165 in 2021/22 (NHS England, 2023).[footnote 53]
-
To determine the average cost per day spent as an inpatient, the average cost per inpatient treatment (by type of stay) can be found from both the NHS England’s National Cost Collection data (NHS England, 2023) and the PSSRU’s Unit Costs of Health and Social Care (Jones and others, 2023). These can be combined with NHS data on the number of visits by type of inpatient stay (NHS England, 2023) to determine the average cost per inpatient stay. This figure can then be converted to a per-night figure using Health Foundation data (Health Foundation, 2023) on the average length of stay in hospital in 2022 (8.3 nights). This provides a range of £325 per inpatient night (based on the NHS data) and £377 (based on the PSSRU data), with an average figure of £351.
The number of volunteers in England in 2021/22 can be estimated by using Community Life Survey data on whether individuals have volunteered in the last 12 months, multiplied by ONS population estimates for England in mid-year 2021 (Office for National Statistics, 2023).
The calculation would yield the net effect of volunteering on the frequency of healthcare appointments, accounting for the fact that some volunteers may require more frequent healthcare appointments whilst volunteering. To the best of our knowledge, the cost savings to the government due to volunteering activity reducing the frequency of healthcare appointments has not been previously monetised. However, similar methods have been applied to quantify the average reduction in healthcare appointments from social prescribing.[footnote 54] Polley and others (2019) evaluated a social prescribing service in Shropshire and found that three months after the service, there was an average reduction of 0.76 GP visits per person. Additionally, using different methods, a Sport England report quantified the reduced healthcare costs due to sports and physical activity in England (Sport England, 2024).
Similarly to the monetisation of the wage and employment benefits, the healthcare costs saved through volunteering can be monetised based on volunteering incidence and frequency.
12.4 A1.3 Other volunteering benefits excluded from the monetisation
A1.3.1 Reason for exclusion
Part A of this study aimed to provide a comprehensive monetary figure of the economic and social value of volunteering (net of the associated costs outlined in the conceptual framework). However, certain outcomes are excluded because they are already captured to some extent by the monetised outcomes. In some cases, the monetised outcomes may not fully capture the excluded benefits, but we decided to exclude them entirely to avoid double counting.
In particular, wellbeing improvements for beneficiaries could already be captured to some extent through the costs avoided by VIOs by involving volunteers rather than paid staff. This is because those costs avoided should reflect the marginal product of the services delivered by volunteers (for example, see Martin and Franklin, 2022; Office for National Statistics, 2013). Productivity improvements for businesses are already captured to some extent through improved employment outcomes for volunteers. The monetary benefits of improved skills and training outcomes for volunteers are already captured implicitly for volunteers through improved employment outcomes. Lastly, wellbeing costs for volunteers are captured by measuring the net average effect of volunteering on wellbeing. This analysis accounts for the fact that some volunteers experience wellbeing costs, while others experience wellbeing benefits.
While important outcomes, we did not suggest methodologies to quantify and monetise the following benefits and costs across England:
-
Improved employment outcomes for beneficiaries
-
Increase in job applications and client interest[footnote 55]
-
Helping businesses meet their environmental, social and governance (ESG) responsibilities
-
Increased respect for certain groups undertaking volunteering
-
Environmental benefits of volunteering
-
Increased local investment and spending
Following discussions with stakeholders and DCMS, we decided to exclude the benefit strands discussed above for three main reasons.
Isolating the effect of volunteering
For some outcomes (for example, employment outcomes of beneficiaries, environmental benefits, wider social benefits to society), we could not specifically isolate the effect of volunteering on the outcomes at the England-wide level. It may be possible to identify the impact of specific volunteering-related interventions or certain activities undertaken by the voluntary sector (for example, see State of Life and National Churches Trust, 2021), but we could not identify a methodology to specifically estimate the effect of volunteers. For example, it may be possible to identify the wellbeing improvements for beneficiaries of a specific volunteering programme by surveying beneficiaries before and after the intervention, or through a randomised controlled trial.
Data availability
For some outcomes (for example, the costs of running employer-supported volunteering programmes), there was insufficient data to quantify these outcomes, and the likely magnitude of the associated benefits and costs would be unlikely to justify the volume of primary data collection required.
Intangible benefits
For other outcomes (for example, increased respect for certain groups, or meeting ESG responsibilities), benefits could not be monetised because they were intangible, and we could not identify any commonly accepted method to monetise them. As mentioned above, it would also be difficult to isolate the causal effect of volunteering on these types of outcomes.
A1.3.2 Social benefits
We were not able to develop a method to monetise the social benefits in our conceptual framework, which are the following:
-
Increased trust in society/civic power
-
Help businesses to meet their ESG responsibilities
-
Improved social network of VIOs
-
Improved social impact of VIOs
-
Increased appreciation of volunteering which benefits the government
-
Improved community resources and support (such as youth zones)
The fact that we did not monetise the social benefits does not mean that the value of these benefits is lower than other volunteering outcomes. Previous studies and our stakeholder engagement highlighted the importance of social benefits to the volunteer and wider society (Abrams and others, 2023). These benefits are related to social and community cohesion (for example, feeling connected to the neighbourhood, and increased civic trust), social capital (for example, stronger social relationships), and soft skills (for example, improved communication skills). The effect of volunteering on soft and social skills was also found to be strong among young people (13 and 14-year-olds) (See and others, 2017). Some of the mechanisms driving these benefits are increased social interactions, trust, pro-social behaviour, and the feeling of making a social impact while volunteering (Abrams and others, 2023).
While Understanding Society includes variables that can be used as proxies for the social outcomes listed above, it is difficult to monetise the effect of volunteering on these variables because a monetary social capital value (like for wellbeing) does not exist. Some of the social benefits may themselves be mechanisms that drive the impact of volunteering on wellbeing. We provide some quantitative estimates of the effect of volunteering on some social outcomes in Section 10.
12.5 A1.4 Methods to estimate the main costs associated with volunteering
We excluded the costs associated with volunteering from the monetisation due to reasons related to data availability, and logistical and conceptual challenges in the primary data collection, which we discuss in detail in Annex A1.5. Although certain costs are more challenging to estimate than others, we decided to exclude the costs altogether to avoid presenting an incomplete estimate of costs. Nevertheless, as our initial objective in part A was to provide a figure of the net benefits of volunteering, we developed methods to estimate the main costs associated with volunteering for volunteers, VIOs, government and taxpayers. Similarly to the methodologies to estimate employment benefits and healthcare costs saved (see Annex A1.2, these methodologies provide a monetisation toolkit for future research that aims to estimate the costs associated with volunteering.
Below we outline the methodologies to estimate the various costs associated with volunteering and the key reasons for excluding the costs from the final monetisation (see Annex A1.5).
A1.4.1 Opportunity costs of volunteering
Individual volunteers incur the opportunity cost of foregone earnings when deciding to volunteer instead of working. Previous studies estimated the foregone earnings of volunteers in individual volunteering programmes or sectors, for example, hospital volunteers (Handy and Srinivasan, 2004), and found that the majority of volunteers forego leisure instead of working time.[footnote 56] Given that many volunteers would otherwise forego leisure rather than working time, it would not be appropriate to include the foregone earnings of all volunteers as a cost. Instead, it is only appropriate to include the foregone earnings of volunteers who would otherwise undertake paid work if they were not volunteering. The calculations of the cost estimation approach for the opportunity cost of foregone earnings are shown in Table 22.
Table 22: Inputs into foregone earnings estimation
| Input | Description | Source |
|---|---|---|
| A | Average number of hours per week spent on volunteering instead of paid work, converted to a yearly figure | Estimates of the impact of volunteering on hours worked for those aged 16 to 65 from using Understanding Society |
| B | Median hourly wage in England | Annual Survey of Hours and Earnings |
| C | Number of volunteers aged 16 to 65 in England in 2021/22 | Community Life Survey and ONS population estimates |
| A×B×C | Total value of foregone earnings due to volunteering in England in 2021/22 | - |
Source: London Economics’ analysis.
The number of working hours foregone due to volunteering for those aged 16 to 65 can be estimated using Understanding Society,[footnote 57] by estimating the impact of volunteering on hours worked for those who are in employment before volunteering. This would provide the average number of hours lost or gained due to volunteering per volunteer. In Section 8.2.3, we found a small negative impact of volunteering on hours worked in paid employment, but the result was only weakly statistically significant. Similar analysis can provide a weekly figure, which would be converted to a yearly figure.
The median hourly wage of volunteers in employment in 2021/22 can be estimated using median hourly pay in England in 2021 from the Annual Survey of Hours and Earnings (Office for National Statistics, 2021).
The number of volunteers aged 16 to 65 in England in 2021/22 can be estimated by using Community Life Survey data on whether individuals have volunteered in the last 12 months, multiplied by ONS population estimates for England in mid-year 2022 (Office for National Statistics, 2023).
After estimating foregone earnings, the tax revenue that the government foregoes because of the foregone earnings of volunteers can also be calculated, accounting for National Insurance contributions, value-added tax (VAT), and income tax. This adjustment would apportion the cost from the gross income foregone to individuals and the government.
A1.4.2 Out-of-pocket expenses
While volunteers incur an opportunity cost of volunteering, volunteering may also involve some out-of-pocket expenses to the volunteer, such as transportation costs or childcare costs, which are not fully covered by VIOs (Handy and Mook, 2011). However, as VIOs aim to cover major out-of-pocket expenses, these may be small relative to other volunteering costs. The remaining expenses covered by VIOs or infrastructure organisations would be accounted for when considering costs to VIOs and infrastructure organisations.
During our desk research, we could not identify any England-wide cost estimates of out-of-pocket expenses of volunteers. Therefore, one would need to collect the data through primary data collection with volunteers. This primary data could be either collected through a bespoke representative survey of volunteers or by adding questions to the CLS. The calculations of the cost estimation approach for the cost of out-of-pocket expenses are shown in Table 23.
Table 23: Inputs into out-of-pocket estimation
| Input | Description | Source |
|---|---|---|
| A | Expenses during the volunteering activity that are not reimbursed by the VIO | Primary data collection with volunteers |
| B | Number of volunteers in England in 2021/22 | Community Life Survey and ONS population estimates |
| A×B | Total value of volunteering out-of-pocket expenses in 2021/22 | - |
Source: London Economics’ analysis.
A1.4.3 Costs to VIOs and infrastructure organisations
VIOs face costs related to involving volunteers. However, it is challenging to attribute these costs directly to volunteering. VIOs incur other expenses unrelated to volunteering (for example, paying staff or buying food for food banks), and their financial accounts typically do not separate costs specific to volunteering. Previous studies estimated the costs of volunteering for individual programs, but no nationwide estimate exists for England. Similarly, infrastructure organisations supporting volunteering also incur costs, but these may be inflated if their non-volunteering activities (like offering funding advice) are included. These organisations generally do not track costs specific to volunteering. In 2020-21, UK voluntary sector infrastructure spending was over £500 million (Kane and Cohen, 2023), representing an upper estimate for volunteering-related costs in that year.
The main costs to VIOs that can be measured are the following:
-
Personnel costs: VIOs employ paid staff to maintain the provision of volunteering outputs. These staff spend time training, recruiting and managing volunteers. Similarly, infrastructure organisations employ paid staff to facilitate volunteering in other organisations.
-
Resource costs: VIOs need digital and physical resources to run volunteering activities, while infrastructure organisations need them to facilitate volunteering. Examples of these costs are IT resources (software and hardware) to coordinate volunteers or office facilities (desks or chairs) and rent for the office.
-
Expenses: In many cases, volunteers can claim expenses from VIOs, such as travel expenses (NCVO, 2023a). VIOs often record paid expenses within their accounts, but full accounts may not be freely available online. Any out-of-pocket expenses (those not reimbursed by VIOs) would be accounted for within volunteers’ costs.
Due to the lack of secondary data on the key costs associated with involving volunteers (for VIOs) and facilitating volunteering (for infrastructure organisations), primary data collection would be necessary. There would be three main methods to collect this primary data:
-
Through a survey of VIOs and infrastructure organisations
-
By including a question in a pre-existing survey, such as the VCSE Barometer Survey[footnote 58]
-
Through in-depth interviews with VIOs and infrastructure organisations
However, there are challenges associated with these primary data collection methods, which are discussed in Annex A1.5.
Once the cost information is collected it can be aggregated to the England level for VIOs by:
-
Using the number of VIOs in England by size in 2021/22 from NCVO’s Civil Society Almanac (based on Charity Commission data) (NCVO, 2023b)
-
Calculating a per-volunteer cost figure, then using the number of volunteers in England from the Community Life Survey and ONS population estimates.
A1.4.4 Costs to government and taxpayers
In addition to the foregone tax revenue, volunteering generates Exchequer costs through the central government and local authority funding for volunteering. This funding can be broken down into two broad strands:
-
Government funding of organisations (VIOs or infrastructure organisations), for example, through local authority funding of community projects.
-
Government funding to facilitate or encourage volunteering, which cannot be attributed to a particular VIO or infrastructure organisation, for example DCMS funding for the Vision for Volunteering, or civil servant time spent on volunteering-related work.
Volunteering-related costs to VIOs and infrastructure organisations are already accounted for (see Annex A1.4.3. To avoid double counting, we would suggest deriving a figure for total (central and local) government funding for volunteering by apportioning total VIO and infrastructure organisation volunteering-related costs by the share of income that they receive from government sources.
To estimate the government funding to facilitate and encourage volunteering, consultation with DCMS would be required to understand the central government costs. For local funding, interviews with local authorities and/or an organisation such as the Local Government Association (LGA) would be required.
12.6 A1.5 Reasons for excluding primary data collection from the study
After consultation with DCMS, we decided to exclude the costs of volunteering and the adjustment of the replacement cost from our estimation and monetisation of the value of volunteering. The main reasons for this are the logistical and conceptual challenges in the primary data collection, which are presented below. Ultimately, these logistical and conceptual challenges meant that the resources required to undertake the primary data collection could not be justified.
As discussed in Section 6.2, an important assumption of the replacement cost method that is applied in our estimation of the replacement cost (and previous studies) is a one-to-one equivalence between volunteer and paid labour. However, our stakeholder consultations during part A of this research project have shown that this assumption is unrealistic and should be accounted for. Hence, we initially planned to ask VIOs directly to estimate the share of volunteers they would replace with paid staff in the absence of volunteering. These questions could be included in the primary data collection strategy to collect cost information from VIOs.
Logistical challenges
The primary data collection for the estimation of the costs to volunteers and VIOs through a bespoke or pre-existing survey is technically feasible, but may come with some logistical challenges that could limit the value of the data produced.
Based on other research conducted on behalf of DCMS through a wider volunteer research contract, we know that it can be challenging to engage large numbers of VIOs with research given the pressures on their time. Even with a relatively short survey that is heavily promoted, it would be difficult to design survey questions in a way that would allow VIOs to straightforwardly provide the estimates, given the complexity of the questions. A survey would also not allow enough time for organisations to provide the required estimates, as they may need to thoroughly review their accounts and operations to provide a meaningful estimate. This could ultimately result in poor-quality data. While the low response rate could potentially be mitigated to some extent by offering incentives, this would increase the cost of the fieldwork and still may not guarantee high-quality responses. A higher response rate increases the quality of the data because of lower non-response bias.
The option to include questions in pre-existing surveys such as the CLS and the VCSE Barometer Survey also suffers from logistical challenges. For example, for the CLS, there is a long time lag for both agreeing to include questions and the availability of resulting data thereafter, so this approach would have resulted in a long delay in producing this report.
Conceptual challenges
The primary data collection also suffers from conceptual challenges that make it difficult to ensure that the data collected is reliable and representative of the whole population, even if we manage to achieve a high response rate.
Volunteers and VIOs may have different understandings of the costs that are exclusively related to volunteering. For example, a small charity may be completely run by volunteers while for larger organisations only a small part of their operations is run by volunteers. Moreover, VIOs may need to spend a long time collecting the cost information and distinguishing the costs that accrue exclusively due to the involvement of volunteers. Finally, it would be difficult for VIOs to provide a reliable estimate of the share of volunteers that they would replace with paid staff in the absence of volunteers (necessary for the estimation of the adjustment factor). This is because answering this question requires a high degree of abstract thinking to construct the counterfactual where there are no volunteers. It would also require detailed knowledge of volunteers’ activities. Smaller organisations may not hold detailed data on the number of volunteers, while larger organisations may struggle to derive a single adjustment factor across diverse volunteering activities.
12.7 A1.6 Total number of volunteers and hours volunteered
Table 24: Number of hours volunteered in England in 2021/22 by volunteering frequency
| Volunteering frequency | Number of hours volunteered |
|---|---|
| At least once a week | 766.7m |
| Less than once a week but at least once a month | 327.6m |
| Less often than once a month | 150.6m |
| At least once in the past 12 months | 1,245.0m |
Table 25: Number of volunteers in England in 2021/22 by volunteering frequency
| Volunteering frequency | Number of volunteers |
|---|---|
| At least once a week | 3.742m |
| Less than once a week but at least once a month | 3.814m |
| Less often than once a month | 4.714m |
| At least once in the past 12 months | 12.270m |
12.8 A1.7 Replacement cost mapping
Table 26: Mapping between 2021/22 Community Life Survey activity types and SOC 2020 occupations, with the associated median hourly pay per occupation
| 2021/22 CLS activity types | SOC 2020 occupations (or group of occupations) | Median hourly pay |
|---|---|---|
| A. Raising or handling money/ taking part in sponsored events | Clerical and Secretarial | £12.04 |
| B. Leading a group/member of a committee | Professional | £21.83 |
| C. Getting other people involved | Personal and Protective | £10.39 |
| D. Organising or helping to run an activity or event[footnote 59] | Clerical and Secretarial | £12.04 |
| E. Visiting people | Personal and Protective | £10.39 |
| F. Befriending or mentoring people | Personal and Protective | £10.39 |
| G. Giving advice/information/counselling | Personal and Protective | £10.39 |
| H. Secretarial, admin or clerical work | Clerical and Secretarial | £12.04 |
| I. Providing transport/driving | Personal and Protective | £10.39 |
| J. Representing | Professional | £21.83 |
| K. Campaigning | Professional | £21.83 |
| L. Other practical help (for example, helping out at school, shopping) | Personal and Protective | £10.39 |
| M. Any other help | Personal and Protective | £10.39 |
| Any combination of citizenship categories with personal and protective, and professional SOC occupations (e.g. categories B and E) | Personal and Professional | £16.11 |
| Any combination of citizenship categories with personal and protective, and clerical SOC occupations (e.g. categories C and D) | Personal and Clerical | £11.22 |
| Any combination of citizenship categories with professional and clerical SOC occupations (e.g. categories A and B) | Professional and Clerical | £16.94 |
| Any combination of citizenship categories with personal and protective, professional and clerical SOC occupations (e.g. categories A, B and C) | Professional, Personal and Clerical | £14.75 |
Source: London Economics’ analysis based on ONS Household Satellite Accounts and Annual Survey of Hours and Earnings.
12.9 A1.8 Wellbeing benefits by volunteering frequency
In addition to the estimation of the impact of volunteering incidence on volunteer wellbeing, we have estimated the impact of volunteering frequency on volunteer wellbeing. We applied the same methodology as in Section 7.1, but we produced three separate estimates of the impact of volunteering for each frequency category available in Understanding Society.[footnote 60] To obtain the total wellbeing value in each frequency category, we multiplied each estimate with the adjusted WELLBY value and the number of volunteers associated with each frequency category (see Table 27). We applied the same methodology as in step 4 in Section 6.1 to estimate the number of volunteers in each volunteering frequency.
This estimation supplements the estimation of wellbeing benefits based on volunteering incidence in Section 7. It is provided to highlight how the results differ by volunteering frequency category, rather than to replace the core estimate in Section 7.3. If these wellbeing benefits of volunteers in each frequency category are totalled, we obtain a total wellbeing benefit of £9.115 billion in England in 2021/22 (see Table 27). This total wellbeing benefit figure differs from the total figure based on volunteering incidence because of two reasons. Firstly, the number of observations in the two separate regressions (volunteering frequency vs. incidence) is different. Secondly, the econometric specification of the two regressions is different. For the former estimation, volunteering frequency was coded as a categorical variable (0 = not volunteered in the past 12 months, 1 = volunteered at least once a week, 2 = volunteered less than once a week but at least once a month, and 3 = volunteered less than once a month) while for the latter it was coded as a dummy variable (0 = not volunteered in the past 12 months, 1 = volunteered at least once in the past 12 months).
We estimated that volunteering less than once a week but at least once a month increases life satisfaction by 0.061 units on a 1-to-7-point scale compared to those who do not volunteer. Volunteering at least once a week increases life satisfaction by 0.034 units compared to those who do not volunteer. The estimate for those who volunteer less often than once a month is not statistically significant and hence the monetised value is not robust, but we have presented it here for completeness.
The wellbeing benefit of those who volunteered less than once a week but at least once a month was the highest (£4.798 billion) compared to other frequency categories. This result is driven by the estimate of the average impact of volunteering on life satisfaction being substantially higher for this group compared to estimates for the other volunteering frequency groups.
Table 27: Estimates of the inputs for the wellbeing monetisation
| Volunteering frequency | Average impact of volunteering on life satisfaction (A) | 2021 WELLBY value adjusted to a 1-7-point scale (B) | Number of volunteers in 2021/22 (C) | Total wellbeing benefit (A*B*C) |
|---|---|---|---|---|
| At least once a week | 0.034** | £20,634 | 3.742m | £2.616bn |
| Less than once a week but at least once a month | 0.061*** | £20,634 | 3.814m | £4.798bn |
| Less often than once a month | 0.017 | £20,634 | 4.714m | £1.700bn |
| Total | £9.115bn |
Note: The *-signs indicate the statistical significance of the estimates: *** p-value < 0.01, ** p-value < 0.05, * p-value < 0.1. The total wellbeing benefit in the last row represents the sum of the wellbeing benefits of each volunteering frequency category. The totals may not add up because of rounding.
Source: London Economics’ analysis of Understanding Society, Green Book and Community Life Survey data
12.10 A1.9 Additional econometric results
The section presents results from ordinary least squares models and provides additional findings from fixed effects models, including analysis broken down by age group or with the volunteering variable lagged by two or three years.
The main estimates of the analysis are produced using fixed effects models (fixed effects, fixed effects logistic, and fixed effects ordinal regressions),[footnote 61],[footnote 62] as these models account for unobserved, time-invariant individual characteristics and focus on within-individual changes over time.
There are notable differences between OLS models (including OLS, logistic, and ordinal regressions) and the fixed-effects model. OLS models do not account for the panel structure[footnote 63] of Understanding Society and fail to control for unobserved individual-level characteristics. They essentially treat all observations as though they are from a cross-sectional dataset, which can lead to an overestimation of the true effect of volunteering on the outcome variables. For example, if individuals with certain personality traits are more likely to volunteer and be employed, the OLS model may overstate the actual effect of volunteering.
In contrast, fixed effects models often produce more conservative estimates or even reversed effects when compared to OLS. These models control for unchanging individual traits, such as personality or work ethic, that might influence the outcome variables. By isolating within-individual changes over time and accounting for unobserved, time-invariant characteristics, fixed effects models provide a clearer understanding of the relationship between volunteering and the outcome variables.
As the focus of this analysis is on the impact of volunteering on the outcome variables, fixed effects models are preferred. OLS models are susceptible to bias from the unobserved individual differences (for example, motivation levels), which can distort the results.
For example, when estimating the impact of volunteering on the number of GP appointments, the sign on the coefficients changes when comparing fixed effects models to OLS. This may occur because volunteers could possess unobservable traits, such as being more health conscious or engaging in preventative care, which might increase the number of GP appointments. However, once these unobservable traits are controlled for in the fixed effects model, the number of GP appointments decreases.
Despite the limitations of OLS, it is included here as a robustness check to validate the consistency of the findings.
A1.9.1 Control variables
For each regression, a range of control variables were included to ensure robustness and accuracy in the analysis. The control variables were selected to account for potential confounding factors to isolate the effects of the outcome variables in each model.
Some control variables were consistent across all specifications. These were sex, age, ethnicity, educational attainment, region of residence, self-rated general health, whether the respondent has a health condition or disability, the survey wave, and the month of the survey.
In addition to these control variables, the following outcome-specific control variables were included:
-
Wellbeing benefits: Household income, marital status, employment status, number of children, religiosity, whether the respondent is a carer for someone in their household, home ownership status, whether the respondent would like to move house, and whether the respondent lives in a rural or urban area.
-
Employment status: Marital status, the respondent’s partner’s employment status, number of children, and whether the respondent is a carer for someone in their household.
-
Hours worked, monthly wages, and hourly wages: Marital status, full-time or part-time employment status, the respondent’s partner’s employment status, job sector, number of children, and whether the respondent is a carer for someone in their household.
-
Healthcare appointments: Household income, employment status, and life satisfaction.
-
Social outcomes: Household income, marital status, employment status, number of children, religiosity, whether the respondent is a carer for someone in their household, home ownership status, whether the respondent would like to move house, and whether the respondent lives in a rural or urban area.
A1.9.2 Wellbeing benefits
Table 28: Pooled OLS coefficients for the impact of volunteering on life satisfaction
| Volunteering incidence | |
|---|---|
| At least once in the past 12 months | 0.042*** |
| Observations | 183,939 |
| Volunteering frequency |
| Less than once a month | 0.013 |
| At least once a month but less than once a week | 0.054*** |
| At least once a week | 0.057*** |
| Observations | 183,863 |
Note: Based on an ordinary least squares model estimating the impact of volunteering at time t on life satisfaction at time t, across all ages. The results are based on two regressions: one for volunteering incidence (a binary variable based on whether an individual volunteers or not) and one for volunteering frequency. A coefficient of 0.042 suggests that, on average, volunteering leads to a 0.042-unit increase on a 1-to-7-point life satisfaction scale. The *-signs indicate the statistical significance of the estimates: *** p-value < 0.01, ** p-value < 0.05, * p-value < 0.1. Values in bold indicate statistical significance at the 10% level or higher.
Source: London Economics’ analysis of Understanding Society
Table 29: Average change in life satisfaction depending on the change in volunteering status between time t-2 and t
| Stopped volunteering between t-2 and t | Started volunteering between t-2 and t | Always volunteered between t-2 and t | |
|---|---|---|---|
| Decrease in life satisfaction | 0.012*** | -0.007* | 0.000 |
| No change in life satisfaction | -0.001* | 0.000** | -0.000 |
| Increase in life satisfaction | -0.011*** | 0.007* | -0.000 |
| Observations | 112,185 | 112,185 | 112,185 |
Note: Based on a first-difference model estimating the impact of volunteering between time t-2 and t, on changes in life satisfaction over the same period, across all ages. The regression is based on volunteering incidence (a binary variable based on whether an individual volunteers or not). A coefficient of 0.012 in the ‘decrease in life satisfaction’ and ‘stopped volunteering between t-2 and t’ categories suggests that, on average, individuals who stop volunteering between time t-2 and t are 1.2 percentage points more likely to experience a decrease in wellbeing compared to someone who did not volunteer during that period. The *-signs indicate the statistical significance of the estimates: *** p-value < 0.01, ** p-value < 0.05, * p-value < 0.1. Values in bold indicate statistical significance at the 10% level or higher.
Source: London Economics’ analysis of Understanding Society
A1.9.3 Employment outcomes
Likelihood of employment
Table 30: Marginal effects for the impact of volunteering on the likelihood of employment
| First lag (t-1) | Second lag (t-2) | Third lag (t-3) | |
|---|---|---|---|
| Volunteering incidence | |||
| At least once in the past 12 months | -0.033*** | -0.025*** | -0.021*** |
| Observations | 128,205 | 114,054 | 104,005 |
| Volunteering frequency | |||
| Less than once a month | 0.000 | 0.004 | 0.009* |
| At least once a month but less than once a week | -0.004 | -0.005 | -0.004 |
| At least once a week | -0.069*** | -0.054*** | -0.049*** |
| Observations | 128,159 | 114,107 | 103,973 |
Note: Based on a logistic model estimating the impact of volunteering at time t-1, t-2 and t-3 on employment at time t, for individuals aged 16 to 65. The results are based on two regressions: one for volunteering incidence (a binary variable based on whether an individual volunteers or not) and one for volunteering frequency. A marginal effect of -0.033 suggests that, on average, volunteering at time t-1 is associated with a 3.3 percentage-point decrease in the probability of being employed in the following year. The *-signs indicate the statistical significance of the estimates: *** p-value < 0.01, ** p-value < 0.05, * p-value < 0.1. Values in bold indicate statistical significance at the 10% level or higher.
Source: London Economics’ analysis of Understanding Society
Table 31: Partial elasticities for the impact of volunteering on the likelihood of employment
| Second lag (t-2) | Second lag (t-2) | Second lag (t-2) | Third lag (t-3) | Third lag (t-3) | Third lag (t-3) | |
|---|---|---|---|---|---|---|
| Aged 16-25 | Aged 26-45 | Aged 46-65 | Aged 16-25 | Aged 26-45 | Aged 46-65 | |
| Volunteering incidence | ||||||
| At least once in the past 12 months | 0.107** | 0.061*** | 0.070*** | -0.003 | 0.019 | 0.039* |
| Observations | 4,439 | 7,121 | 13,339 | 3,004 | 5,903 | 12,622 |
| Volunteering frequency | ||||||
| Less than once a month | 0.043 | 0.046* | 0.042 | 0.004 | 0.010 | 0.045 |
| At least once a month but less than once a week | 0.020 | 0.072** | 0.085** | 0.130 | 0.045 | 0.001 |
| At least once a week | 0.204*** | 0.067*** | 0.081** | -0.054 | 0.016 | 0.056* |
| Observations | 4,436 | 7,116 | 13,331 | 3,002 | 5,903 | 12,614 |
Note: Based on a fixed-effects logistic model estimating the impact of volunteering at time t-2 and t-3 on employment at time t, for individuals aged 16 to 65. The results are based on two regressions: one for volunteering incidence (a binary variable based on whether an individual volunteers or not) and one for volunteering frequency. A partial elasticity of 0.107 suggests that, on average, volunteering at time t-2 is associated with a 10.7% increase in the probability of being employed in the following year, relative to the baseline employment rate for non-volunteers. The *-signs indicate the statistical significance of the estimates: *** p-value < 0.01, ** p-value < 0.05, * p-value < 0.1. Values in bold indicate statistical significance at the 10% level or higher.
Source: London Economics’ analysis of Understanding Society
Hours worked
Table 32: Pooled OLS coefficients for the impact of volunteering on hours worked
| First lag (t-1) | Second lag (t-2) | Third lag (t-3) | |
|---|---|---|---|
| Volunteering incidence | |||
| At least once in the past 12 months | -0.573*** | -0.456*** | -0.444*** |
| Observations | 77,265 | 69,131 | 62,604 |
| Volunteering frequency | |||
| Less than once a month | -0.277*** | -0.095 | 0.003 |
| At least once a month but less than once a week | -0.371*** | -0.479*** | -0.496*** |
| At least once a week | -0.930*** | -0.752*** | -0.786*** |
| Observations | 77,241 | 69,110 | 62,588 |
Note: Based on a pooled ordinary least squares model estimating the impact of volunteering at time t-1, t-2 and t-3 on weekly hours worked at time t, for individuals aged 16 to 65. The results are based on two regressions: one for volunteering incidence (a binary variable based on whether an individual volunteers or not) and one for volunteering frequency. A coefficient of -0.573 suggests that, on average, volunteering in the past 12 months at time t-1 is associated with a 0.573-hour reduction in weekly hours worked in the following year. The *-signs indicate the statistical significance of the estimates: *** p-value < 0.01, ** p-value < 0.05, * p-value < 0.1. Values in bold indicate statistical significance at the 10% level or higher.
Source: London Economics’ analysis of Understanding Society.
Table 33: Fixed effects coefficients for the impact of volunteering on hours worked
| First lag (t-1) | Second lag (t-2) | Third lag (t-3) | |
|---|---|---|---|
| Volunteering incidence | |||
| At least once in the past 12 months | -0.130* | -0.110 | -0.016 |
| Observations | 77,265 | 69,131 | 62,604 |
| Volunteering frequency | |||
| Less than once a month | -0.091 | -0.054 | 0.076 |
| At least once a month but less than once a week | -0.168 | -0.268** | -0.278** |
| At least once a week | -0.139 | -0.082 | 0.033 |
| Observations | 77,241 | 69,110 | 62,588 |
Note: Based on fixed effects model estimating the impact of volunteering at time t-1, t-2 and t-3 on weekly hours worked at time t, for individuals aged 16 to 65. The results are based on two regressions: one for volunteering incidence (a binary variable based on whether an individual volunteers or not) and one for volunteering frequency. A coefficient of -0.130 suggests that, on average, volunteering in the past 12 months at time t-1 is associated with a 0.130-hour reduction in weekly hours worked in the following year. The *-signs indicate the statistical significance of the estimates: *** p-value < 0.01, ** p-value < 0.05, * p-value < 0.1. Values in bold indicate statistical significance at the 10% level or higher.
Source: London Economics’ analysis of Understanding Society.
Hourly pay
Table 34: Pooled OLS coefficients for the impact of volunteering on hourly pay
| First lag (t-1) | Second lag (t-2) | Third lag (t-3) | |
|---|---|---|---|
| Volunteering incidence | |||
| At least once in the past 12 months | 0.054*** | 0.051*** | 0.044*** |
| Observations | 77,265 | 69,131 | 62,623 |
| Volunteering frequency | |||
| Less than once a month | 0.069*** | 0.065*** | 0.074*** |
| At least once a month but less than once a week | 0.113*** | 0.105*** | 0.096*** |
| At least once a week | 0.011 | 0.010 | -0.007 |
| Observations | 77,241 | 69,110 | 62,607 |
Note: Based on a pooled ordinary least squares model estimating the impact of volunteering at time t-1, t-2 and t-3 on hourly wages at time t, for individuals aged 16 to 65. The results are based on two regressions: one for volunteering incidence (a binary variable based on whether an individual volunteers or not) and one for volunteering frequency. A coefficient of 0.054 suggests that, on average, volunteering in the past 12 months at time t-1 is associated with a 5.4% higher hourly wage in the following year compared to non-volunteers. The *-signs indicate the statistical significance of the estimates: *** p-value < 0.01, ** p-value < 0.05, * p-value < 0.1. Values in bold indicate statistical significance at the 10% level or higher.
Source: London Economics’ analysis of Understanding Society.
Table 35: Fixed effects coefficients for the impact of volunteering on hourly wages
| Second lag (t-2) | Second lag (t-2) | Second lag (t-2) | Third lag (t-3) | Third lag (t-3) | Third lag (t-3) | |
|---|---|---|---|---|---|---|
| Aged 16-25 | Aged 26-45 | Aged 46-65 | Aged 16-25 | Aged 26-45 | Aged 46-65 | |
| Volunteering incidence | ||||||
| At least once in the past 12 months | -0.004 | 0.007 | -0.005 | -0.013 | -0.003 | -0.003 |
| Observations | 4,709 | 13,578 | 12,385 | 3,613 | 12,016 | 11,921 |
| Volunteering frequency | ||||||
| Less than once a month | -0.005 | 0.006 | -0.000 | 0.031 | 0.012 | 0.004 |
| At least once a month but less than once a week | 0.038 | 0.038*** | -0.003 | -0.084 | 0.013 | -0.010 |
| At least once a week | -0.017 | -0.011 | -0.010 | -0.039 | -0.033*** | -0.009 |
| Observations | 4,708 | 13,576 | 12,384 | 3,613 | 12,015 | 11,921 |
Note: Based on a fixed effects model estimating the impact of volunteering at time t-2 and t-3 on hourly wages at time t. The results are based on two regressions: one for volunteering incidence (a binary variable based on whether an individual volunteers or not) and one for volunteering frequency. A coefficient of -0.004 suggests that, on average, volunteering in the past 12 months at time t-1 is associated with a 0.4% lower hourly wage in the following year compared to non-volunteers. The *-signs indicate the statistical significance of the estimates: *** p-value < 0.01, ** p-value < 0.05, * p-value < 0.1. Values in bold indicate statistical significance at the 10% level or higher.
Source: London Economics’ analysis of Understanding Society.
Monthly wages
As discussed in Section 8, we also estimated the impact of volunteering incidence and frequency on monthly wages. We also conducted subgroup analysis and estimated the impact by different age groups.
We estimate that on average, volunteering at least once in the past 12 months is associated with a 1.6% lower monthly wage in the following year compared to non-volunteers (see Table 36). The direction of the estimates in Table 36 is the same as those of the estimates based on hourly pay (see Table 9). However, the estimates differ in size and statistical significance. Unlike the estimates based on hourly pay, the negative impact of volunteering on monthly wages is primarily driven by the most frequent volunteers and the older age group. Volunteering at least once a week is associated with a 4.2% lower monthly wage in the following year for volunteers aged 46 and 65, compared to non-volunteers. This negative effect could be partly explained by the negative estimates of the impact on hours worked (see Table 11), which could suggest that volunteers aged between 46 and 65 may earn less than non-volunteers because they substitute paid work for volunteering.
Table 36: Regression coefficients for the impact of volunteering on monthly wages
| All ages | Aged 16-25 | Aged 26-45 | Aged 46-65 | |
|---|---|---|---|---|
| Volunteering incidence | ||||
| At least once in the past 12 months | -0.016*** | -0.007 | 0.004 | -0.016* |
| Observations | 77,265 | 8,617 | 35,245 | 33,403 |
| Volunteering frequency | ||||
| Less than once a month | -0.001 | -0.046 | 0.015 | 0.001 |
| At least once a month but less than once a week | -0.005 | -0.013 | 0.029* | -0.011 |
| At least once a week | -0.042*** | 0.045 | -0.025** | -0.042*** |
| Observations | 77,241 | 8,612 | 35,238 | 33,391 |
Note: Based on a fixed effects model estimating the impact of volunteering at time t-1 on monthly wages at time t, for individuals aged 16 to 65. Each column is based on two regressions: one for volunteering incidence (a binary variable based on whether an individual volunteers or not) and one for volunteering frequency. A coefficient of -0.016 suggests that, on average, volunteering in the past 12 months is associated with a 1.6% lower monthly wage in the following year. The *-signs indicate the statistical significance of the estimates: *** p-value < 0.01, ** p-value < 0.05, * p-value < 0.1. Values in bold indicate statistical significance at the 10% level or higher.
Source: London Economics’ analysis of Understanding Society.
Table 37: Pooled OLS coefficients for the impact of volunteering on monthly wages
| First lag (t-1) | Second lag (t-2) | Third lag (t-3) | |
|---|---|---|---|
| Volunteering incidence | |||
| At least once in the past 12 months | 0.016** | 0.021*** | 0.015** |
| Observations | 77,265 | 69,131 | 62,749 |
| Volunteering frequency | |||
| Less than once a month | 0.049*** | 0.056*** | 0.061*** |
| At least once a month but less than once a week | 0.049*** | 0.077*** | 0.065*** |
| At least once a week | -0.048*** | **-0.036*** | -0.050*** |
| Observations | 77,241 | 69,110 | 62,732 |
Note: Based on a pooled ordinary least squares model estimating the impact of volunteering at time t-1, t-2 and t-3 on monthly wages at time t, for individuals aged 16 to 65. The results are based on two regressions: one for volunteering incidence (a binary variable based on whether an individual volunteers or not) and one for volunteering frequency. A coefficient of 0.016 suggests that, on average, volunteering in the past 12 months at time t-1 is associated with a 1.6% higher monthly wage in the following year. The *-signs indicate the statistical significance of the estimates: *** p-value < 0.01, ** p-value < 0.05, * p-value < 0.1. Values in bold indicate statistical significance at the 10% level or higher.
Source: London Economics’ analysis of Understanding Society.
Table 38: Fixed effects coefficients for the impact of volunteering on monthly wages
| First lag (t-1) | Second lag (t-2) | Third lag (t-3) | |
|---|---|---|---|
| Volunteering incidence | |||
| At least once in the past 12 months | -0.016*** | -0.007 | -0.008 |
| Observations | 77,265 | 69,131 | 62,749 |
| Volunteering frequency | |||
| Less than once a month | -0.001 | -0.002 | 0.007 |
| At least once a month but less than once a week | -0.005 | -0.001 | -0.017* |
| At least once a week | -0.042*** | -0.017** | -0.023** |
| Observations | 77,241 | 69,110 | 62,732 |
Note: Based on a fixed effects model estimating the impact of volunteering at time t-1, t-2 and t-3 on monthly wages at time t, for individuals aged 16 to 65. The results are based on two regressions: one for volunteering incidence (a binary variable based on whether an individual volunteers or not) and one for volunteering frequency. A coefficient of -0.016 suggests that, on average, volunteering in the past 12 months at time t-1 is associated with a 1.6% lower monthly wage in the following year. The *-signs indicate the statistical significance of the estimates: *** p-value < 0.01, ** p-value < 0.05, * p-value < 0.1. Values in bold indicate statistical significance at the 10% level or higher.
Source: London Economics’ analysis of Understanding Society.
A1.9.4 Healthcare costs
Table 39: Regression coefficients for the impact of volunteering on the number of GP appointments per year
| Number of GP appointments per year | Volunteered at least once in the past 12 months | Volunteered less than once a month | Volunteered at least once a month but less than once a week | Volunteered at least once a week |
|---|---|---|---|---|
| None | -0.011*** | -0.020*** | -0.011** | -0.005 |
| One to two | -0.002*** | -0.004*** | -0.002* | -0.001 |
| Three to five | 0.006*** | 0.011*** | 0.006** | 0.003 |
| Six to ten | 0.004*** | 0.007*** | 0.004** | 0.002 |
| More than ten | 0.003*** | 0.006*** | 0.003** | 0.002 |
| Observations | 87,239 | 87,180 | 87,180 | 87,180 |
Note: Based on an ordered logistic model estimating the impact of volunteering at time t-1 on GP appointments at time t, across all ages. The results are based on two regressions: one for volunteering incidence (a binary variable based on whether an individual volunteers or not) and one for volunteering frequency. A coefficient of -0.011 suggests that being a volunteer decreases the likelihood of being in the ‘none’ category by 1.1 percentage points in the following year. The number of observations for volunteering frequency is based on the total number of observations used in that regression across all volunteering frequencies. The *-signs indicate the statistical significance of the estimates: *** p-value < 0.01, ** p-value < 0.05, * p-value < 0.1. Values in bold indicate statistical significance at the 10% level or higher.
Source: London Economics’ analysis of Understanding Society.
Table 40: Regression coefficients for the impact of volunteering on the number of outpatient visits per year
| Number of outpatient visits per year | Volunteered at least once in the past 12 months | Volunteered less than once a month | Volunteered at least once a month but less than once a week | Volunteered at least once a week |
|---|---|---|---|---|
| None | -0.024*** | -0.037*** | -0.015** | -0.020*** |
| One to two | 0.009*** | 0.013*** | 0.006** | 0.007*** |
| Three to five | 0.007*** | 0.012*** | 0.005** | 0.006*** |
| Six to ten | 0.004*** | 0.006*** | 0.003** | 0.003*** |
| More than ten | 0.003*** | 0.006*** | 0.002** | 0.003*** |
| Observations | 87,254 | 87,195 | 87,195 | 87,195 |
Note: Based on an ordered logistic model estimating the impact of volunteering at time t-1 on outpatient visits at time t, across all ages. The results are based on two regressions: one for volunteering incidence (a binary variable based on whether an individual volunteers or not) and one for volunteering frequency. A coefficient of -0.024 suggests that being a volunteer decreases the likelihood of being in the ‘none’ category by 2.4 percentage points in the following year. The number of observations for volunteering frequency is based on the total number of observations used in that regression across all volunteering frequencies. The *-signs indicate the statistical significance of the estimates: *** p-value < 0.01, ** p-value < 0.05, * p-value < 0.1. Values in bold indicate statistical significance at the 10% level or higher.
Source: London Economics’ analysis of Understanding Society.
Table 41: Pooled OLS coefficients for the impact of volunteering on days spent as an inpatient per year
| First lag (t-1) | Second lag (t-2) | Third lag (t-3) | |
|---|---|---|---|
| Volunteering incidence | |||
| At least once in the past 12 months | -0.072* | -0.041 | -0.003 |
| Observations | 87,273 | 80,945 | 103,729 |
| Volunteering frequency | |||
| Less than once a month | -0.024 | -0.022 | 0.002 |
| At least once a month but less than once a week | -0.048 | -0.026 | -0.080 |
| At least once a week | -0.113** | -0.059 | 0.030 |
| Observations | 87,214 | 80,894 | 103,686 |
Note: Based on a pooled ordinary least squares model estimating the impact of volunteering at time t-1, t-2 and t-3 on the number of days spent as an inpatient at time t, across all ages. The results are based on two regressions: one for volunteering incidence (a binary variable based on whether an individual volunteers or not) and one for volunteering frequency. A coefficient of -0.072 suggests that, on average, volunteering in the past 12 months is associated with 0.072 fewer days spent as an inpatient in the following year. The *-signs indicate the statistical significance of the estimates: *** p-value < 0.01, ** p-value < 0.05, * p-value < 0.1. Values in bold indicate statistical significance at the 10% level or higher.
Source: London Economics’ analysis of Understanding Society.
Table 42: Fixed effects coefficients for the impact of volunteering on days spent as an inpatient per year
| First lag (t-1) | Second lag (t-2) | Third lag (t-3) | |
|---|---|---|---|
| Volunteering incidence | |||
| At least once in the past 12 months | *-0.127* | 0.079 | 0.100* |
| Observations | 87,273 | 80,945 | 103,729 |
| Volunteering frequency | |||
| Less than once a month | -0.092 | 0.110 | 0.076 |
| At least once a month but less than once a week | -0.119 | 0.103 | 0.085 |
| At least once a week | -0.170* | 0.037 | 0.132 |
| Observations | 87,214 | 80,894 | 103,686 |
Note: Based on a fixed effects model estimating the impact of volunteering at time t-1, t-2 and t-3 on the number of days spent as an inpatient at time t, across all ages. The results are based on two regressions: one for volunteering incidence (a binary variable based on whether an individual volunteers or not) and one for volunteering frequency. A coefficient of -0.127 suggests that, on average, volunteering in the past 12 months is associated with 0.127 fewer days spent as an inpatient in the following year. The *-signs indicate the statistical significance of the estimates: *** p-value < 0.01, ** p-value < 0.05, * p-value < 0.1. Values in bold indicate statistical significance at the 10% level or higher.
Source: London Economics’ analysis of Understanding Society.
Table 43: Fixed effects coefficients for the impact of volunteering on composite healthcare costs per year
| All ages | Aged 16-25 | Aged 26-45 | Aged 46-65 | Aged over 65 | |
|---|---|---|---|---|---|
| Volunteering incidence | |||||
| At least once in the past 12 months | -£49.12* | -£100.29 | -£8.03 | -£12.35 | -£64.55 |
| Observations | 87,335 | 9,191 | 24,601 | 32,085 | 21,458 |
| Volunteering frequency | |||||
| Less than once a month | -£20.91 | £38.90 | -£18.37 | £13.48 | -£23.14 |
| At least once a month but less than once a week | -£63.79* | -£195.15* | £20.50 | -£61.44 | -£123.19 |
| At least once a week | -£69.81* | -£234.08 | -£10.91 | -£7.15 | -£65.76 |
| Observations | 87,276 | 9,180 | 24,591 | 32,064 | 21,441 |
Note: Based on a fixed effects model estimating the impact of volunteering at time t-1 on composite healthcare costs (GP appointments, outpatient visits, and days spent as an inpatient) at time t. Each column is based on two regressions: one for volunteering incidence (a binary variable based on whether an individual volunteers or not) and one for volunteering frequency. A coefficient of -49.12 suggests that, on average, volunteering in the past 12 months is associated with a £49.12 reduction in healthcare costs in the following year. The *-signs indicate the statistical significance of the estimates: *** p-value < 0.01, ** p-value < 0.05, * p-value < 0.1. Values in bold indicate statistical significance at the 10% level or higher.
Source: London Economics’ analysis of Understanding Society.
A1.9.5 Social outcomes
Table 44: Regression coefficients for the impact of volunteering on feeling isolated
| Volunteered at least once in the past 12 months | Volunteered less than once a month | Volunteered at least once a month but less than once a week | Volunteered at least once a week | |
|---|---|---|---|---|
| Often | 0.001 | 0.006* | 0.002 | -0.002 |
| Some of the time | 0.003 | 0.014* | 0.006 | -0.005 |
| Hardly or never | -0.004 | -0.021* | -0.008 | 0.007 |
| Observations | 31,190 | 31,160 | 31,160 | 31,160 |
Note: Based on an ordered logistic model estimating the impact of volunteering at time t on feeling isolated at time t, across all ages. The first column shows a regression based on volunteering incidence (a binary variable based on whether an individual volunteers or not), and the last three columns display the coefficients from a regression based on volunteering frequency. The coefficient of 0.001 in the ‘often’ category suggests that volunteering increases the likelihood of often feeling isolated by 0.1 percentage points. The number of observations for volunteering frequency is based on the total number of observations used in that regression across all volunteering frequencies. The *-signs indicate the statistical significance of the estimates: *** p-value < 0.01, ** p-value < 0.05, * p-value < 0.1. Values in bold indicate statistical significance at the 10% level or higher.
Source: London Economics’ analysis of Understanding Society.
Table 45: Regression coefficients for the impact of volunteering on feeling a lack of companionship, by volunteering frequency
| Volunteered at least once in the past 12 months | Volunteered less than once a month | Volunteered at least once a month but less than once a week | Volunteered at least once a week | |
|---|---|---|---|---|
| Often | 0.004* | 0.006 | 0.003 | 0.004 |
| Some of the time | 0.008* | 0.011 | 0.006 | 0.008 |
| Hardly or never | -0.012* | -0.017 | -0.009 | -0.012 |
| Observations | 31,203 | 31,173 | 31,173 | 31,173 |
Note: Based on an ordered logistic model estimating the impact of volunteering at time t on feeling a lack of companionship at time t, across all ages. The first column shows a regression based on volunteering incidence (a binary variable based on whether an individual volunteers or not), and the last three columns display the coefficients from a regression based on volunteering frequency. The coefficient of 0.004 in the ‘often’ category suggests that volunteering increases the likelihood of often feeling a lack of companionship by 0.4 percentage points. The number of observations for volunteering frequency is based on the total number of observations used in that regression across all volunteering frequencies. The *-signs indicate the statistical significance of the estimates: *** p-value < 0.01, ** p-value < 0.05, * p-value < 0.1. Values in bold indicate statistical significance at the 10% level or higher.
Source: London Economics’ analysis of Understanding Society.
Table 46: Regression coefficients for the impact of volunteering on feeling left out, by volunteering frequency
| Volunteered at least once in the past 12 months | Volunteered less than once a month | Volunteered at least once a month but less than once a week | Volunteered at least once a week | |
|---|---|---|---|---|
| Often | 0.002 | 0.004 | 0.002 | 0.002 |
| Some of the time | 0.006 | 0.011 | 0.005 | 0.005 |
| Hardly or never | -0.009 | -0.015 | -0.007 | -0.006 |
| Observations | 31,195 | 31,165 | 31,165 | 31,165 |
Note: Based on an ordered logistic model estimating the impact of volunteering at time t on feeling left out at time t, across all ages. The first column shows a regression based on volunteering incidence (a binary variable based on whether an individual volunteers or not), and the last three columns display the coefficients from a regression based on volunteering frequency. The coefficient of 0.002 in the ‘often’ category suggests that volunteering increases the likelihood of often feeling left out by 0.2 percentage points. The number of observations for volunteering frequency is based on the total number of observations used in that regression across all volunteering frequencies. The *-signs indicate the statistical significance of the estimates: *** p-value < 0.01, ** p-value < 0.05, * p-value < 0.1. Values in bold indicate statistical significance at the 10% level or higher.
Source: London Economics’ analysis of Understanding Society.
Table 47: Regression coefficients for the impact of volunteering on feeling lonely, by volunteering frequency
| Volunteered at least once in the past 12 months | Volunteered less than once a month | Volunteered at least once a month but less than once a week | Volunteered at least once a week | |
|---|---|---|---|---|
| Often | 0.001 | 0.003 | -0.001 | 0.000 |
| Some of the time | 0.001 | 0.006 | -0.001 | 0.000 |
| Hardly or never | -0.002 | -0.009 | 0.002 | -0.000 |
| Observations | 31,193 | 31,163 | 31,163 | 31,163 |
Note: Based on an ordered logistic model estimating the impact of volunteering at time t on feeling lonely at time t, across all ages. The first column shows a regression based on volunteering incidence (a binary variable based on whether an individual volunteers or not), and the last three columns display the coefficients from a regression based on volunteering frequency. The coefficient of 0.001 in the ‘often’ category suggests that volunteering increases the likelihood of often feeling lonely by 0.1 percentage points. The number of observations for volunteering frequency is based on the total number of observations used in that regression across all volunteering frequencies. The *-signs indicate the statistical significance of the estimates: *** p-value < 0.01, ** p-value < 0.05, * p-value < 0.1. Values in bold indicate statistical significance at the 10% level or higher.
Source: London Economics’ analysis of Understanding Society.
12.11 Annex 2: References
Abrams D, Horsham Z and Davies B (2023) ‘Literature Review - Linking Volunteering and Social Cohesion: Causal Evidence in the UK and Beyond’
Binder, M (2015) ‘Volunteering and life satisfaction: A closer look at the hypothesis that volunteering more strongly benefits the unhappy’ Applied Economics Letters, volume 22, pages 874-885
Christensen M (2017) ‘Healthy Individuals in Healthy Organizations: The Happy Productive Worker Hypothesis’ The Positive Side of Occupational Health Psychology, pages 155-169
Degli Antoni G (2015) ‘Getting a job through voluntary associations: the role of network and human capital creation’ Quaderni Di Economia Del Lavoro, volume 103, pages 49-66
Department of Communities and Justice NSW Volunteering (2023) ‘NSW State of Volunteering Report 2023’
Department for Culture, Media and Sport (2023) ‘Community Life Survey 2021/22’
DiMaria CH, Peroni C and Sarracino F (2020) ‘Happiness Matters: Productivity Gains from Subjective Well-Being’ Journal of Happiness Studies, volume 21, pages 139-160
Dolan P, Krekel C, Shreedhar G, Lee H, Marshall C and Smith A (2021) ‘Happy to Help: The Welfare Effects of a Nationwide Micro-Volunteering Programme’ IZA: Institute of Labour Economics, Discussion Paper number 14431
Downward P, Hallmann K and Rasciute S (2020) ‘Volunteering and Leisure Activity in the United Kingdom: A Longitudinal Analysis of Males and Females’ Nonprofit and Voluntary Sector Quarterly, volume 49, pages 757-775
Handy F and Mook L (2011) ‘Volunteering and Volunteers: Benefit-Cost Analyses’ Research on Social Work Practice, volume 21, pages 412-420
Handy F and Srinivasan N (2004) ‘Valuing Volunteers: An Economic Evaluation of the Net Benefits of Hospital Volunteers’ Nonprofit and Voluntary Sector Quarterly, volume 33, pages 28–54
Health Foundation (2023) ‘Longer hospital stays and fewer admissions’
HM Treasury (2022) ‘Green Book supplementary guidance: Wellbeing’
ILO Department of Statistics (2021) ‘Volunteer work measurement guide’
Jones KC, Weatherly H, Birch S, Castelli A, Chalkley M, Dargan A, Forder JE, Gao J, Hinde S, Markham S, Ogunleye D, Premji S and Roland D (2023) ‘Unit Costs of Health and Social Care 2023 Manual’ Personal Social Services Research Unit.
Kamerade D (2015) ‘Third sector impacts on human resources and community: A critical review’ TSI Working Paper Number 3
Kane D and Cohen T (2023) ‘Sector Infrastructure: Funding Analysis’
Lawton R, Gramatki I, Watt W and Fujiwara D (2021) ‘Does Volunteering Make Us Happier, or Are Happier People More Likely to Volunteer? Addressing the Problem of Reverse Causality When Estimating the Wellbeing Impacts of Volunteering’ Journal of Happiness Studies: volume 22, pages 599-624.
Martin J and Franklin J (2022) ‘Fuller Measures of Output, Input and Productivity in the Non-profit Sector: A Proof of Concept’ ESCoE Discussion Paper 2022–24
Muthuri JN, Matten D and Moon J (2009) ‘Employee Volunteering and Social Capital: Contributions to Corporate Social Responsibility’ British Journal of Management, volume 20, pages 75-89.
Nichol B, Wilson R, Rodrigues A, and Haighton C (2024) ‘Exploring the Effects of Volunteering on the Social, Mental, and Physical Health and Well-being of Volunteers: An Umbrella Review’ VOLUNTAS: International Journal of Voluntary and Nonprofit Organizations, volume 35, pages 97-128
Niebuur J, Van Lente L, Liefbroer AC, Steverink N and Smidt N (2018) ‘Determinants of participation in voluntary work: A systematic review and meta-analysis of longitudinal cohort studies’ BMC Public Health, volume 18
NCVO (2019) ‘Volunteer Impacts’
NCVO (2023a) ‘Paying volunteer expenses’
NCVO (2023b) ‘UK Civil Society Almanac 2023’
Nesta (2020) ‘The Value of People Power’
NHS England (2023) ‘2021/22 National Cost Collection Data Publication’
Office for National Statistics (2013) ‘Household Satellite Accounts – Valuing Voluntary Activity in the UK’
Office for National Statistics (2021) ‘Employee earnings in the UK’
Office for National Statistics (2023) ‘Estimates of the population for England and Wales’
Office for National Statistics (2024a) ‘Earnings and hours worked, region by occupation by two-digit SOC: ASHE Table 3’
Office for National Statistics (2024b) ‘Gross Domestic Product at market prices: Implied deflator: SA’
Office for National Statistics (2024c) ‘Gross domestic product (Average) per head, CVM market prices: SA’
Office for National Statistics (2024d) ‘Household satellite account, UK’
Paine AE, McKay S and Moro, D (2013) ‘Does volunteering improve employability? Insights from the British Household Panel Survey and beyond’ Voluntary Sector Review, volume 4, pages 355-376
Polley MJ, Seers H and Fixsen A (2019) ‘Evaluation Report of the Social Prescribing Demonstrator Site in Shropshire – Final Report’
Qvist HY and Munk MD (2018) ‘The Individual Economic Returns to Volunteering in Work Life’ European Sociological Review, volume 34, pages 198-210
See BH, Gorard S, and Siddiqui N (2017) ‘Does participation in uniformed group activities in school improve young people’s non-cognitive outcomes?’ International Journal of Educational Research, volume 85, pages 109-120
Sport England (2024) ‘Social value of sport and physical activity’
State of Life and National Churches Trust (2021) ‘The House of Good (Update 2021): The economic and social value of church buildings to the UK’
Stuart J, Kamerade D, Connolly DS, Paine DAE, Nichols DG, and Grotz DJ (2020) ‘The Impacts of Volunteering on the Subjective Wellbeing of Volunteers: A Rapid Evidence Assessment’ What Works Centre for Wellbeing and Spirit of 2012
Tabassum F, Mohan J and Smith P (2016) ‘Association of volunteering with mental well-being: A lifecourse analysis of a national population-based longitudinal study in the UK’ BMJ Open 2016, volume 6
Volunteering Queensland (2021) ‘State of Volunteering in Queensland 2021’
Wilson J, Mantovan N and Sauer RM (2020) ‘The economic benefits of volunteering and social class’ Social Science Research, volume 8
-
Formal volunteering incidence was at its lowest level in 2021/22 since the Community Life Survey began, in part due to pandemic-related restrictions. As a result, the total economic and social value of volunteering presented here can be considered an underestimate relative to previous years and the full range of benefits from volunteering. ↩
-
Throughout this report, ‘formal volunteering’ and ‘volunteering’ are often used interchangeably. ↩
-
Some studies have attempted to capture a wide range of sources of value in other countries (for example, Department of Communities and Justice NSW Volunteering, 2023; Volunteering Queensland, 2021). ↩
-
See Section 8.1 and Section 9 for a more detailed explanation of why we did not monetise the analysis for the employment outcomes and healthcare costs, respectively. ↩
-
The Community Life Survey was run yearly from 2012/13 to 2021/22, and has been run quarterly since 2023/24. ↩
-
Data from 2023/24 was released after the analysis was undertaken (see Community Life Survey 2023/24 annual publication). ↩
-
Alongside information on volunteering, the survey also asks questions related to identity and social networks; wellbeing and loneliness; neighbourhood and community; engagement and social action; and charitable giving. ↩
-
Based on the following categories: raising or handling money/taking part in sponsored events; leading a group/member of a committee; getting other people involved; organising or helping to run an activity or event; visiting people; befriending or mentoring people; giving advice/information/counselling; secretarial, admin or clerical work; providing transport/driving; representing; campaigning; other practical help; and any other help. ↩
-
We used data on the average number of hours volunteered in the past four weeks (excluding outliers) by frequency category provided by DCMS through a bespoke data request because the required data was not published in the publicly-available CLS data. ↩
-
For more information, please see the Understanding Society website. ↩
-
More recent data on volunteering was subsequently released on wave 14 after the analysis had been conducted. Data on volunteering was not collected in wave 12. ↩
-
Specifically, whether a respondent has given any unpaid help or worked as a volunteer for any type of local, national, or international organisation or charity. ↩
-
We recoded the volunteering frequency variable to align with the categories used in the Community Life Survey. These categories are: ‘less than once a month’, ‘less than once a week but at least once a month’, and ‘at least once a week’. ↩
-
While data on volunteering is also available in the British Household Panel Survey (the predecessor of Understanding Society), the question in the BHPS looks at all voluntary work, rather than just formal volunteering, so it is not consistent with the Understanding Society question and the definition of volunteering being used from the Community Life Survey. ↩
-
The relevant healthcare variables are available in Understanding Society from waves 7 to 13. As we examined the effect of volunteering at time t-1 on the frequency of healthcare appointments at time t, we used the volunteering variables in waves 6, 8, and 10 to estimate the effect of volunteering on the frequency of healthcare appointments in waves 7, 9, and 11. ↩
-
We examined the effect of volunteering at time t on individual social benefits for volunteers at time t. Variables for social isolation, lack of companionship, feeling left out, and feeling lonely are available in Understanding Society between waves 9 to 13, so we used the volunteering variables from wave 10 to estimate the impact of volunteering on these social benefit variables in wave 10. The variables relating to the feeling of belonging to the neighbourhood and willingness to improve the neighbourhood are available in Understanding Society in waves 1, 3, 6, 9, and 12. For these variables, we used the volunteering variables from wave 6 to estimate their impact in wave 6. ↩
-
This may be due to determinants of health/wellbeing such as socioeconomic status (Niebuur and others, 2018). ↩
-
The fixed effects models only capture changes in an individual’s volunteering status over time, rather than measuring the effect of volunteering in each time period. ↩
-
We use this notation throughout this report to indicate different time periods. In this context, ‘time t’ refers to a specific wave of the Understanding Society survey, while ‘time t-1’ refers to the previous wave. ↩
-
For example, educational attainment or age. ↩
-
To ensure robustness, we applied a range of econometric specifications in addition to the main specifications, including ordinary least squares models and first difference models. ↩
-
A binary variable is a variable that only has two possible values (for example, ‘yes’ or ‘no’). A fixed effects logistic model estimates the likelihood of an event occurring (for example, volunteering), while controlling for individual-specific characteristics. ↩
-
An ordinal variable is a variable where the categories have a natural order or ranking, but the intervals between them are not necessarily equal or meaningful. For example, the number of GP appointments is categorised as: ‘none’, ‘one to two’, ‘three to five’, ‘six to ten’, ‘more than 10’. The fixed effects ordered logistic model estimates the likelihood of an outcome falling into each ordered category, accounting for individual-specific factors. ↩
-
Although the social outcome variables are ordinal, the volunteering and social benefits variables were only available together in one wave. As a result, fixed effects estimation was not possible. Instead, we used an ordered logistic model to estimate the impact of volunteering on these variables. Without fixed effects, the results indicate an association between volunteering and social benefits, but caution is needed when interpreting these effects as causal. ↩
-
The first-difference model examines whether a change in volunteering status (starting or stopping volunteering) is associated with a corresponding change in life satisfaction over the same time period. ↩
-
See Martin and Franklin (2022) for a demonstration of how volunteering can be treated as compensation of employees to generate a gross value added (GVA) figure for the non-profit sector. ↩
-
An additional category (‘organising or helping to run an activity or event’) was included in the 2021/22 CLS, which we classified as a clerical and secretarial activity. ↩
-
Respondents to the CLS could select more than one volunteering activity. If a respondent selected volunteering activities corresponding to just one SOC occupation (for example, ‘visiting people’ and ‘befriending or mentoring people’), the associated median wage was used. However, if a respondent selected volunteering activities relating to more than one matched SOC occupations (for example, ‘providing transport/driving’ and ‘representing’), we followed the same approach as the ONS of creating joint SOC occupations (for example, ‘personal and professional’). The median wage of these joint SOC occupations consists of the average of the median wages of the underlying SOC occupations (the average of ‘personal and protective’ and ‘professional’). ↩
-
We used data on the average number of hours volunteered in the past four weeks (excluding outliers) by frequency category provided by DCMS through a bespoke data request because the required data was not published in the publicly-available CLS data. ↩
-
This refers to those who volunteered at least once in the past 12 months when they filled out the Community Life Survey questionnaire. ↩
-
Using a subjective wellbeing measure such as the life satisfaction index in Understanding Society has some limitations. Each survey respondent will have different baseline expectations and personal thresholds for evaluating their wellbeing. Hence, comparing someone who reported a life satisfaction index of three with another respondent reporting a value of four does not imply that the latter person necessarily has a higher wellbeing. Instead, the second respondent may have a different understanding of the upper and lower band of the scale. ↩
-
In some cases, the distinction between volunteers and beneficiaries of volunteering is not always clear. For example, in the case of volunteering for an advocacy group, volunteers may themselves be the beneficiaries of that volunteering activity. ↩
-
See Dolan and others (2021), Lawton and others (2021) or Stuart and others (2020) for reference. ↩
-
The volunteering frequency categories are the following: ‘at least once a week’, ‘less than once a week but at least once a month’ and ‘less often than once a month’. ↩
-
This is the life satisfaction variable available in the Understanding Society data. ↩
-
This equation can be found in the Green Book supplementary guidance on page 57. We used GDP deflators from the ONS series MNF2 and GDP per capita data from the ONS series IHXW. ↩
-
This result is equivalent to a 0.051-unit increase on a 0-to-10-point life satisfaction scale. To contextualise this, in other studies, moving from employment to unemployment was found to result in a 0.46-unit decrease in life satisfaction; moving from moderate to mild loneliness led to a 0.7-unit increase; positive job quality characteristics led to a 0.25-unit increase; and participation in the National Citizen Service led to a 0.4-unit increase. (HM Treasury, 2022). ↩
-
For example, if volunteering increased the employment rate by 3 percentage points from 5% to 8%, then this increase would be equivalent to a 60% increase in the employment rate. ↩
-
Some individuals may opt for private healthcare appointments rather than relying on NHS appointments. Within Understanding Society, there are variables asking respondents whether they used private or NHS healthcare for specific services, such as blood tests, or during inpatient care. However, the sample size for these variables is relatively small, which makes it impractical to use it for econometric analysis. ↩
-
No visits; one to two visits; three to five visits; six to ten visits; more than ten visits. ↩
-
For GP appointments and outpatient visits we used a fixed effects ordered logistic model, while we used a standard fixed effects model for inpatient days. ↩
-
We also examined the effect of volunteering on healthcare appointments over 2 and 3 years, but did not find statistically significant results for GP or outpatient visits (tables not included here), but the results suggested that volunteering may slightly increase the number of inpatient days after 3 years (see Table 42). ↩
-
In total, we engaged with individuals from 15 organisations (5 through the advisory group and 10 through the practitioner group). ↩
-
For example, volunteering can be undertaken online or in person. It can involve physical activity (for example, sports) or not (for example, tutoring). ↩
-
While we chose to use Understanding Society, it would also be valid to use other datasets to identify the impact of volunteering on employment outcomes if a suitable econometric approach could be identified. ↩
-
The median wage for England is used, as the econometric approach identifies the percentage increase/decrease in wages as a result of volunteering, relative to the average wage. ↩
-
Given the potential wage premium resulting from volunteering, there is a possibility of further increases in revenue for the government, as individuals may require fewer social security benefits, such as Universal Credit. We will explore the feasibility of including this in the analysis. ↩
-
While we chose to use Understanding Society, it would also be valid to use other datasets to identify the impact of volunteering on employment outcomes if a suitable econometric approach could be identified. ↩
-
While there is pay data in Understanding Society, it is not sufficiently reliable to use for monetisation. Additionally, if employment benefits are being considered alongside wage benefits, it is better (as we suggest here) to use pay data for volunteers and non-volunteers to avoid double-counting with wage benefits. ↩
-
Given the potential higher employment rates, there is a possibility of further increased revenue for the government, as individuals may require fewer social security benefits, such as Universal Credit. ↩
-
Some individuals may opt for private healthcare appointments rather than relying on NHS appointments. Within Understanding Society, there are variables asking respondents whether they used private or NHS healthcare for specific services, such as blood tests, or during inpatient care. However, the sample size for these variables is relatively small, which makes it impractical to use it for econometric analysis. ↩
-
While we chose to use Understanding Society, it would also be valid to use other datasets to identify the impact of volunteering on healthcare costs if a suitable econometric approach could be identified. ↩
-
Other data for the cost of outpatient appointments are available for comparison. For example, the National Cost Collection data reports that the average cost of outpatient procedures in 2021/22 was £203 (NHS England, 2023), and PSSRU’s Unit Costs of Health and Social Care reports that the weighted average of all outpatient attendances was £235 in 2021/22 (Jones and others, 2023). ↩
-
Social prescribing enables healthcare professionals to refer people to a range of non-clinical activities, groups, and services to improve their health and wellbeing. ↩
-
This refers to the benefits for businesses from offering employer-supported volunteering schemes. These schemes may attract more job applications and client interest because, for example, they signal corporate social responsibility. ↩
-
It would be inappropriate to include the cost of volunteers’ foregone leisure as volunteering itself can, in some cases, be considered a leisure activity (for example, see Downward and others, 2020) and many volunteers derive wellbeing benefits from volunteering (Lawton and others, 2021). The wellbeing benefits captured in Section 7 are relative to a counterfactual of using time for another purpose (for example, leisure) and therefore captures the net benefit of volunteering relative to any opportunity costs incurred from foregone leisure. In some cases, volunteers may forego activities that they have to pay to replace, such as childcare, which would be accounted for within the calculation of volunteers’ out-of-pocket expenses. ↩
-
While we would have used Understanding Society, it would also be valid to use other datasets to identify the impact of volunteering on hours worked if a suitable econometric approach could be identified. ↩
-
For more information, see the VCSE Barometer Survey’s website. ↩
-
This category was not included in the original 2011/12 ONS mapping because it was not part of the 2011/12 CLS questionnaire. However, it is part of the 2021/22 questionnaire and therefore added and mapped here by LE. ↩
-
‘At least once a week’, ‘less than once a week but at least once a month’ and ‘less often than once a month’. ↩
-
Social outcomes were estimated using OLS models, as only one wave of Understanding Society was available that contains both the volunteering variables and the social outcome variables. ↩
-
Hausman tests were conducted to determine whether fixed effects or random effects models were more appropriate for the analysis. The results indicated that fixed effects models were preferred, as they better account for the correlation between individual-level characteristics and the explanatory variables. ↩
-
Panel data consists of observations on the same units (for example, individuals, households, or firms) over multiple time periods. This allows for the analysis of changes within individuals over time. Cross-sectional data captures observations from a single point in time. ↩