Differences in child obesity by ethnic group
Published 23 January 2019

© Crown copyright 2019
This publication is licensed under the terms of the Open Government Licence v3.0 except where otherwise stated. To view this licence, visit nationalarchives.gov.uk/doc/open-government-licence/version/3 or write to the Information Policy Team, The National Archives, Kew, London TW9 4DU, or email: psi@nationalarchives.gov.uk.
Where we have identified any third party copyright information you will need to obtain permission from the copyright holders concerned.
This publication is available at https://www.gov.uk/government/publications/differences-in-child-obesity-by-ethnic-group/differences-in-child-obesity-by-ethnic-group
Introduction
Childhood obesity is one of the most serious global public health challenges of the 21st century.[footnote 1] Obese children and adolescents are at an increased risk of developing various health problems and are more likely to become obese adults;[footnote 2] there is a clear need for understanding and early prevention.
Analyses of the National Child Measurement Programme (NCMP) data have demonstrated that the obesity prevalence of 4 to 5 year olds and 10 to 11 year olds in England varies by ethnic group.[footnote 3] [footnote 4] It is often assumed that these differences are due to deprivation and other known determinants of child obesity which are sometimes associated with ethnicity. The tables and charts presented here show how obesity prevalence varies by ethnicity after adjustment for other explanatory variables.
Data
The NCMP is an annual programme that measures the height and weight of over 1 million children in Reception (aged 4 to 5 years) and Year 6 (aged 10 to 11 years) in state maintained schools in England. Although the NCMP only covers certain age groups, it includes the majority of children in those year groups. This study uses NCMP data collected in the 2016 to 2017 school year when there was an overall 95% participation rate.[footnote 5]
Assessing the body mass index (BMI, weight/height2) of children is more complicated than for adults because a child’s BMI changes as they mature. In England the British 1990 growth reference (UK90) for BMI is commonly used to determine weight status according to a child’s age and sex.[footnote 6] A UK90 BMI centile of greater than or equal to 95 is considered obese using population monitoring thresholds and is the definition of obesity used here.
Socioeconomic status was classified using the Index of Multiple Deprivation (IMD) (2015).[footnote 7] Ethnic group was allocated using the NHS ethnicity coding scheme.[footnote 8] Numbers of children in many of these detailed ethnic groups are small so they were aggregated to the summary ethnic groups shown in Table 1 for analysis purposes.
Table 1. Summary ethnic groups used in the analysis
| NHS ethnicity code | Summary ethnic group |
|---|---|
| A - British | White |
| B - Irish | White |
| C - Any other White background | White |
| H - Indian | Asian |
| J - Pakistani | Asian |
| K - Bangladeshi | Asian |
| L - Any other Asian background | Asian |
| F - White and Asian | Asian |
| M - Caribbean | Black |
| N - African | Black |
| D - White and Black Caribbean | Black |
| E - White and Black African | Black |
| P - Any other Black background | Black |
| R - Chinese | Other |
| G - Any other mixed background | Other |
| S - Any other ethnic group | Other |
| Z - Not stated | Not stated or unknown |
| Missing | Not stated or unknown |
Method
Separate multivariable logistic regression models were built for each sex and year group measured by NCMP: Year 6 boys, Year 6 girls, Reception boys, and Reception girls. A binary obesity variable (yes/no) was used as the dependent variable in all models. Two sets of explanatory variables were considered from those available in NCMP data which are known to influence child weight status.[footnote 9] [footnote 10] The first set of explanatory variables includes pupil age in months, quarter of measurement (in the academic year), national deprivation quintile, summary ethnicity, government office region, and the urban or rural status of the lower super output area (LSOA) of the child residence. The second set of explanatory variables includes, in addition, child height. Deprivation and ethnicity were modelled with an interaction term to accommodate possible differences in the socioeconomic gradient of obesity between ethnic groups.
Height was included in the second set of models in order to remove the residual correlation between height and obesity that tends to be associated with measures of BMI in children. Although height can itself be correlated with body fat[footnote 11] it may also reflect pubertal status or other differences between ethnic groups. For example Black African and Black Caribbean children have been found to be on average taller, and South Asians shorter, than White children.[footnote 12]
All models were fitted in R.[footnote 13] The R emmeans package[footnote 14] was used to obtain the marginal predicted probability of obesity by deprivation and ethnicity from each of the fitted models, averaging over the other model variables. The ethnic disparity in obesity was calculated as the contrast (difference) between the predicted probability of obesity in each deprivation quintile and each summary ethnic group compared to White British, with 95% confidence intervals. An adjustment was made to the width of the confidence intervals using the Dunnett method to reflect multiple significance testing.
Results and interpretation
Table 2 gives the number of children in each of the variable categories.
Table 2. Number of children by category in study data
| Variable | Category | All children | Year 6 girls | Year 6 boys | Reception girls | Reception boys |
|---|---|---|---|---|---|---|
| Ethnicity | White | 754,178 | 171,659 | 179,675 | 196,869 | 205,975 |
| Asian | 123,209 | 28,002 | 29,369 | 32,424 | 33,414 | |
| Black | 76,384 | 18,604 | 18,809 | 19,150 | 19,821 | |
| Other | 50,290 | 10,820 | 11,409 | 13,557 | 14,504 | |
| Not stated or unknown | 179,310 | 42,729 | 44,227 | 45,347 | 47,007 | |
| Deprivation quintile | 1 - most deprived | 306,826 | 70,510 | 72,365 | 80,434 | 83,517 |
| 2 | 248,298 | 56,391 | 58,477 | 65,136 | 68,294 | |
| 3 | 215,874 | 49,081 | 51,715 | 56,304 | 58,774 | |
| 4 | 204,833 | 47,065 | 49,329 | 53,161 | 55,278 | |
| 5 - least deprived | 207,540 | 48,767 | 51,603 | 52,312 | 54,858 | |
| Obese | No | 1,012,013 | 222,550 | 221,797 | 279,071 | 288,595 |
| Yes | 171,358 | 49,264 | 61,692 | 28,276 | 32,126 | |
| Quarter of measurement | September to November | 393,632 | 125,580 | 130,005 | 67,854 | 70,193 |
| December to February | 369,401 | 70,957 | 74,719 | 109,413 | 114,312 | |
| March to May | 339,830 | 61,462 | 64,103 | 104,811 | 109,454 | |
| June to August | 80,508 | 13,815 | 14,662 | 25,269 | 26,762 | |
| Settlement type | Urban | 988,616 | 225,590 | 235,116 | 258,307 | 269,603 |
| Town | 97,292 | 22,753 | 23,876 | 24,720 | 25,943 | |
| Village | 97,463 | 23,471 | 24,497 | 24,320 | 25,175 | |
| Region | South East | 187,518 | 42,615 | 44,354 | 49,236 | 51,313 |
| North East | 56,958 | 13,521 | 13,879 | 14,469 | 15,089 | |
| North West | 161,440 | 37,429 | 39,353 | 41,619 | 43,039 | |
| Yorkshire and The Humber | 120,904 | 27,947 | 29,089 | 31,355 | 32,513 | |
| East Midlands | 99,757 | 23,192 | 24,247 | 25,574 | 26,744 | |
| West Midlands | 132,177 | 30,742 | 31,515 | 34,098 | 35,822 | |
| East | 132,805 | 29,949 | 31,673 | 34,847 | 36,336 | |
| London | 184,878 | 42,425 | 43,849 | 48,301 | 50,303 | |
| South West | 106,934 | 23,994 | 25,530 | 27,848 | 29,562 | |
| Total | 1,183,371 | 271,814 | 283,489 | 307,347 | 320,721 |
Source: National Child Measurement Programme 2016 to 2017, children with valid height, weight, BMI and home postcode
Predicted ethnic disparities in obesity calculated using each of the eight regression models are given in tables and charts below. As noted the ethnic disparity in obesity compares to White British children in the same deprivation quintile and is highlighted in the tables. A positive value for the disparity indicates that children in the given ethnic group and deprivation quintile have, on average, a higher prevalence of obesity than corresponding White British children. A negative value for the disparity indicates that children in the given ethnic group and deprivation quintile have, on average, a lower prevalence of obesity than corresponding White British children.
Main findings
Ethnicity has an independent effect on obesity prevalence in both Year 6 and Reception boys and girls after pupil age in months, quarter of measurement, national deprivation quintile, height, government office region, and the urban/rural status of the LSOA of the child residence are taken into account.
Ethnic disparities in obesity prevalence are in general greater in Year 6 than in Reception, and there are smaller disparities between the sexes in Reception than in Year 6.
Including height in the models reduces the disparity in predicted obesity prevalence for Black children compared to White children, but has little effect for Asian children.
Controlling for height suggests that previous findings showing that children from Black backgrounds are more likely to be obese[footnote 3] are to some extent due to physical characteristics related to ethnicity, in particular height.
Year 6 Black boys in the most deprived quintile have a predicted obesity prevalence that is on average 2.6 percentage points lower than equivalent White boys after adjustment for other factors including height. In models excluding height Year 6 Black boys in the most deprived quintile have a predicted obesity prevalence that is on average 3.3 percentage points higher than equivalent White boys after adjustment for other factors.
Year 6 Asian boys in the most deprived quintile have a predicted obesity prevalence that is on average 5.2 percentage points higher than equivalent White boys after adjustment for other factors including height. In models excluding height Year 6 Asian boys in the most deprived quintile have a predicted obesity prevalence that is on average 5.5 percentage points higher than equivalent White boys after adjustment for other factors
Year 6 Asian girls in the most deprived quintile have a predicted obesity prevalence that is on average 0.5 percentage points lower than equivalent White girls after adjustment for other factors including height. In models excluding height Year 6 Asian girls in the most deprived quintile have a predicted obesity prevalence that is on average 0.2 percentage points lower than equivalent White girls after adjustment for other factors.
The disparity in predicted obesity prevalence for Year 6 Asian girls compared to equivalent White girls is on average less than ±1% across deprivation quintiles and models. This is considerably smaller than the predicted disparity for Year 6 Asian boys compared to equivalent White boys.
The disparity in predicted obesity prevalence for Year 6 Black girls compared to equivalent White girls is greater than the predicted disparity in obesity prevalence for Year 6 Black boys compared to equivalent White boys. This is the opposite of the pattern seen in Asian children.
Year 6 Black girls in the most deprived quintile have a predicted obesity prevalence that is on average 0.2 percentage points higher than equivalent White girls after adjustment for other factors including height. In models excluding height Year 6 Black girls in the most deprived quintile have a predicted obesity prevalence that is on average 7.0 percentage points higher than equivalent White girls after adjustment for other factors.
For Black children, the adjusted disparities in obesity prevalence tend to increase with decreasing deprivation, despite overall obesity prevalence declining as deprivation declines, it does not decline as rapidly in Black children as White children. There is no clear pattern in disparity by deprivation decile in Asian children.
Limitations and recommendation for future research
As the data used comprised only one year of NCMP, the number of children from Asian and Black ethnic groups was not large enough to allow analysis by detailed ethnic group. The summary ethnic groups considered here, therefore, each includes a number of constituent groups which may have different sociodemographic and physical characteristics. This is also the case for the other groups included, for example, children from the Chinese ethnic group were included in ‘Other’.
BMI acts as a proxy for lean and fat mass but does not reflect body composition or fat distribution. Inter-ethnic differences in body composition are a confounding factor in comparing obesity levels between ethnic groups: BMI has been found to underestimate body fat in South Asian children and over-estimate body fat in Black African children.[footnote 15] Nevertheless, BMI is non-invasive, quick, easy, cost-effective and very useful as a population measure, such as in the NCMP. It provides consistency in child weight status measurement over time, enabling reliable monitoring of trends and remains the most commonly used, widely accepted, and practical measure of obesity in both children and adults.[footnote 16]
Further work is required to identify ethnic disparities in obesity using more specific ethnic groups than was possible here, potentially combining more years of NCMP data. It would also be informative to examine ethnic disparities in other weight categories such as severe obesity or overweight including obese.
Results tables and charts for models not including height
Year 6 boys
Table 3. Adjusted difference in obesity prevalence by ethnicity and deprivation quintile: Year 6 boys
| Reference ethnicity | Reference IMD quintile | Contrast ethnicity | Contrast IMD quintile | Adjusted prevalence of obesity of reference ethnicity and IMD | Absolute disparity in adjusted prevalence of obesity of contrast ethnicity and IMD | Disparity lower 95% confidence limit | Disparity upper 95% confidence limit |
|---|---|---|---|---|---|---|---|
| White | 1 | Asian | 1 | 24.7% | 5.5% | 4.3% | 6.8% |
| White | 1 | Black | 1 | 24.7% | 3.3% | 1.9% | 4.6% |
| White | 1 | Other | 1 | 24.7% | 3.5% | 1.6% | 5.4% |
| White | 1 | Not stated or unknown | 1 | 24.7% | 1.8% | 0.7% | 2.9% |
| White | 2 | Asian | 2 | 22.1% | 6.8% | 5.4% | 8.3% |
| White | 2 | Black | 2 | 22.1% | 5.5% | 3.9% | 7.2% |
| White | 2 | Other | 2 | 22.1% | 6.4% | 4.3% | 8.5% |
| White | 2 | Not stated or unknown | 2 | 22.1% | 1.2% | 0.0% | 2.5% |
| White | 3 | Asian | 3 | 19.2% | 6.9% | 5.3% | 8.7% |
| White | 3 | Black | 3 | 19.2% | 4.3% | 2.2% | 6.6% |
| White | 3 | Other | 3 | 19.2% | 4.5% | 2.2% | 7.0% |
| White | 3 | Not stated or unknown | 3 | 19.2% | 1.5% | 0.3% | 2.8% |
| White | 4 | Asian | 4 | 16.5% | 5.7% | 3.8% | 7.7% |
| White | 4 | Black | 4 | 16.5% | 6.6% | 3.9% | 9.4% |
| White | 4 | Other | 4 | 16.5% | 2.9% | 0.5% | 5.5% |
| White | 4 | Not stated or unknown | 4 | 16.5% | 1.2% | 0.0% | 2.4% |
| White | 5 | Asian | 5 | 13.1% | 5.6% | 3.7% | 7.6% |
| White | 5 | Black | 5 | 13.1% | 8.0% | 5.0% | 11.5% |
| White | 5 | Other | 5 | 13.1% | 4.1% | 1.7% | 6.8% |
| White | 5 | Not stated or unknown | 5 | 13.1% | 0.1% | -0.9% | 1.2% |
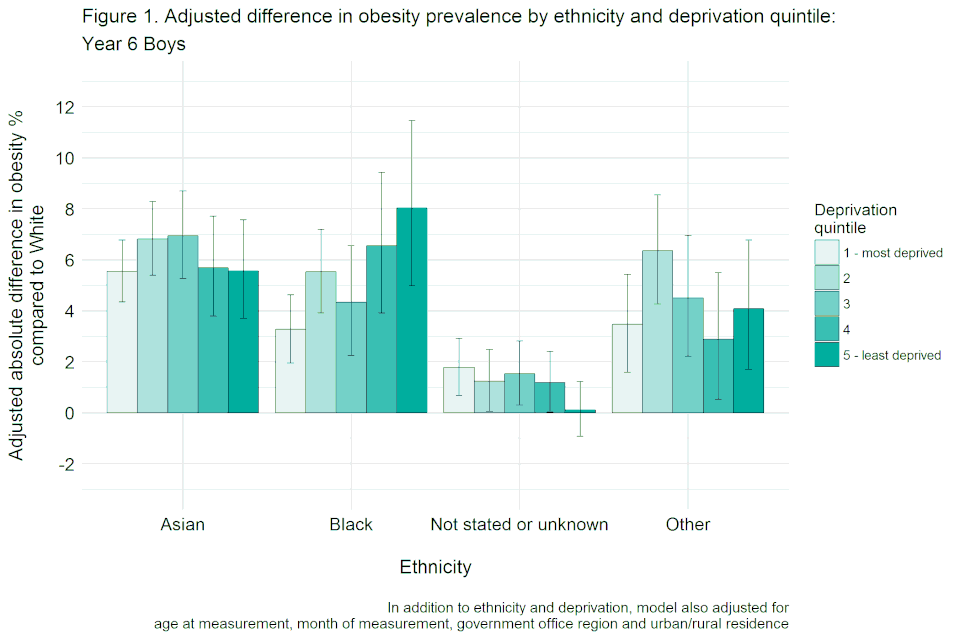
Bar chart with confidence interval error bars showing the adjusted difference in obesity prevalence by ethnicity and deprivation quintile for year 6 boys, not adjusted for height.
Year 6 girls
Table 4. Adjusted difference in obesity prevalence by ethnicity and deprivation quintile: Year 6 girls
| Reference ethnicity | Reference IMD quintile | Contrast ethnicity | Contrast IMD quintile | Adjusted prevalence of obesity of reference ethnicity and IMD | Absolute disparity in adjusted prevalence of obesity of contrast ethnicity and IMD | Disparity lower 95% confidence limit | Disparity upper 95% confidence limit |
|---|---|---|---|---|---|---|---|
| White | 1 | Asian | 1 | 21.6% | -0.2% | -1.2% | 0.9% |
| White | 1 | Black | 1 | 21.6% | 7.0% | 5.7% | 8.5% |
| White | 1 | Other | 1 | 21.6% | -0.1% | -1.9% | 1.8% |
| White | 1 | Not stated or unknown | 1 | 21.6% | 0.3% | -0.7% | 1.4% |
| White | 2 | Asian | 2 | 18.7% | 0.2% | -1.0% | 1.5% |
| White | 2 | Black | 2 | 18.7% | 8.8% | 7.2% | 10.5% |
| White | 2 | Other | 2 | 18.7% | 0.2% | -1.6% | 2.1% |
| White | 2 | Not stated or unknown | 2 | 18.7% | 1.2% | 0.0% | 2.4% |
| White | 3 | Asian | 3 | 16.5% | 1.3% | -0.2% | 2.9% |
| White | 3 | Black | 3 | 16.5% | 11.1% | 8.8% | 13.5% |
| White | 3 | Other | 3 | 16.5% | 1.5% | -0.6% | 3.9% |
| White | 3 | Not stated or unknown | 3 | 16.5% | -0.3% | -1.4% | 0.9% |
| White | 4 | Asian | 4 | 13.5% | 0.5% | -1.0% | 2.3% |
| White | 4 | Black | 4 | 13.5% | 8.6% | 6.0% | 11.4% |
| White | 4 | Other | 4 | 13.5% | -0.7% | -2.7% | 1.5% |
| White | 4 | Not stated or unknown | 4 | 13.5% | 0.9% | -0.2% | 2.1% |
| White | 5 | Asian | 5 | 10.7% | 0.8% | -0.7% | 2.5% |
| White | 5 | Black | 5 | 10.7% | 10.3% | 7.1% | 13.8% |
| White | 5 | Other | 5 | 10.7% | -1.3% | -3.0% | 0.8% |
| White | 5 | Not stated or unknown | 5 | 10.7% | 1.0% | 0.0% | 2.1% |
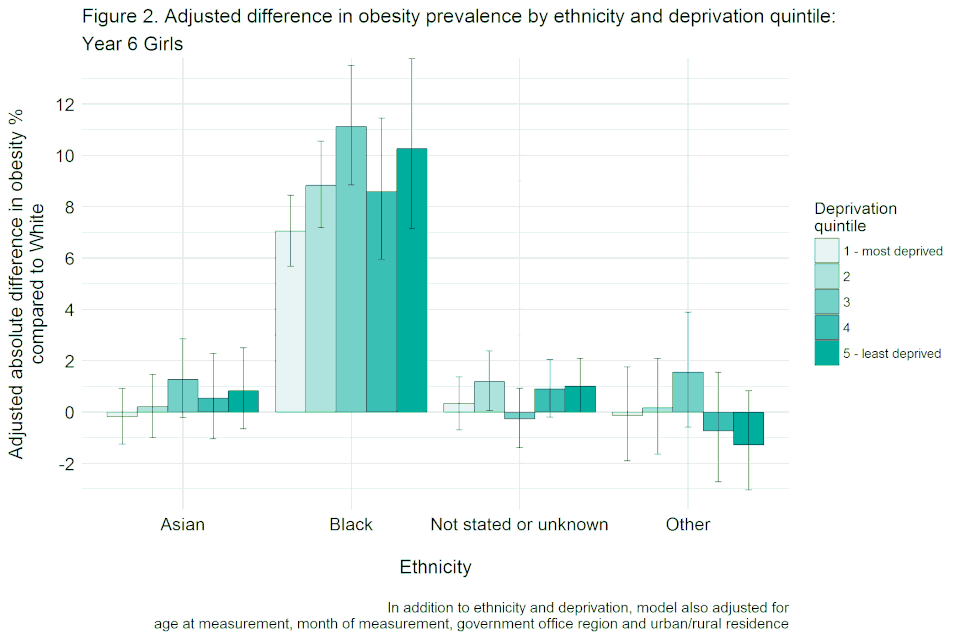
Bar chart with confidence interval error bars showing the adjusted difference in obesity prevalence by ethnicity and deprivation quintile for year 6 girls, not adjusted for height.
Reception boys
Table 5. Adjusted difference in obesity prevalence by ethnicity and deprivation quintile: Reception boys
| Reference ethnicity | Reference IMD quintile | Contrast ethnicity | Contrast IMD quintile | Adjusted prevalence of obesity of reference ethnicity and IMD | Absolute disparity in adjusted prevalence of obesity of contrast ethnicity and IMD | Disparity lower 95% confidence limit | Disparity upper 95% confidence limit |
|---|---|---|---|---|---|---|---|
| White | 1 | Asian | 1 | 12.7% | -1.1% | -1.8% | -0.3% |
| White | 1 | Black | 1 | 12.7% | 2.8% | 1.8% | 3.9% |
| White | 1 | Other | 1 | 12.7% | -0.1% | -1.3% | 1.2% |
| White | 1 | Not stated or unknown | 1 | 12.7% | 0.3% | -0.5% | 1.1% |
| White | 2 | Asian | 2 | 10.6% | 0.5% | -0.4% | 1.4% |
| White | 2 | Black | 2 | 10.6% | 3.0% | 1.8% | 4.3% |
| White | 2 | Other | 2 | 10.6% | 0.5% | -0.8% | 1.9% |
| White | 2 | Not stated or unknown | 2 | 10.6% | 0.9% | 0.1% | 1.8% |
| White | 3 | Asian | 3 | 9.2% | 0.3% | -0.7% | 1.4% |
| White | 3 | Black | 3 | 9.2% | 5.8% | 4.0% | 7.7% |
| White | 3 | Other | 3 | 9.2% | 0.0% | -1.4% | 1.6% |
| White | 3 | Not stated or unknown | 3 | 9.2% | 0.5% | -0.4% | 1.4% |
| White | 4 | Asian | 4 | 7.8% | 0.6% | -0.5% | 1.9% |
| White | 4 | Black | 4 | 7.8% | 4.6% | 2.7% | 6.8% |
| White | 4 | Other | 4 | 7.8% | 1.0% | -0.5% | 2.9% |
| White | 4 | Not stated or unknown | 4 | 7.8% | 0.5% | -0.3% | 1.4% |
| White | 5 | Asian | 5 | 6.5% | -0.4% | -1.4% | 0.8% |
| White | 5 | Black | 5 | 6.5% | 4.2% | 2.1% | 6.8% |
| White | 5 | Other | 5 | 6.5% | 0.1% | -1.3% | 1.8% |
| White | 5 | Not stated or unknown | 5 | 6.5% | 0.6% | -0.2% | 1.4% |
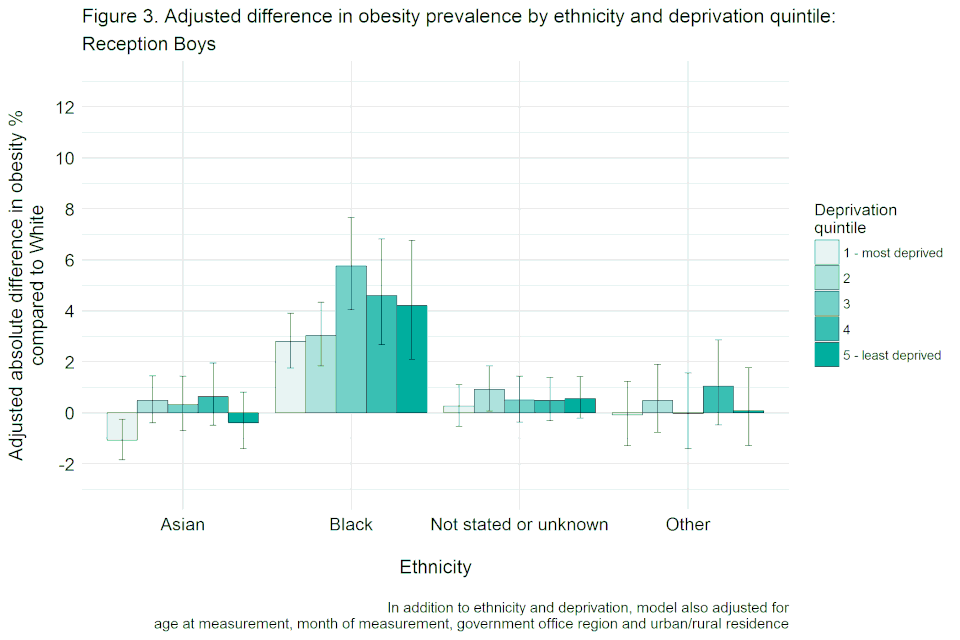
Bar chart with confidence interval error bars showing the adjusted difference in obesity prevalence by ethnicity and deprivation quintile for reception boys, not adjusted for height.
Reception girls
Table 6. Adjusted difference in obesity prevalence by ethnicity and deprivation quintile: Reception girls
| Reference ethnicity | Reference IMD quintile | Contrast ethnicity | Contrast IMD quintile | Adjusted prevalence of obesity of reference ethnicity and IMD | Absolute disparity in adjusted prevalence of obesity of contrast ethnicity and IMD | Disparity lower 95% confidence limit | Disparity upper 95% confidence limit |
|---|---|---|---|---|---|---|---|
| White | 1 | Asian | 1 | 11.5% | -1.2% | -1.9% | -0.4% |
| White | 1 | Black | 1 | 11.5% | 3.1% | 2.1% | 4.2% |
| White | 1 | Other | 1 | 11.5% | -1.1% | -2.2% | 0.2% |
| White | 1 | Not stated or unknown | 1 | 11.5% | 0.5% | -0.3% | 1.3% |
| White | 2 | Asian | 2 | 10.0% | -0.7% | -1.5% | 0.2% |
| White | 2 | Black | 2 | 10.0% | 4.9% | 3.6% | 6.3% |
| White | 2 | Other | 2 | 10.0% | -0.2% | -1.4% | 1.2% |
| White | 2 | Not stated or unknown | 2 | 10.0% | -0.2% | -1.0% | 0.7% |
| White | 3 | Asian | 3 | 8.7% | -0.3% | -1.2% | 0.8% |
| White | 3 | Black | 3 | 8.7% | 4.0% | 2.4% | 5.8% |
| White | 3 | Other | 3 | 8.7% | 0.2% | -1.2% | 1.8% |
| White | 3 | Not stated or unknown | 3 | 8.7% | 0.2% | -0.6% | 1.1% |
| White | 4 | Asian | 4 | 7.4% | -1.7% | -2.6% | -0.6% |
| White | 4 | Black | 4 | 7.4% | 4.7% | 2.7% | 7.0% |
| White | 4 | Other | 4 | 7.4% | -0.7% | -2.1% | 1.0% |
| White | 4 | Not stated or unknown | 4 | 7.4% | 0.4% | -0.4% | 1.2% |
| White | 5 | Asian | 5 | 6.0% | -0.9% | -1.8% | 0.2% |
| White | 5 | Black | 5 | 6.0% | 5.5% | 3.2% | 8.2% |
| White | 5 | Other | 5 | 6.0% | -0.2% | -1.5% | 1.4% |
| White | 5 | Not stated or unknown | 5 | 6.0% | 0.1% | -0.7% | 0.9% |
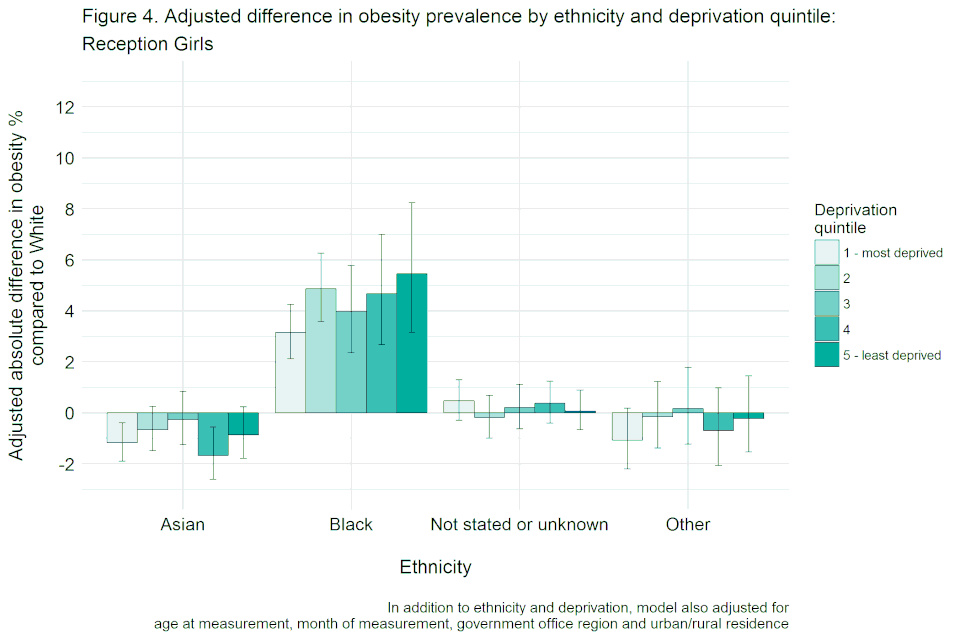
Bar chart with confidence interval error bars showing the adjusted difference in obesity prevalence by ethnicity and deprivation quintile for reception girls, not adjusted for height.
Results tables and charts for models including height
Year 6 boys
Table 7. Adjusted difference in obesity prevalence by ethnicity and deprivation quintile: Year 6 boys
| Reference ethnicity | Reference IMD quintile | Contrast ethnicity | Contrast IMD quintile | Adjusted prevalence of obesity of reference ethnicity and IMD | Absolute disparity in adjusted prevalence of obesity of contrast ethnicity and IMD | Disparity lower 95% confidence limit | Disparity upper 95% confidence limit |
|---|---|---|---|---|---|---|---|
| White | 1 | Asian | 1 | 24.3% | 5.2% | 4.0% | 6.5% |
| White | 1 | Black | 1 | 24.3% | -2.6% | -3.8% | -1.4% |
| White | 1 | Other | 1 | 24.3% | 2.5% | 0.6% | 4.5% |
| White | 1 | Not stated or unknown | 1 | 24.3% | 0.7% | -0.4% | 1.8% |
| White | 2 | Asian | 2 | 20.7% | 7.5% | 6.0% | 9.0% |
| White | 2 | Black | 2 | 20.7% | 0.4% | -1.0% | 1.8% |
| White | 2 | Other | 2 | 20.7% | 6.6% | 4.5% | 8.8% |
| White | 2 | Not stated or unknown | 2 | 20.7% | 1.0% | -0.2% | 2.3% |
| White | 3 | Asian | 3 | 17.4% | 7.3% | 5.6% | 9.1% |
| White | 3 | Black | 3 | 17.4% | 0.7% | -1.1% | 2.6% |
| White | 3 | Other | 3 | 17.4% | 4.4% | 2.1% | 6.8% |
| White | 3 | Not stated or unknown | 3 | 17.4% | 1.4% | 0.2% | 2.6% |
| White | 4 | Asian | 4 | 14.4% | 6.1% | 4.2% | 8.1% |
| White | 4 | Black | 4 | 14.4% | 3.5% | 1.2% | 6.0% |
| White | 4 | Other | 4 | 14.4% | 3.3% | 1.0% | 5.8% |
| White | 4 | Not stated or unknown | 4 | 14.4% | 1.2% | 0.1% | 2.3% |
| White | 5 | Asian | 5 | 11.0% | 5.3% | 3.6% | 7.2% |
| White | 5 | Black | 5 | 11.0% | 4.7% | 2.2% | 7.6% |
| White | 5 | Other | 5 | 11.0% | 4.6% | 2.3% | 7.2% |
| White | 5 | Not stated or unknown | 5 | 11.0% | 0.1% | -0.8% | 1.1% |
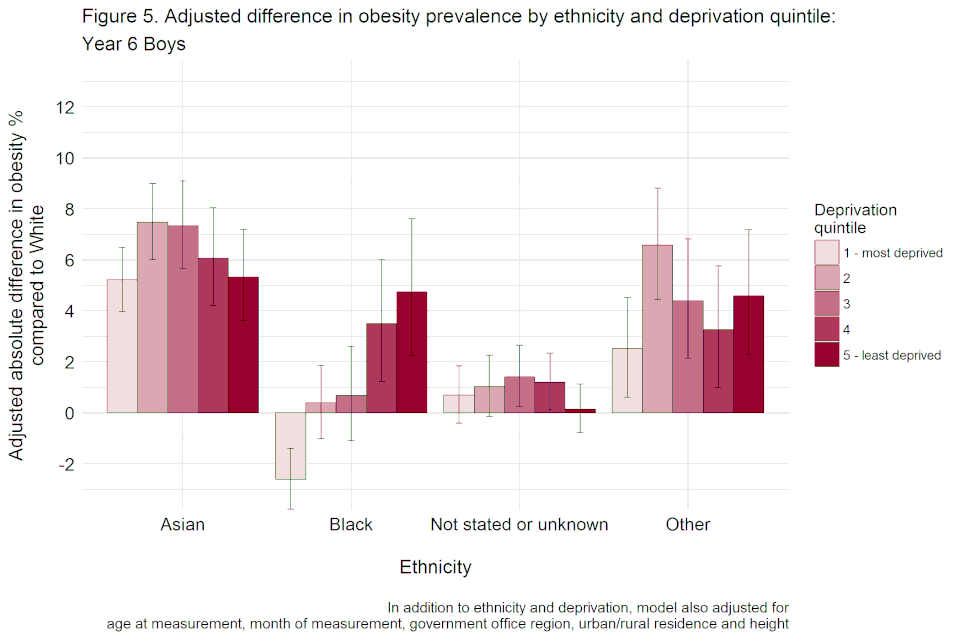
Bar chart with confidence interval error bars showing the adjusted difference, including height, in obesity prevalence by ethnicity and deprivation quintile for year 6 boys.
Year 6 girls
Table 8. Adjusted difference in obesity prevalence by ethnicity and deprivation quintile: Year 6 girls
| Reference ethnicity | Reference IMD quintile | Contrast ethnicity | Contrast IMD quintile | Adjusted prevalence of obesity of reference ethnicity and IMD | Absolute disparity in adjusted prevalence of obesity of contrast ethnicity and IMD | Disparity lower 95% confidence limit | Disparity upper 95% confidence limit |
|---|---|---|---|---|---|---|---|
| White | 1 | Asian | 1 | 21.0% | -0.5% | -1.6% | 0.6% |
| White | 1 | Black | 1 | 21.0% | 0.2% | -1.0% | 1.4% |
| White | 1 | Other | 1 | 21.0% | -1.4% | -3.1% | 0.4% |
| White | 1 | Not stated or unknown | 1 | 21.0% | -1.0% | -2.0% | 0.0% |
| White | 2 | Asian | 2 | 17.6% | 0.5% | -0.7% | 1.7% |
| White | 2 | Black | 2 | 17.6% | 2.8% | 1.5% | 4.3% |
| White | 2 | Other | 2 | 17.6% | -0.3% | -2.1% | 1.5% |
| White | 2 | Not stated or unknown | 2 | 17.6% | 0.4% | -0.7% | 1.6% |
| White | 3 | Asian | 3 | 15.2% | 1.3% | -0.1% | 2.8% |
| White | 3 | Black | 3 | 15.2% | 5.5% | 3.6% | 7.6% |
| White | 3 | Other | 3 | 15.2% | 1.0% | -1.0% | 3.2% |
| White | 3 | Not stated or unknown | 3 | 15.2% | -0.5% | -1.6% | 0.6% |
| White | 4 | Asian | 4 | 12.2% | 0.7% | -0.8% | 2.4% |
| White | 4 | Black | 4 | 12.2% | 4.3% | 2.2% | 6.8% |
| White | 4 | Other | 4 | 12.2% | -0.8% | -2.7% | 1.3% |
| White | 4 | Not stated or unknown | 4 | 12.2% | 0.6% | -0.4% | 1.6% |
| White | 5 | Asian | 5 | 9.5% | 0.8% | -0.6% | 2.4% |
| White | 5 | Black | 5 | 9.5% | 6.3% | 3.7% | 9.2% |
| White | 5 | Other | 5 | 9.5% | -0.9% | -2.5% | 1.1% |
| White | 5 | Not stated or unknown | 5 | 9.5% | 0.9% | -0.1% | 1.9% |
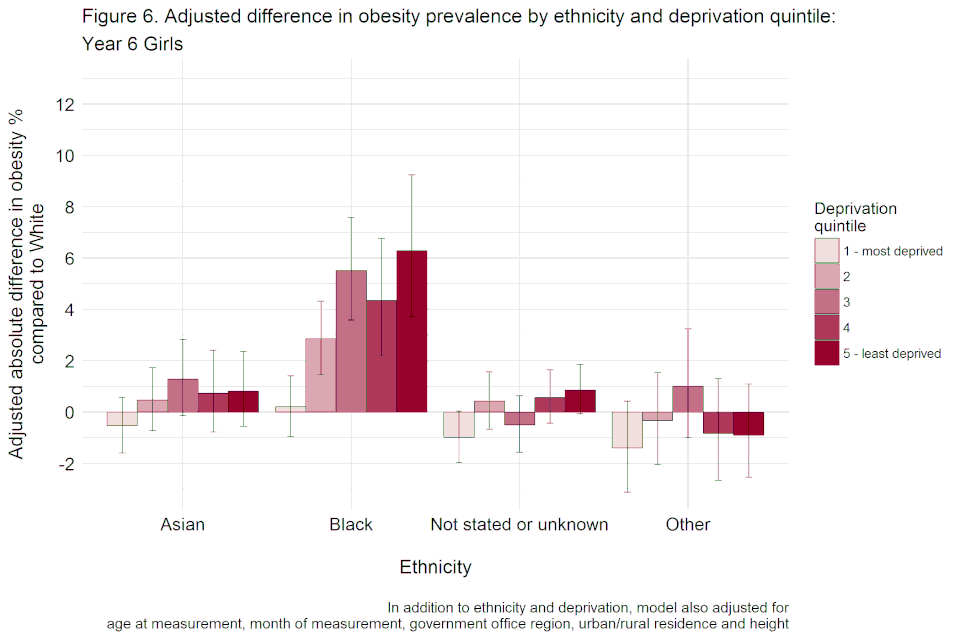
Bar chart with confidence interval error bars showing the adjusted difference, including height, in obesity prevalence by ethnicity and deprivation quintile for year 6 girls.
Reception boys
Table 9. Adjusted difference in obesity prevalence by ethnicity and deprivation quintile: Reception boys
| Reference ethnicity | Reference IMD quintile | Contrast ethnicity | Contrast IMD quintile | Adjusted prevalence of obesity of reference ethnicity and IMD | Absolute disparity in adjusted prevalence of obesity of contrast ethnicity and IMD | Disparity lower 95% confidence limit | Disparity upper 95% confidence limit |
|---|---|---|---|---|---|---|---|
| White | 1 | Asian | 1 | 12.0% | -1.8% | -2.5% | -1.1% |
| White | 1 | Black | 1 | 12.0% | -1.4% | -2.1% | -0.5% |
| White | 1 | Other | 1 | 12.0% | -0.9% | -2.0% | 0.3% |
| White | 1 | Not stated or unknown | 1 | 12.0% | -0.5% | -1.3% | 0.3% |
| White | 2 | Asian | 2 | 9.6% | 0.2% | -0.6% | 1.0% |
| White | 2 | Black | 2 | 9.6% | 0.0% | -0.9% | 1.0% |
| White | 2 | Other | 2 | 9.6% | 0.1% | -1.0% | 1.4% |
| White | 2 | Not stated or unknown | 2 | 9.6% | 0.5% | -0.3% | 1.4% |
| White | 3 | Asian | 3 | 8.1% | 0.3% | -0.7% | 1.3% |
| White | 3 | Black | 3 | 8.1% | 2.6% | 1.3% | 4.1% |
| White | 3 | Other | 3 | 8.1% | 0.2% | -1.1% | 1.6% |
| White | 3 | Not stated or unknown | 3 | 8.1% | 0.4% | -0.4% | 1.3% |
| White | 4 | Asian | 4 | 6.7% | 0.6% | -0.4% | 1.8% |
| White | 4 | Black | 4 | 6.7% | 2.0% | 0.6% | 3.7% |
| White | 4 | Other | 4 | 6.7% | 1.1% | -0.3% | 2.8% |
| White | 4 | Not stated or unknown | 4 | 6.7% | 0.4% | -0.3% | 1.2% |
| White | 5 | Asian | 5 | 5.5% | -0.2% | -1.1% | 0.9% |
| White | 5 | Black | 5 | 5.5% | 1.9% | 0.4% | 3.8% |
| White | 5 | Other | 5 | 5.5% | 0.3% | -0.9% | 1.8% |
| White | 5 | Not stated or unknown | 5 | 5.5% | 0.6% | -0.1% | 1.3% |
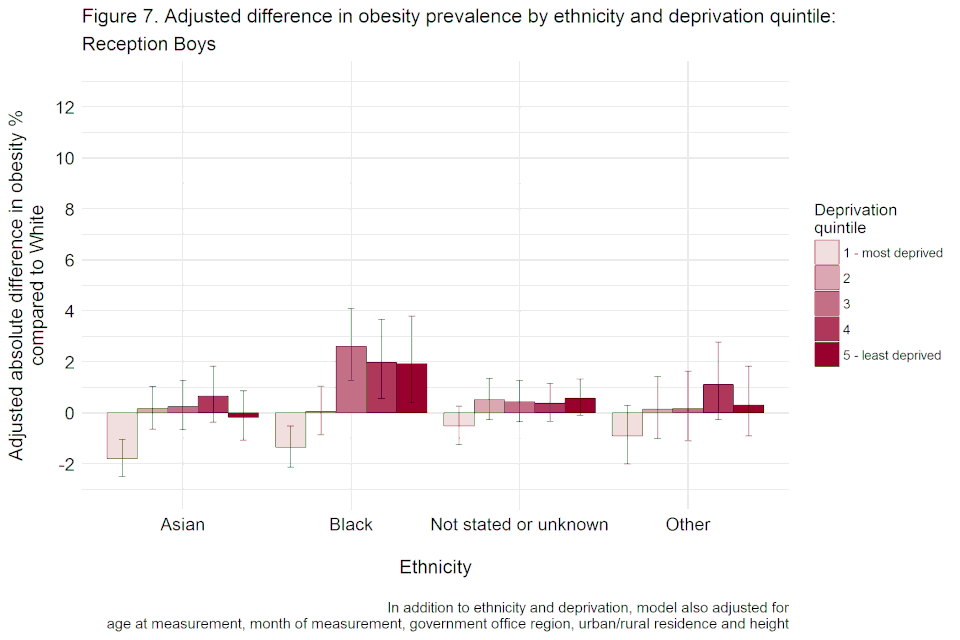
Bar chart with confidence interval error bars showing the adjusted difference, including height, in obesity prevalence by ethnicity and deprivation quintile for reception boys.
Reception girls
Table 10. Adjusted difference in obesity prevalence by ethnicity and deprivation quintile: Reception girls
| Reference ethnicity | Reference IMD quintile | Contrast ethnicity | Contrast IMD quintile | Adjusted prevalence of obesity of reference ethnicity and IMD | Absolute disparity in adjusted prevalence of obesity of contrast ethnicity and IMD | Disparity lower 95% confidence limit | Disparity upper 95% confidence limit |
|---|---|---|---|---|---|---|---|
| White | 1 | Asian | 1 | 10.5% | -1.6% | -2.3% | -0.9% |
| White | 1 | Black | 1 | 10.5% | -1.2% | -1.9% | -0.4% |
| White | 1 | Other | 1 | 10.5% | -1.9% | -2.9% | -0.8% |
| White | 1 | Not stated or unknown | 1 | 10.5% | -0.3% | -1.0% | 0.4% |
| White | 2 | Asian | 2 | 8.8% | -0.7% | -1.5% | 0.1% |
| White | 2 | Black | 2 | 8.8% | 0.6% | -0.3% | 1.5% |
| White | 2 | Other | 2 | 8.8% | -0.6% | -1.6% | 0.7% |
| White | 2 | Not stated or unknown | 2 | 8.8% | -0.6% | -1.3% | 0.2% |
| White | 3 | Asian | 3 | 7.4% | -0.1% | -1.0% | 0.9% |
| White | 3 | Black | 3 | 7.4% | 0.8% | -0.3% | 2.1% |
| White | 3 | Other | 3 | 7.4% | 0.0% | -1.2% | 1.4% |
| White | 3 | Not stated or unknown | 3 | 7.4% | 0.1% | -0.6% | 0.9% |
| White | 4 | Asian | 4 | 6.2% | -1.2% | -2.0% | -0.2% |
| White | 4 | Black | 4 | 6.2% | 1.6% | 0.3% | 3.3% |
| White | 4 | Other | 4 | 6.2% | -0.5% | -1.7% | 0.9% |
| White | 4 | Not stated or unknown | 4 | 6.2% | 0.3% | -0.4% | 1.0% |
| White | 5 | Asian | 5 | 4.9% | -0.4% | -1.2% | 0.6% |
| White | 5 | Black | 5 | 4.9% | 2.5% | 0.9% | 4.4% |
| White | 5 | Other | 5 | 4.9% | 0.2% | -1.0% | 1.7% |
| White | 5 | Not stated or unknown | 5 | 4.9% | 0.2% | -0.5% | 0.9% |
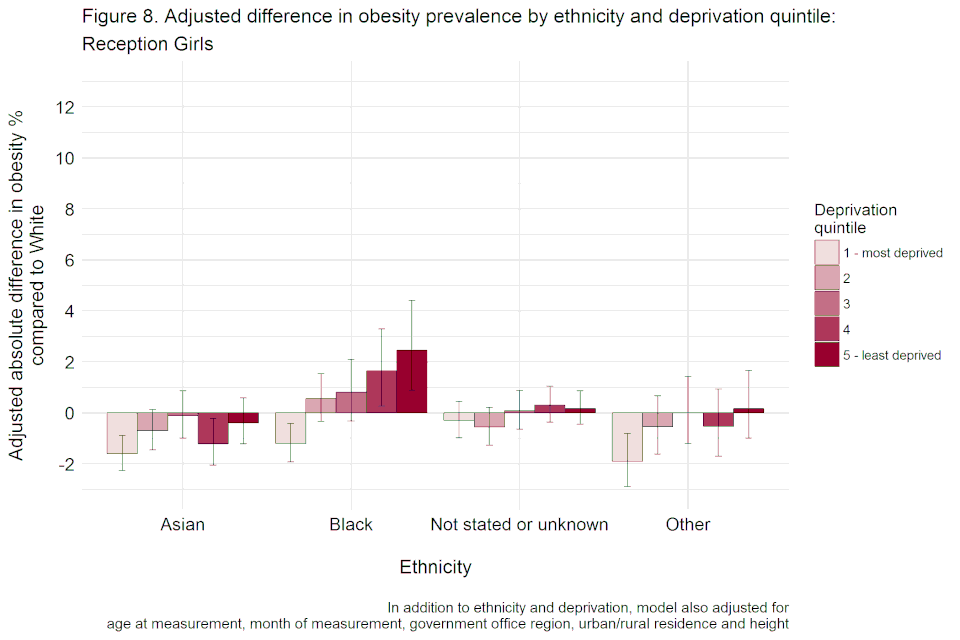
Bar chart with confidence interval error bars showing the adjusted difference, including height, in obesity prevalence by ethnicity and deprivation quintile for reception girls.
References
-
World Health Organisation ‘Childhood overweight and obesity’ ↩
-
Public Health England ‘Childhood obesity: applying All Our Health’ 2015 ↩
-
NHS Digital National Child Measurement Programme England, 2016-17: Tables 2017 ↩ ↩2
-
Copley V R and Bray C ‘Changes in children’s body mass index between 2006 to 2007 and 2015 to 2016’ National Child Measurement Programme, Public Heath England 2017 ↩
-
Public Health England NCMP and Child Obesity Profile ↩
-
Cole TJ, Freeman JV, Preece MA. ‘Body mass index reference curves for the UK, 1990’ Archives of Disease in Childhood 1995: 73, 25 to 29 ↩
-
Ridler C, Townsend N, Dinsdale H, Mulhall C, Rutter H. ‘Detailed Analysis of the 2007/08 Dataset’ National Obesity Observatory 2009 ↩
-
Dinsdale H. ‘Variation in children’s BMI by month of measurement in the 2008/09 National Child Measurement Programme dataset’ National Obesity Observatory 2010 ↩
-
Wells JCK, Cole TJ. ‘Disentangling the size and adiposity components of obesity’ International Journal Of Obesity 2011: 35, 548 ↩
-
Saxena S, Ambler G, Cole TJ, Majeed A. ‘Ethnic group differences in overweight and obese children and young people in England: cross sectional survey’ Archives of Disease in Childhood 2004: 89(1), 30 to 36 ↩
-
R Core Team. ‘A language and environment for statistical computing’ R Foundation for Statistical Computing 2017 ↩
-
Russell Lenth. ‘emmeans: Estimated Marginal Means, aka Least-Squares Means’ R package version 1.1 2018 ↩
-
Hudda MT and others. ‘Body mass index adjustments to increase the validity of body fatness assessment in UK Black African and South Asian children’ International Journal Of Obesity 2017: 41, 1,048 ↩
-
Adab P, Pallan M, Whincup PH. ‘Is BMI the best measure of obesity?’ British Medical Journal 2018: 360, k1274 ↩