Cycle City Ambition Programme Evaluation 2013-2018 (HTML)
Published 22 February 2022

© Crown copyright 2022
This publication is licensed under the terms of the Open Government Licence v3.0 except where otherwise stated. To view this licence, visit nationalarchives.gov.uk/doc/open-government-licence/version/3 or write to the Information Policy Team, The National Archives, Kew, London TW9 4DU, or email: psi@nationalarchives.gov.uk.
Where we have identified any third party copyright information you will need to obtain permission from the copyright holders concerned.
This publication is available at https://www.gov.uk/government/publications/cycle-city-ambition-programme-evaluation-2013-2018/cycle-city-ambition-programme-evaluation-2013-2018-html
1. £191M to eight English cities for cycling infrastructure:
- cycle ‘superhighways’
- city centre schemes
- mixed strategic cycle routes that combine quiet roads, paths through green space, lightly segregated paths and unsegregated cycle lanes
- improvements to canal towpaths
- and a junction treatment.
2. Methodology
- Impact evaluation of 14 schemes (~25-70% of each city’s grant).
- Control sites for each scheme: similar route and distance from city centre.
- Automatic cycle counters and manual count data to analyse: 1) Change over time in cycle counts at scheme sites 2) Change compared to control sites
- Analysed city-wide changes in how many people and what type of people cycle (Active Lives Survey).
- Surveys of cyclists on new routes asked about physical activity and health, and how long they had been cycling.
3. Findings
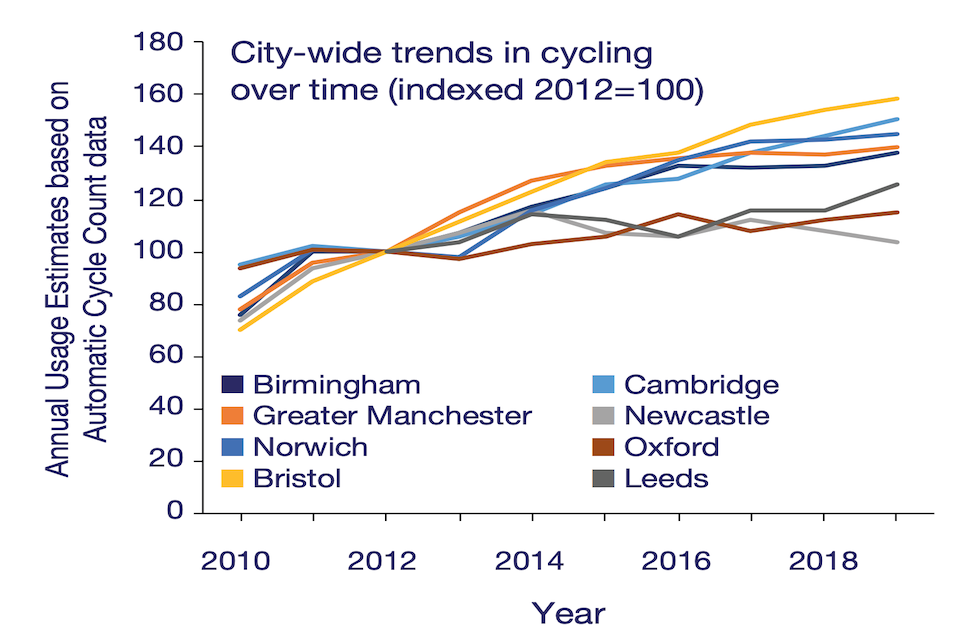
- Cycling increased in all 8 cities between 2012-2019
- Automatic cycle counters +4-79% (average 37%)
- Manual counts mostly +25-50%
-
BUT survey did not show more people cycling
- 5 schemes: increase highly likely attributable to new infrastructure. Increases mostly +14% to +40% vs control sites.
- 3 schemes: increase likely attributable to new infrastructure. Large increases (+42% to +72%) but unclear control site data.
- 3 schemes: conflicting evidence across data sources and route.
- 1 scheme: small increase, slightly less than at control site.
- Cycling levels continued to grow up to 5 years after new infrastructure was complete.
Improvements in inequalities in cycling. New cyclists more often:
- female (42% vs 33% existing cyclists)
- non-white (16% vs 7% existing cyclists)
Differences in physical activity and health:
- New cyclists less physically active than existing cyclists
- New cyclists more likely to say the new cycle scheme increased their physical activity
- New cyclists more likely to say the new cycle scheme had improved their health
Increase in cycling saved at least:
- 1 million car trips per year
-
6 million car km per year
- 1.7 kT CO2 per year
4. Impacts
- Shaping future cycling policy
- Fed into spending review bid for more cycling infrastructure
- Underpin message that cycle routes should be high quality segregated facilities
- Informing future active travel monitoring and evaluation
- Informed Transport Decarbonisation Plan
5. Links
- Final evaluation summary report
- Technical and costings reports available upon request.