Critical safety issues for walking, wheeling and cycling
Published 6 November 2025

© Crown copyright 2025
This publication is licensed under the terms of the Open Government Licence v3.0 except where otherwise stated. To view this licence, visit nationalarchives.gov.uk/doc/open-government-licence/version/3 or write to the Information Policy Team, The National Archives, Kew, London TW9 4DU, or email: psi@nationalarchives.gov.uk.
Where we have identified any third party copyright information you will need to obtain permission from the copyright holders concerned.
This publication is available at https://www.gov.uk/government/publications/critical-safety-issues-for-walking-wheeling-and-cycling/critical-safety-issues-for-walking-wheeling-and-cycling

What is a critical safety issue?
A critical safety issue is defined as a street layout or condition that is associated with an increased risk of collisions for people walking, wheeling or cycling.
Active Travel England’s route check tool identifies 16 critical safety issues for walking, wheeling and cycling.
This guidance explains each of the issues with illustrations and provides links to relevant guidance and key evidence.
You can use this guidance with the route check tool to identify and remove these risks.
This will help reduce the risks of collisions for people walking, wheeling or cycling.
The recommendation to focus on identifying and removing critical issues was introduced nationally in Local Transport Note 1/20 for cycling and regionally through approaches such as London’s Healthy Streets check and Greater Manchester’s Streets for All check.
| Metric | Mode | Critical Issue |
|---|---|---|
| Conflict at side roads and priority junctions | Walking Wheeling Cycling |
More than 2,500 vehicles per day (vpd) cut across main walking, wheeling or cycling streams. |
| Conflict at roundabouts and signal junctions | Walking Wheeling Cycling |
More than 2,500 vpd cut across main walking, wheeling or cycling streams. |
| Lane widths | Cycling | Cyclists are mixed with traffic in lanes between 3.25m and 3.90m wide. Or, cyclists are in unprotected cycle lanes, and the combined width of the cycle lane and adjacent traffic lane is between 3.25m and 3.90m. |
| Trip hazards | Walking Wheeling |
There are level differences of greater than 13mm with no tactile information and colour contrast to help identify them. |
| Kerbside activity | Cycling | Cycle facility next to parking/loading facility, without a buffer of at least 0.5m. Or, an unprotected cycle lane is next to a frequently used bus layby. |
| Provision of crossings | Walking Wheeling |
On very busy streets (more than 8,000 vpd) controlled crossings (including zebra crossings) are not present or more than 400m apart. On quieter streets (less than 8,000 vpd), desire lines are blocked by parking and loading. |
| Standard of crossings | Walking Wheeling |
On very busy streets (more than 8,000 vpd), there are uncontrolled crossings of two or more lanes with no gaps in traffic. At signal junctions, there are arms with dropped kerbs and tactile paving but no green pedestrian symbol. |
| Motor traffic speed | Walking Wheeling Cycling |
85th percentile speed is over 30mph. |
| Motor traffic volume | Walking Wheeling Cycling |
More than 1,000 vehicles in the busiest hour. Or, over 5% of traffic is HGVs where there are over 500 vehicles in the busiest hour. |
| Pedestrian crossing speed | Walking Wheeling |
Pedestrians who start crossing at the end of the ‘invitation to cross’ must cross at a speed of over 1.2 m/s to get across the whole crossing in time. |
| Footway widths | Walking Wheeling |
Where the footway is next to the carriageway, there is: - less than 1m clear footway width on any footway - less than 1.5m clear footway width for over 6m - 1m to 2m clear footway width with a pedestrian comfort level (PCL) of D-E Or there is no footway. |
| Effective width next to tram lines | Cycling | Less than 2.4m from tramline edge to kerb on a straight run. Insufficient clearance on a curve. |
| Crossing angle of train/tram rails) | Cycling | Less than 2.4m from tramline edge to kerb on a straight run. Insufficient clearance on a curve. |
|
Cycling surface and maintenance defects: - sharp gradients (12.5% or more) - non-cycle friendly ironworks - raised/sunken covers or gullies - potholes - loose/cracked surfaces - poor drainage or skid risks - overgrown vegetation |
Cycling | Major defects. |
|
Walking/wheeling surface and maintenance defects: - steep camber (horizontal gradient more than 2.5%) - steep longitudinal gradients (8% or more if under 1m, 5% or more if 1m or over) - missing dropped kerbs - non flush tables - misleading tactile information - loose/cracked surfaces - poor drainage or slip risks - overgrown vegetation |
Walking Wheeling |
Major defects. |
| Guard railing | Walking Wheeling Cycling |
Guard railing used as standard without consideration of inherent safety risks. |
1: Conflict at side roads and priority junctions
Pedestrian and cyclist conflict with motor traffic at side roads/priority junctions.
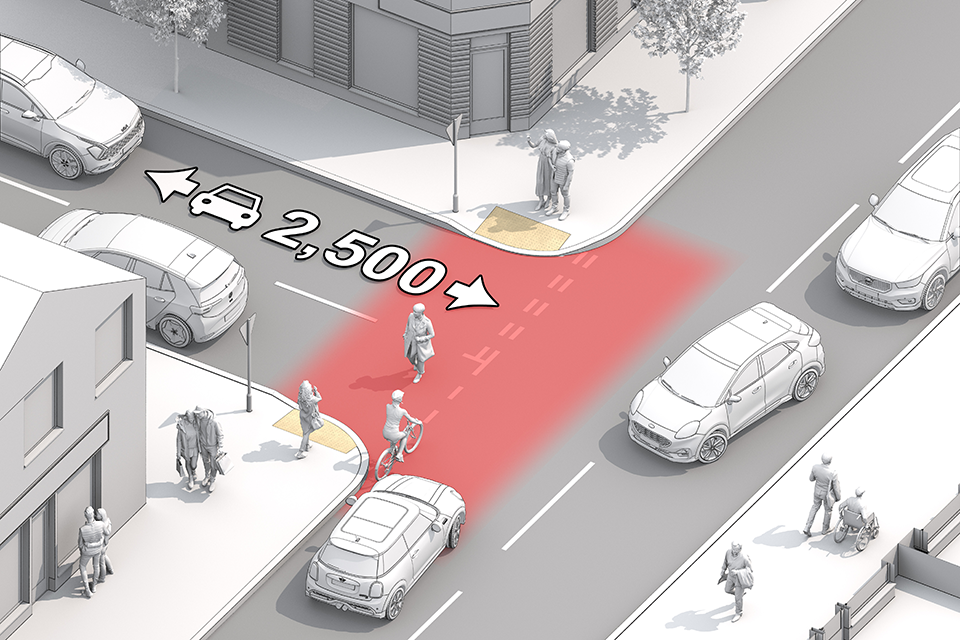
Graphic shows a street scene where motor vehicles are turning into a side road. A cyclist is continuing straight ahead and a pedestrian is crossing at the uncontrolled side road crossing.
This critical issue covers the risk of left or right hook collisions arising from conflict between motor traffic and pedestrians or cyclists at uncontrolled side roads and priority junctions.
This critical issue is considered present where more than 2,500 vpd turn across a main walking, wheeling or cycling movement at a side road or priority junction, except in cases where entry treatments provide significant protection for pedestrian and cyclist movements. Appropriate forms of entry treatment for offering significant protection will vary depending on context.
Depending on local context, there are several junction treatments aimed at reducing motor vehicle cornering speed and promoting pedestrian priority, which might be an appropriate approach to addressing the critical issue.
Physical treatments include reducing the corner radii or providing a raised continuous footway or junction table. Road markings can be used to highlight the presence of cyclists to other road users and provide legal priority over vehicles turning at junctions. Parallel crossings can also be effective.
Relevant guidance
| Guidance | Description |
|---|---|
| Cycle Infrastructure Design (LTN 1/20) | Includes side road crossing guidance for cyclists in sections 6.4.10 to 6.4.13. Section 10.5 sets out guidance relating to a range of side road junction treatments. |
| Manual for Streets | Sections 6.3.12 and 6.3.15 cover side road crossings for pedestrians. |
| Inclusive Mobility | Discusses various types of road crossings and their requirements in section 4.10. Section 4.11 provides guidance on dropped kerbs and raised crossings. |
Key evidence
Design Development of Side Road Crossings for Pedestrians and Cyclists
The study explicitly models the impact of motor traffic flows on pedestrian and cyclist safety at side road junctions.
Forced yields (where drivers do not give way) were strongly correlated with turning traffic volumes, especially right-turning vehicles into side roads.
The elasticity of forced yields with respect to right-turning flow was 0.612, meaning that an increase of 10 vehicles per 15 minutes results in 6.12 more forced yields. This implies that junctions with more than 2,500 vpd (over 60 vehicles per 15 minutes) would see a substantial number of forced yields, increasing risk for walking, wheeling, and cycling users.
Marked priority crossings with parallel zebra markings were found to be the most effective in reducing forced yields and increasing compliance with pedestrian/cyclist priority.
2: Conflict at roundabouts and signal junctions
Pedestrian and cyclist conflict with motor traffic at roundabouts and signal-controlled junctions.
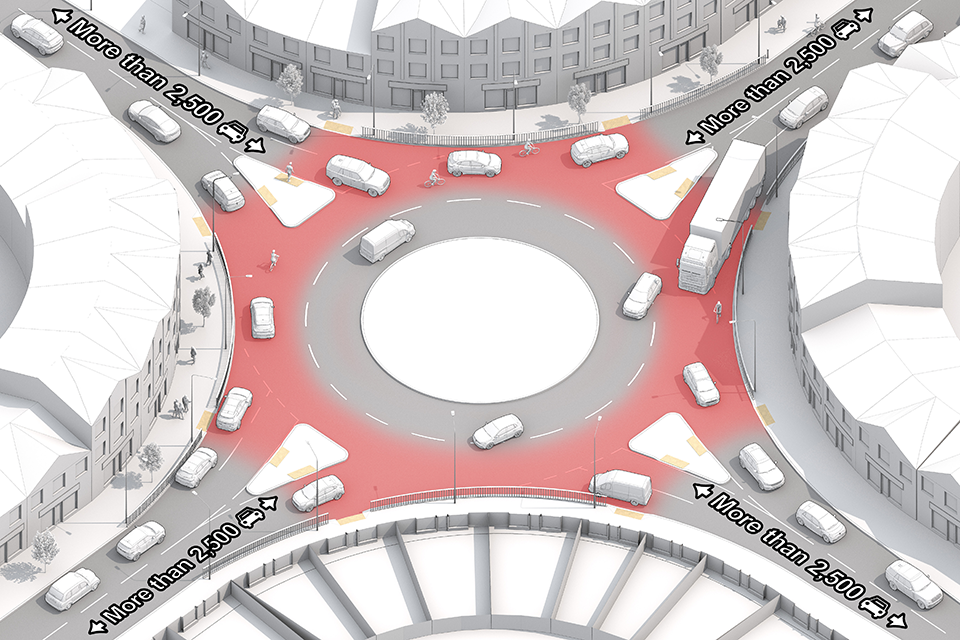
Graphic shows a roundabout where cyclists ride unprotected. Motor vehicles are turning on to and off the roundabout across the path of cyclists and pedestrians. The pedestrian crossings are not controlled.
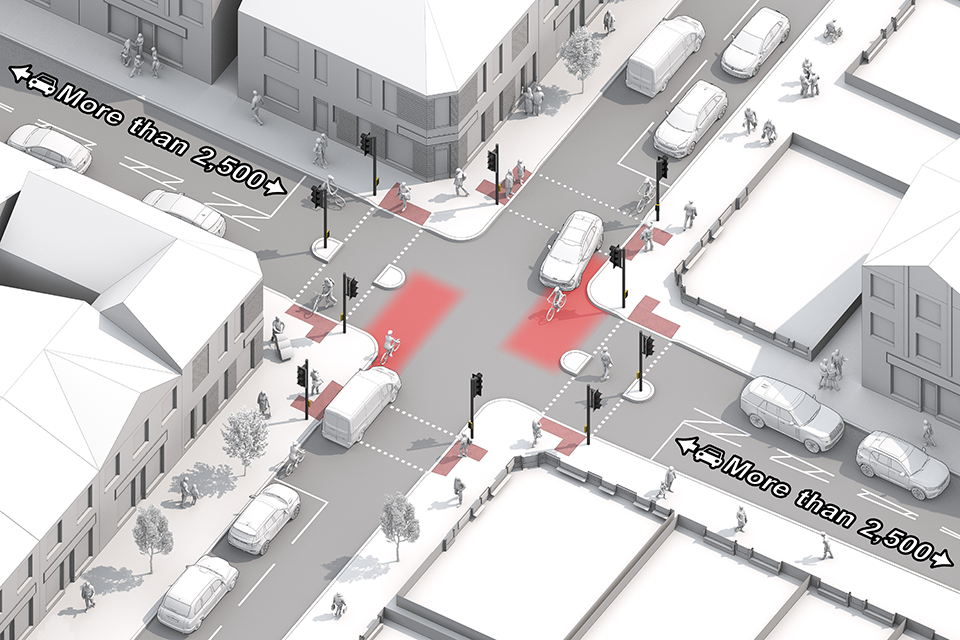
Graphic shows a signal-controlled junction where motor vehicles are turning across the path of cyclists who are not protected as they travel through the junction.
This critical issue covers the risk of collisions arising from conflict between motor traffic and pedestrians or cyclists at roundabouts and signal-controlled junctions.
This issue is present when there are more than 2,500 vpd turning across a main walking, wheeling or cycling movement.
Separating pedestrians and cyclists in time or space is the main method used to resolve this issue. Reducing turning volumes and promoting central riding positions can also help.
Relevant guidance
| Guidance | Description |
|---|---|
| ATE junction assessment tool | Evaluates all active travel movements through a junction. |
| LTN 1/20 | Provides an overview of signalised junctions and types of facilities for cycling in section 10.6. |
| Traffic signs manual | Chapter 6 gives guidance and details on provision at signalised junctions for pedestrians in part 10 and cyclists in part 11. Crossings for pedestrians and cyclists in section II are applicable at roundabout junctions. |
| Manual for Streets | Provides guidance on different types of junctions, their role in placemaking and detailed highways engineering considerations in section 7.3, and in chapter 9 of Manual for Streets 2. |
Key evidence
Cycling facility trials workstream six
Cyclists face significant risks when turning right at signalised junctions due to conflicts with left-turning vehicles.
Two-stage right turn treatments (for example, waiting areas and low-level signals) can reduce conflict but may introduce new risks if not properly designed.
Conflicts with turning vehicles are a major safety concern, especially where infrastructure does not clearly separate movements.
3: Lane widths
Effect of lane widths on conflict between cyclists and motor traffic.
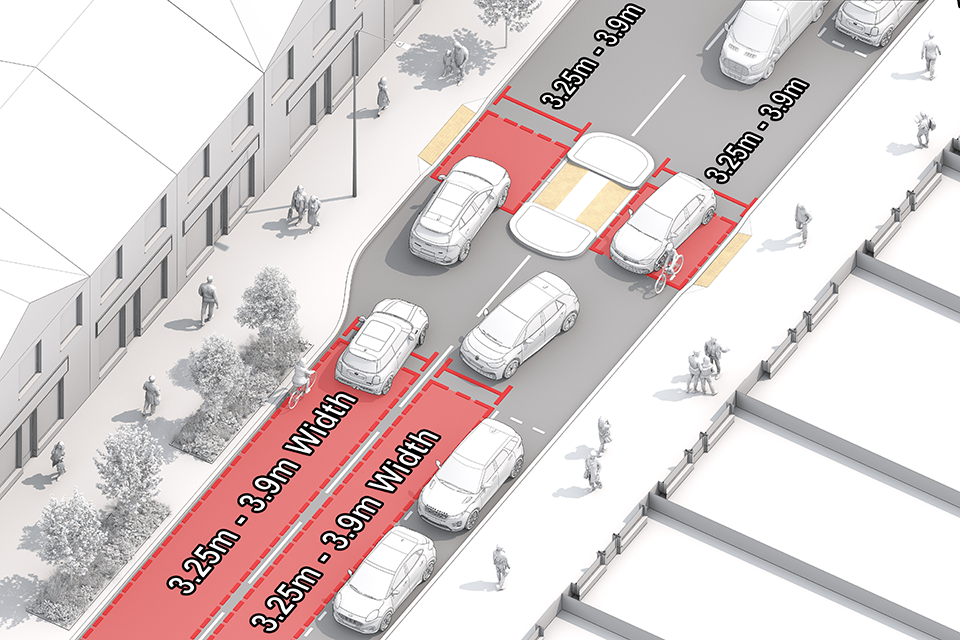
Graphic shows a street scene where a motor vehicle is attempting to overtake a cyclist in a narrow lane.
This critical issue covers the risk of collisions between motor vehicles and cyclists where cyclists are not protected from motor traffic. The particular risk covered in this critical issue is the risk of ‘shunt’ or ‘clip’ collisions, where motor vehicles come into conflict with cyclists from behind or from alongside respectively.
Traffic lanes wider than 3.9m may still not be wide enough for motor vehicles to safely overtake cyclists (where cyclists are in the secondary position, close to the kerb) as motor vehicles are supposed to pass with 1.5m clearance. However, the risk of a collision from alongside is reduced at this width and beyond.
Where traffic lanes are under 3.25m wide, it is usually clear to motorists that there is not enough space to safely overtake cyclists, and it is clearer to cyclists that they need to ride more centrally.
However, where lane widths are between 3.25m and 3.9m wide (this width may include a painted cycle lane which could be 1.2m inside a 2.5m lane, for example), motorists may try to overtake cyclists when there is not enough space, therefore increasing the risk of ‘shunt’ or ‘clip’ collisions. Where this is the case, it is a critical issue.
To resolve this issue, it is recommended that lanes between 3.25m and 3.9m are avoided. Where there are two opposing 3.65m lanes, a 3.25m lane and a 4.05m lane would resolve this issue, as would removing the centre line. This issue is commonly caused by the introduction of pedestrian refuge islands. In this case more formal crossings such as zebras or puffins may resolve the issue as they may not require the island.
Relevant guidance
| Guidance | Description |
|---|---|
| LTN 1/20 | Section 7, which provides technical advice on carriageway and lane widths where cyclists are not protected. Section 6.6 provides guidance on lane width where cyclists are not separated from buses. Table 7-2 recommends minimum lane based on traffic speed and volume. |
| Manual for Streets | Section 7.2, which provides advice on street dimensions, including carriageway widths. |
Key evidence
Cycling Injury Risk in London: Impacts of Road Characteristics and Infrastructure
This study used a case-crossover method to assess injury risk based on road characteristics. The study found that:
- advisory cycle lanes increased injury odds by 34%, suggesting that unprotected lanes within standard traffic widths are unsafe
- protected infrastructure reduced injury odds by 40 to 65%
- junctions tripled injury odds, and higher pedestrian density also increased risk
The study supports the idea that lane widths between 3.25m and 3.9m, where drivers attempt close overtakes, are particularly hazardous.
4: Trip hazards
Risk of pedestrians tripping due to hazards.
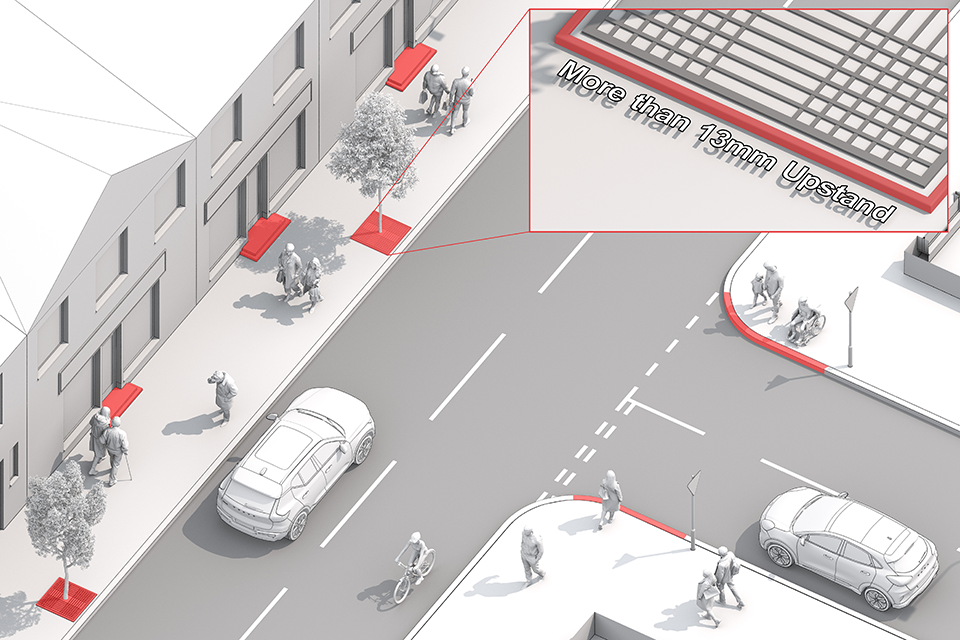
Graphic shows a street scene with potential trip hazards – the grille surrounding the base of a tree, steps for entering buildings that extend into the pavement and kerbs on the corner of a road.
This critical issue covers the risk of pedestrians tripping and falling where there are difficult to detect level differences of over 13mm in the pedestrian environment, without both colour contrast and tactile information to help identify them. This creates a trip hazard. This critical issue relates to how the pedestrian space has been designed, rather than any trip hazards arising from maintenance issues – those are covered in critical safety issue 15.
This critical issue may be resolved by providing a visual contrast or removing the level difference. In the case of steps, corduroy hazard warning tactiles would resolve the issue.
Relevant guidance
| Guidance | Description |
|---|---|
| Guidance on the Use of Tactile Paving Surfaces | Provides guidance on the use of the various tactile paving surface types. |
| Inclusive Mobility | Provides guidance relating to changes in level (Chapter 5), tactile paving surfaces (Chapter 6) and tonal and colour contrast (Chapter 4.1). |
| Seeing streets differently: How changes to our streets and vehicles are affecting the lives of blind and partially sighted people | Highlights the challenges blind and partially sighted individuals face within the street environment. Emphasises the need for inclusive design to ensure safe, independent navigation for all pedestrians. |
Key evidence
Pedestrian Slips, Trips and Falls: An Evaluation of Their Causes, Impact, Scale and Cost
The study investigates the causes and consequences of pedestrian falls, with a focus on pavement-level hazards. The study found that:
- level differences greater than 20mm – especially without visual cues like colour contrast – were identified as significant trip hazards
- cracked and uneven pavements were cited by 31% of adults aged 65+ as a reason they avoid walking more or at all on local streets
- 48% of older adults said they would walk more if pavements were better maintained
- the report highlights that poor pavement maintenance is a major deterrent to walking and wheeling, particularly for older and disabled people
- there is no systematic national data collection on pedestrian trips and falls, making it difficult to quantify the full impact
- the NHS cost burden from outdoor falls is estimated to exceed £2.3 billion per year, with over 30,000 hospital admissions annually due to such incidents
The report recommends updating the UK Road Liaison Group’s Asset Management Guidance to include health and social care costs of pedestrian falls.
This research underscores the importance of addressing level changes greater than 20mm without colour contrast as a critical safety issue for walking and wheeling users.
5: Kerbside activity
Cyclist conflict with kerbside activity, including risk of ‘dooring’.
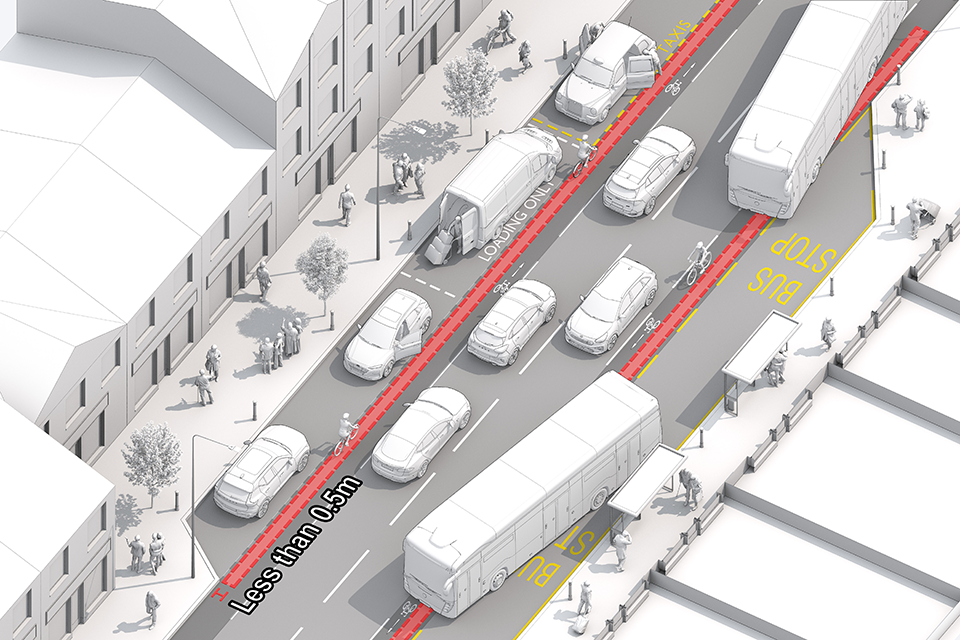
Graphic shows a street scene where activities at the kerbside pose a collision risk to cyclists – including buses moving into and out of a bus stop layby across a cycle lane, a delivery van unloading in a loading bay and the doors of a taxi in a taxi rank and a car in a parking bay opening into the cycle lane.
This critical issue covers the risk of collisions to cyclists from activities that occur at the kerbside. This includes the risk arising where a cycle facility is positioned next to a parking or loading bay without an appropriate buffer which would prevent a vehicle door being opened into the path of a cyclist, who does not have time or space to react. The critical issue also covers the risk of collisions resulting from conflict between cyclists riding in unprotected cycle lanes and buses moving into and out of bus stop laybys.
This critical issue is considered present where the cycle facility is positioned next to a parking or loading facility without a suitable minimum horizontal separation of at least 0.5m, also known as a ‘buffer’.
A bus layby is a designated area of pull-off space on the side of the road where buses can stop to pick up or drop off passengers without obstructing the flow of traffic. A frequently used bus stop is defined as a bus stop which serves 5 or more buses per hour.
This issue can be resolved by either:
- introducing buffers between the cycle lane and the parked cars, whether cyclists are routed on the outside or inside of parked cars
- removing the painted lanes so that cyclists are encouraged to ride in a more defensive position
Relevant guidance
| Guidance | Description |
|---|---|
| LTN 1/20 | Chapter 6, which provides guidance relating to horizontal separation between carriageway and cycle tracks. |
Key evidence
The study examined how different types of cycling infrastructure affect injury risk, using police data and route modelling. The study found that:
- painted cycle lanes and shared bus lanes – often placed adjacent to parked vehicles – increased injury risk compared to having no infrastructure at all
- cycle infrastructure separated from traffic was safer, but still not fully protective unless of high quality
- petrol stations and car parks, which often involve kerbside activity, were associated with elevated risk
The study highlights that infrastructure without adequate separation from kerbside activity (for example, loading or parking) can increase the likelihood of collisions, including dooring incidents.
6: Provision of crossings
Ability of pedestrians to cross the street safely on desire lines.
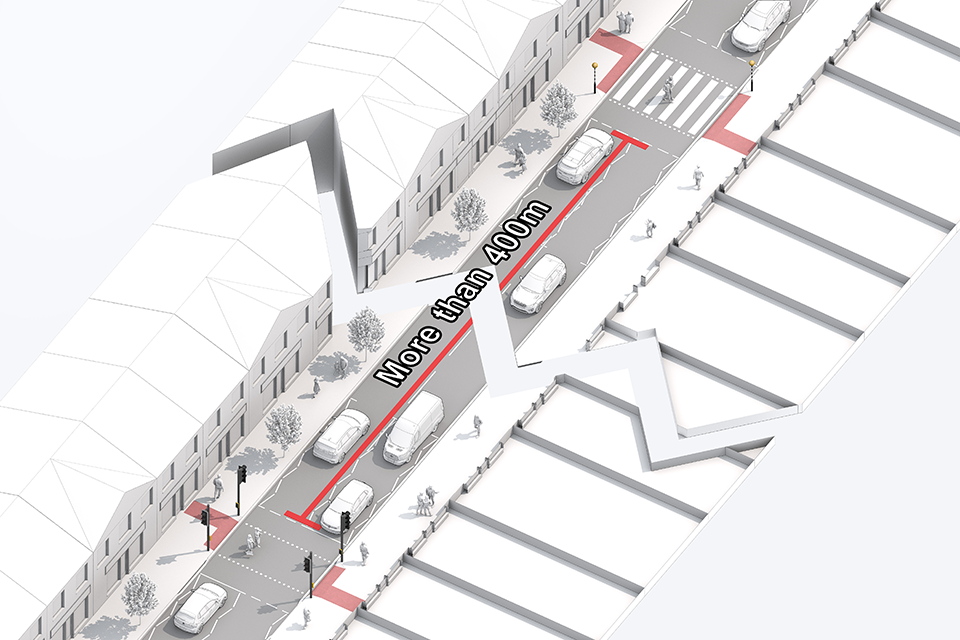
Graphic shows a street scene where there is more than 400m between a zebra crossing and a signal-controlled crossing.
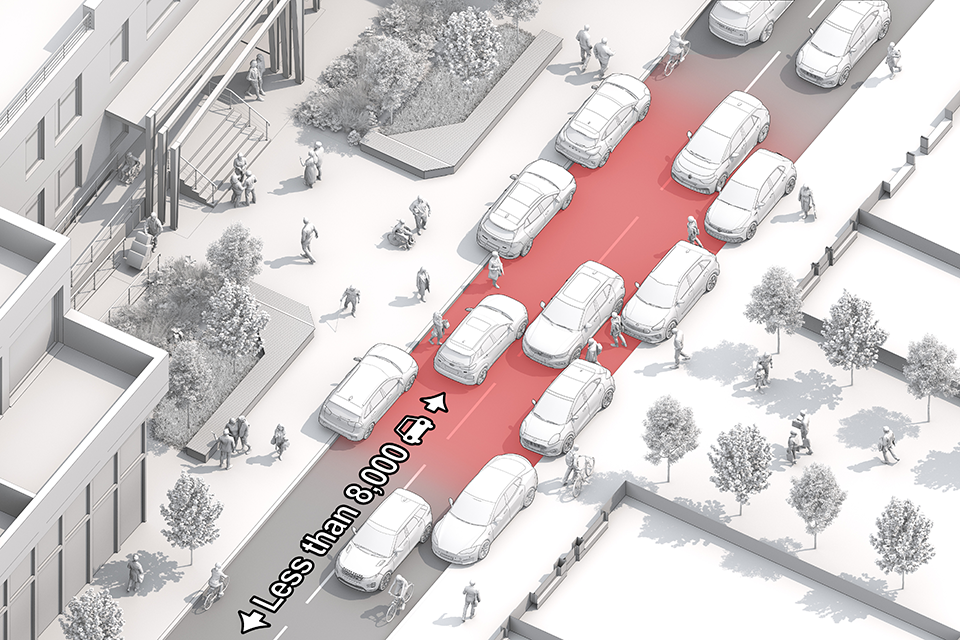
Graphic shows a street scene with motor vehicles parked along the kerb. Pedestrians are attempting to cross to a particular building across the street, but their way across is obstructed by the parked vehicles.
This critical issue covers the risk of collisions between pedestrians and motor traffic when pedestrians cross busy streets along desire lines where controlled crossing facilities are not provided. It also covers quieter streets where these desire lines are obstructed by kerbside activities such as parking, loading, or other physical features, leading to reduced visibility.
This critical condition is considered present where controlled crossings including zebra crossings are spaced more than 400m apart on very busy streets (defined as streets carrying more than 8,000 vpd). It is also considered present where pedestrian crossing desire lines are blocked by parked vehicles or other physical barriers on quieter streets (defined as streets carrying less than 8,000 vpd).
This issue is resolved by providing a controlled crossing on a busy road and ensuring that desire lines are clear of obstruction on quieter roads, and dropped crossings or raised tables with tactile paving are provided.
Relevant guidance
| Guidance | Description |
|---|---|
| ATE Crossing Selector Tool | Provides a range of suitable design options for connecting walking, wheeling and cycling routes over a ‘main’ road. |
| Manual for Streets | Section 6.3, which provides further detail on different types of crossing and where their use is appropriate. |
| Inclusive Mobility | Provides detailed information on making controlled and uncontrolled pedestrian crossing facilities accessible. |
Key evidence
Pedestrian Slips, Trips and Falls: An Evaluation of Their Causes, Impact, Scale and Cost
The report highlights how poor crossing provision and kerbside obstructions affect pedestrian safety and accessibility. This includes:
- on busy streets (more than 8,000 vpd), controlled crossings are often absent or spaced more than 400m apart, forcing pedestrians to cross at unsafe locations or take long detours
- long distances between crossings are especially problematic for older adults and disabled people, who may not be able to walk far or wait long at signals
- on quieter streets (fewer than 8,000 vpd), kerbside parking and loading frequently block desire lines, making direct crossings difficult or impossible
These barriers contribute to reduced walking activity, especially among vulnerable groups.
The report recommends that crossings be placed on desire lines, with minimal detour, and that kerbside obstructions be managed to allow safe and direct access.
This evidence supports the need for frequent, well-placed crossings on busy roads and unobstructed desire lines on quieter streets to improve safety and accessibility for walking and wheeling.
7: Standard of crossings
Suitability of pedestrian crossings in context.
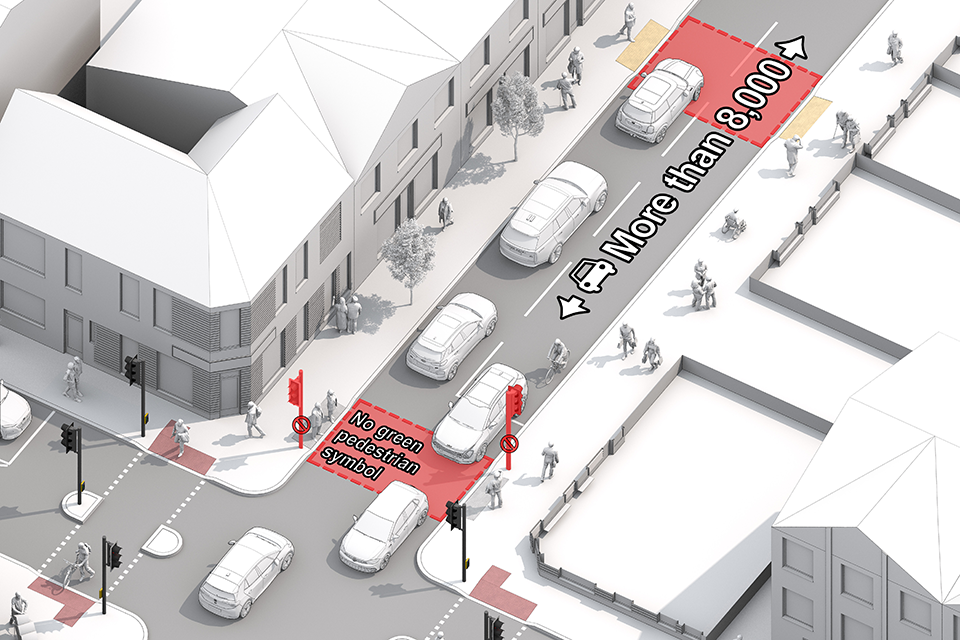
Graphic shows a busy street scene, where there is an uncontrolled crossing point and no pedestrian refuge. There is also a signal-controlled crossing but no green pedestrian signal.
This critical issue covers the risk of collisions between pedestrians and motor vehicles when crossing busy roads.
This critical issue is considered present when there are uncontrolled crossings of 2 or more adjacent lanes (including bus lanes) unbroken by a pedestrian refuge on streets with more than 8,000 vpd. It is also considered present at signal-controlled junctions or roundabouts where there are arms with dropped kerbs and tactile paving, but no dedicated signalised pedestrian crossing is provided regardless of traffic flows. Note that this includes cycle traffic as well as motor traffic.
This issue is resolved by providing a signalised pedestrian crossing. It is also considered resolved if there is a nearby signalised pedestrian crossing. In the graphic, if the signal junction had a signalised pedestrian crossing added then the uncontrolled crossing would no longer be critical.
There are other variables to consider in different contexts and so a maximum distance is not stated. Obvious desire lines should be considered. Zebra crossings may also work in some contexts even if flows are over 8,000 vpd. Zebra crossings offer continual pedestrian priority and so this may be appropriate in busy city centre environments, for example. Reducing the traffic volume so that the critical issue is no longer in place also resolves this issue on mid-link crossings.
Relevant guidance
| Guidance | Description |
|---|---|
| ATE Crossing Selector Tool | Provides a range of suitable design options for connecting walking, wheeling and cycling routes over a ‘main’ road. |
| Inclusive Mobility | Provides detailed information on making controlled and uncontrolled pedestrian crossing facilities accessible. |
| LTN 1/20 | Table 10-2, which provides information on crossing design suitability. |
| Traffic Signs Manual | Chapter 6, section II, which provides comprehensive guidance on the design and implementation of various crossing facilities. |
| Manual for Streets | Section 6.3, which provides further detail on different types of crossing and where their use is appropriate. |
Key evidence
The Effect of Traffic Signal Strategies on the Safety of Pedestrians
This study evaluates how different signal strategies affect pedestrian safety at junctions and mid-block crossings. The study found that:
- uncontrolled crossings on busy roads (especially multi-lane) are associated with higher pedestrian accident rates, particularly where no refuge islands or signal controls are present
- missing green pedestrian symbol crossings at junction arms were linked to increased pedestrian collision, even when traffic volumes were accounted for
- complex signal arrangements without clear pedestrian phases can confuse users, leading to unsafe crossing behaviour
- older adults and disabled pedestrians are disproportionately affected by poor signal provision and long waiting times
The report recommends standardising pedestrian signal provision across all arms of junctions and reducing pedestrian wait times to improve compliance and safety.
8: Motor traffic speed
85th percentile speed of motor traffic (where cyclists are not protected or pedestrians cross uncontrolled).
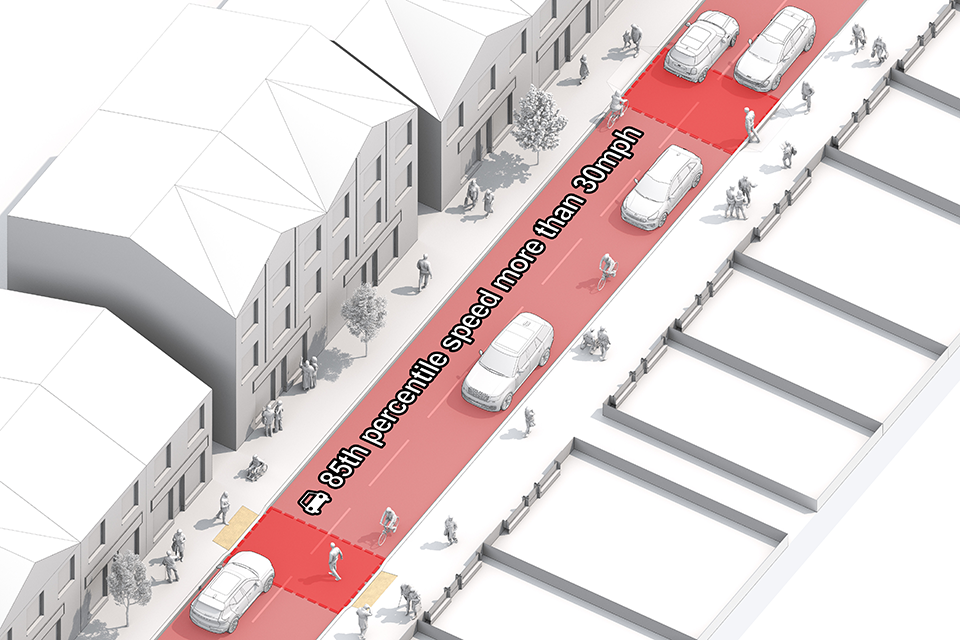
Graphic shows a street scene where 85% of motor vehicles are travelling at or above 30mph. There is no separation for cyclists. Pedestrians are attempting to cross at uncontrolled crossings.
This critical issue covers the risk of collisions between motor vehicles and pedestrians and cyclists where pedestrian movements across, and cyclist movements along, the road are not protected, and motor traffic is moving at high speeds.
This critical issue is considered present when the 85th percentile speed (the speed at or below which 85% of vehicles are travelling) of motor traffic exceeds 30mph and cyclists are not in a protected facility. It is also considered present on streets where the 85th percentile speed exceeds 30mph and pedestrians cross uncontrolled.
This issue can be resolved by reducing the speed of motor traffic or by providing controlled crossings for pedestrians and protection for cyclists.
Relevant guidance
| Guidance | Description |
|---|---|
| LTN 1/20 | Figure 4.1, which describes the appropriate level of protection for cyclists in relation to motor traffic speed and volume. |
| Manual for Streets | 1 and 2, which provide guidance on crossing placement. |
Key evidence
Infrastructure and Cyclist Safety
This literature review explores how infrastructure affects cyclist safety, with a focus on motor traffic speed. The review found that:
- speed reduction is identified as the most effective intervention for improving cyclist safety
- unprotected cyclists are at greater risk on roads with higher motor traffic speeds, especially where no physical separation exists
- the review supports the use of traffic calming, urban design, and 20mph zones to reduce risk
- 85th percentile speeds are not directly cited, but the implication is that speeds above 30mph significantly increase danger for cyclists
Setting Local Speed Limits – DfT Circular 01/2013 (updated 2024)
This guidance outlines how local authorities should assess and set speed limits. It includes that:
- risk of pedestrian death increases sharply above 30mph
- for every 1mph reduction in average speed, collision frequency drops by approximately 5%
- speed limits should be evidence led, and roads should be designed to prevent serious injury even when mistakes occur
The guidance supports lower speed limits in areas with vulnerable road users, especially where crossings are uncontrolled.
Impact of Speed on Pedestrian Deaths and Injuries
This article synthesises research on pedestrian injury risk at different speeds. It includes that:
- at 30mph, the chance of serious injury is 48%
- at 15mph, it drops to 8% – a 6-fold reduction
- the area of risk in front of a vehicle increases dramatically with speed, making uncontrolled crossings far more dangerous at 85th percentile speeds greater than 30mph
None of the sources explicitly use the 85th percentile greater than 30mph as a design threshold, but all confirm that speeds above 30mph pose a significant safety risk to unprotected cyclists and pedestrians at uncontrolled crossings.
9: Motor traffic volume
Volume of motor traffic at the busiest hour (where cyclists are not protected or pedestrians cross uncontrolled).
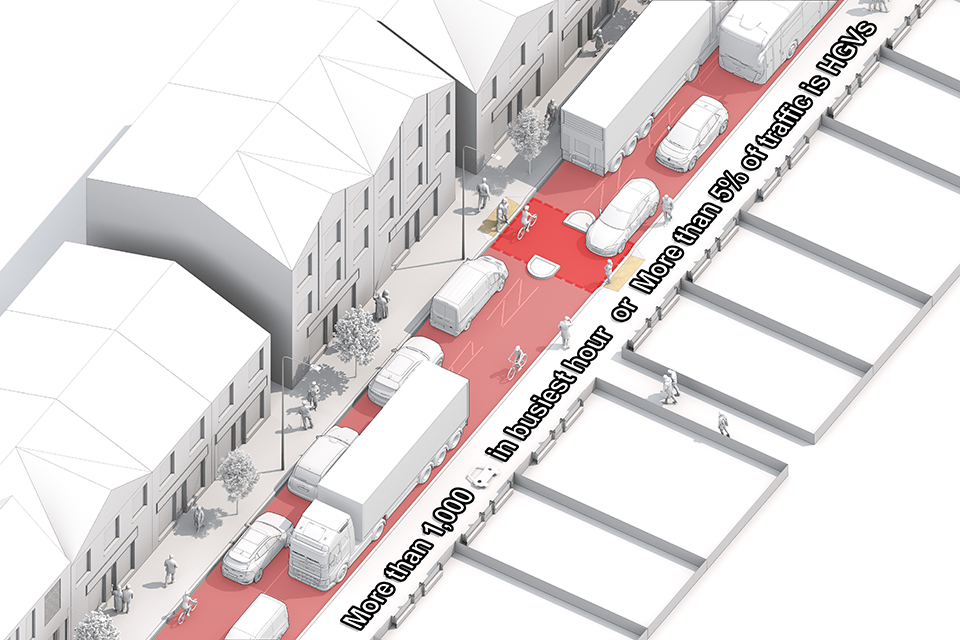
Graphic shows a busy street scene with several HGVs. There is no separation for cyclists. Pedestrians are attempting to cross at uncontrolled crossings.
This critical issue covers the risk of collisions between motor vehicles and pedestrians and cyclists where pedestrian and cyclist movements are not protected from high volumes of motor traffic, or high proportions of HGVs and buses.
This critical issue is considered present when the volume of motor vehicle traffic exceeds 1,000 vehicles in the busiest hour. Separately, it is considered present when more than 5% of the total volume of traffic is HGVs and buses where there are over 500 vehicles in the busiest hour, and where cyclists are not separated or pedestrians cross uncontrolled.
This issue is resolved by reducing the volume of motor traffic or by providing controlled crossings for pedestrians and protection for cyclists. If the crossings provided are not of the appropriate type for the context then the conditions for critical issue number 7 would be met.
Relevant guidance
| Guidance | Description |
|---|---|
| LTN 1/20 | Figure 4.1, provides guidance on the appropriate level of protection for cyclists in relation to motor traffic speed and volume. |
| Manual for Streets | 1 and 2, which provide guidance on crossing placement. |
Key evidence
Infrastructure and Cyclist Safety: Literature Review
This literature review explores how infrastructure affects cyclist safety, particularly in relation to motor traffic volumes and interactions. The review found that:
- the strongest evidence for improving cyclist safety is linked to reducing general motor traffic speed, especially at junctions
- high traffic volumes, particularly in the absence of protective infrastructure, are associated with increased risk for cyclists
- the review highlights that segregated networks are beneficial, but intersections with general traffic can still pose risks
- while the report does not cite specific hourly thresholds like more than 1,000 vehicles per hour or more than 5% HGVs, it supports the principle that high volumes and heavy vehicle presence increase danger for vulnerable road users
- traffic calming, urban design, and 20mph zones are recommended to mitigate these risks
10: Pedestrian crossing speed
Required crossing speed at signal crossings (risk of pedestrians coming into conflict with traffic).
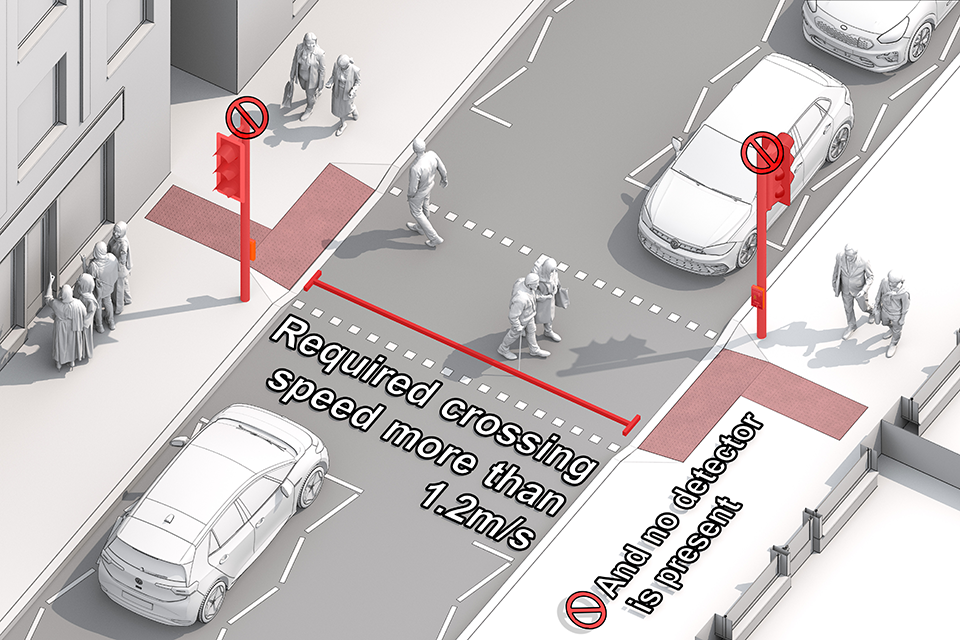
Graphic shows a street scene with a controlled crossing where pedestrians, including one using a mobility aid, must cross at a speed of more than 1.2 metres per second. There is no detector at the crossing to extend the pedestrian phase.
This critical issue covers the risk of collisions between pedestrians and motor vehicles at signalised crossings. It specifically addresses situations where pedestrians, including those who move at a slower pace due to age or ability, are not given adequate time to cross safely, and as a result may be left stranded on the carriageway when traffic signals turn green for motor vehicles.
This critical issue is considered present where pedestrians must cross at a speed of over 1.2 m/s to get across the whole crossing in time, and there is no detector present to extend the pedestrian phase. Most signal-controlled pedestrian crossings in England, even those without detectors to extend the pedestrian phase, are timed to a crossing speed of 1.2 m/s. This critical issue is therefore relatively rare compared to other critical issues. However, one situation where this critical issue can be found is at junctions or crossings where the crossing time in the pedestrian phase has been calculated to a narrow refuge island rather than the entire length of the crossing. If the refuge island is less than 1.5m wide then the critical issue remains, as pedestrians on such islands are not considered sufficiently protected from motor traffic.
This issue is resolved by extending the crossing time.
Relevant guidance
| Guidance | Description |
|---|---|
| Traffic signs manual | Chapter 6, which provides information relating to the timing of pedestrian signals. |
| Inclusive Mobility | Describes recommended dimensions for pedestrian facilities at crossings. |
Key evidence
Crossings – Living Streets Policy and Research
This policy report highlights the mismatch between assumed and actual pedestrian walking speeds at signalised crossings. It highlights that:
- UK crossing timings are based on an assumed walking speed of 1.2 m/s, a figure set in the 1950s
- the flashing green pedestrian phase (clearance time) assumes pedestrians are already crossing and must maintain a speed greater than 1.2 m/s to finish safely
- 76% of men over 65 and 85% of women over 65 walk slower than 1.2 m/s, with many averaging 0.8 m/s or less
- this results in conflict with traffic, especially for those who begin crossing late or have slower mobility
The report recommends:
- longer clearance times
- reduced wait times
- crossing designs that reflect actual walking speeds
Although no specific study was found that models conflict risk based on crossing speed, the evidence strongly supports the conclusion that requiring greater than 1.2 m/s creates unsafe conditions for a large portion of the population.
11: Footway widths
Clear walking and wheeling spaces free of permanent obstructions and furniture, reducing risk of pedestrians walking in the carriageway.
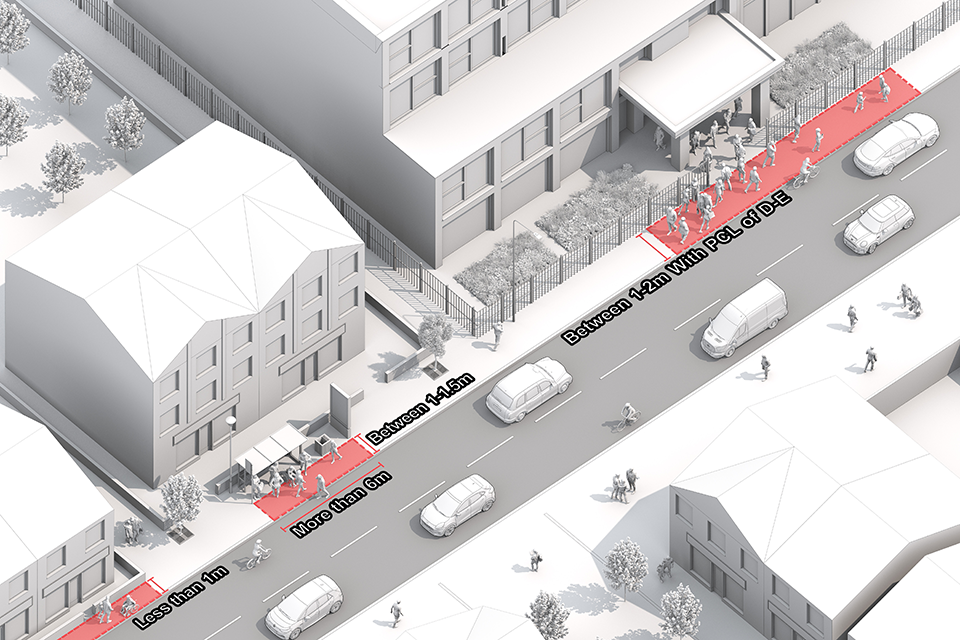
Graphic shows a street scene where lots of people are exiting a large building onto a narrow pavement. Other obstructions including seating narrow the pavement further up. Pedestrians are moving into the carriageway due to narrow pavements.
This critical issue covers the risk of pedestrians moving into the carriageway and coming into conflict with motor vehicles due to:
- narrow footways
- physical obstructions within the pedestrian space – such as poorly positioned street furniture
- the need to navigate around other pedestrians
This critical issue is considered present in 3 circumstances:
- when the clear footway width is less than 1m
- when the clear footway width is under 1.5m for a continuous length of over 6m
- when there is 1.5m to 2m of footway width, but there is a high density of pedestrians and the PCL is therefore poor – PCL is calculated using TfL guidance, and gradings of D or worse are considered poor
This issue is resolved by providing more space on the footway for pedestrians by widening it or by removing street clutter.
Relevant guidance
| Guidance | Description |
|---|---|
| Inclusive Mobility | Chapter 4, which includes information on footways and footpaths, with detailed requirements to ensure they are accessible and inclusive. |
| Manual for Streets | Includes design principles and detailed design issues for pavements and footways. This includes footway widths in sections 6.3.22 to 6.3.23. |
| TfL Pedestrian Comfort Guidance Technical Guide | Includes a methodology to understand and assess PCL, and links to the PCL calculator spreadsheet tool. |
Key evidence
The Path to Inclusive Footways
This report investigates barriers to footway accessibility and their impact on walking and wheeling. The report found that:
- narrow footways, pavement clutter, and permanent obstructions (for example, street furniture, parked cars) are major barriers
- these conditions force pedestrians into the carriageway, increasing risk, especially for disabled and older people
- pavement parking and poor surface quality exacerbate the problem
- footways that are less than 1.5m clear width over extended distances and less than 1m at pinch points are particularly problematic
- PCLs of D to E are associated with crowding, discomfort, and avoidance behaviours
- poor footway design contributes to social isolation, reduced independence, and increased injury risk
12: Effective width next to tram lines
Effective width next to tram line on a straight run or a curve.
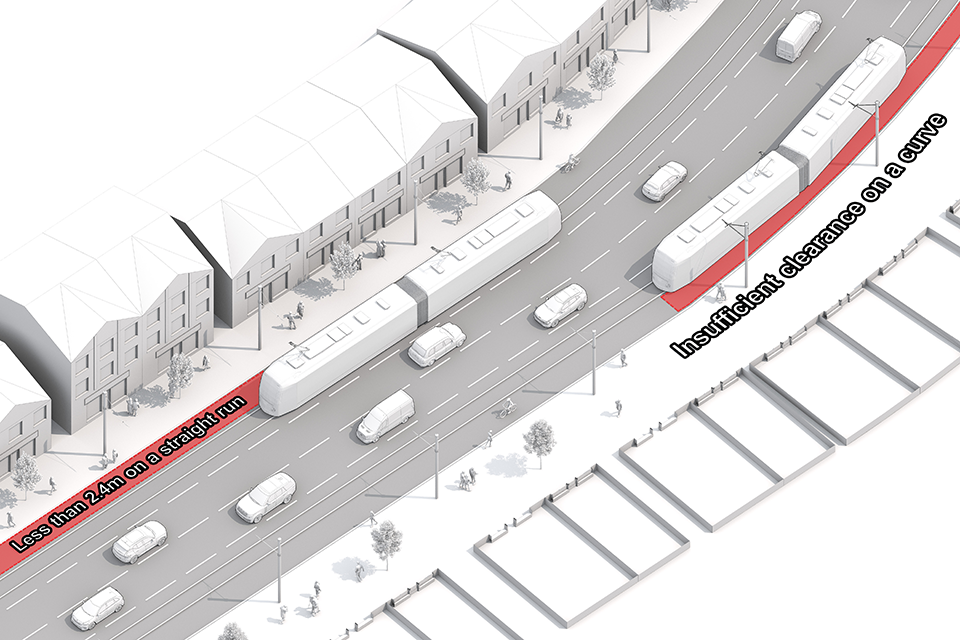
Graphic shows a street scene with trams, motor vehicles, cyclists and pedestrians. On one side of the road, there is less than 2.4m width between the nearside tram rail and the kerb edge. On the other side of the road, there is not enough clearance for the tram where the road curves.
This critical issue covers the risk of ‘shunt’ or ‘clip’ collisions for cyclists when riding alongside a tram line. It also covers the risk of cycle wheels slipping on tram rails or getting caught in their grooves and bringing cyclists into conflict with trams and other road users.
This critical condition is considered present when the width between the nearside tram rail and the kerb edge is less than 2.4m on a straight section of the tram track. This is based on allowing 700mm for the swept envelope of the tram measured from the nearside rail, adding 200mm to the edge of the cycle lane as recommended by UK Tram, and allowing for a cycle lane of 1,500 minimum width.
This should be checked on a case-by-case basis as tram sizes can vary. It is also considered present when there is insufficient ‘clearance’ between the nearside tram rail and the kerb edge on a curved section. There needs to be additional clearance at curves to account for the tram’s swept envelope. Typically, trams in England have a swept envelope, such that the 2.4m figure must be increased to 3m on a curve, but this should be checked in each situation where this critical issue is thought to be present.
The issue can be resolved by providing more space for cyclists alongside tram lines.
Relevant guidance
| Guidance | Description |
|---|---|
| LTN 1/20 | Covers interaction with tram tracks in sections 6.6.16 to 6.6.19. |
| Tramway Principles and Guidance | Provides guidance on designing infrastructure where cycle routes intersect or run alongside tram routes. |
Key evidence
LRG 19.0 Cycle Tramway Interface Guidance
This document provides comprehensive design principles for tram-train systems. The document is designed to:
- emphasise safe integration of tramways with urban environments
- include technical analysis of infrastructure design, including track alignment and clearance
- support the 2.4m minimum width on straight runs and greater clearance on curves to avoid conflict with pedestrians and cyclists
Guidance on Tramways – Office of Rail and Road (ORR) and Metro Alliance
This foundational guidance includes:
- definitions of tramway clearances, including dynamic kinematic envelopes
- requirements for safe integration with highways, including pedestrian and cyclist protection
The guidance notes that insufficient clearance on curves can lead to conflict and unsafe conditions, especially where trams cannot steer around obstructions.
13: Crossing angle of tram/train rails
Crossing angle (between cyclist desire line and tram or train rails).
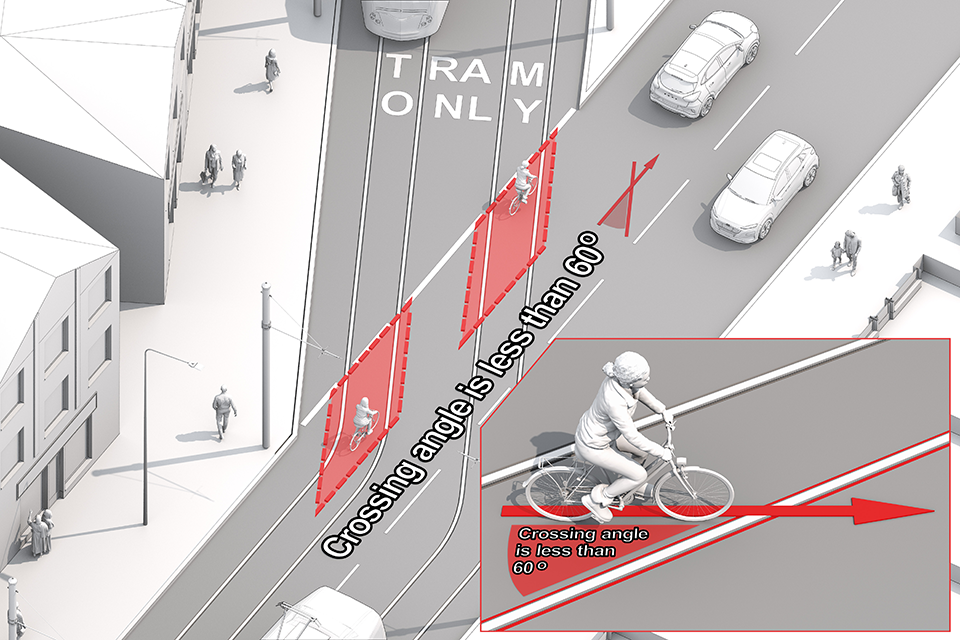
Graphic shows a section of a tram track within a street scene. Cyclists are crossing the rails at less than 60 degrees.
This critical issue covers the risk of cycle wheels slipping or getting caught in the grooves when cyclists cross tram or train rails, and the crossing angle is too shallow. When this happens, it can cause a loss of control bringing cyclists into conflict with trams or other road users.
This critical issue is considered present when the main cycle desire line or designed cycle route over tram or train rails is less than 60 degrees.
This issue can be resolved by ensuring cyclists cross the rails at an angle of at least 60 degrees.
Relevant guidance
| Guidance | Description |
|---|---|
| LTN 1/20 | Covers interaction with tram tracks in sections 6.6.16 to 6.6.19. |
| Tramway Principles and Guidance | Provides guidance on designing infrastructure where cycle routes intersect or run alongside tram routes. |
Key evidence
LRG 19.0 Cycle Tramway Interface Guidance
This guidance outlines best practices for designing safe cycle-tram interfaces. The guidance includes that:
- crossing angles less than 60 degrees significantly increase the risk of tyres slipping on the metal rail surface, especially in wet conditions, and the risk of wheels becoming trapped in the rail groove
- a minimum crossing angle of 60 degrees is recommended to reduce these risks
- greasy rail heads and acute angles are particularly hazardous
14: Cycling surface and maintenance defects
Major defects.
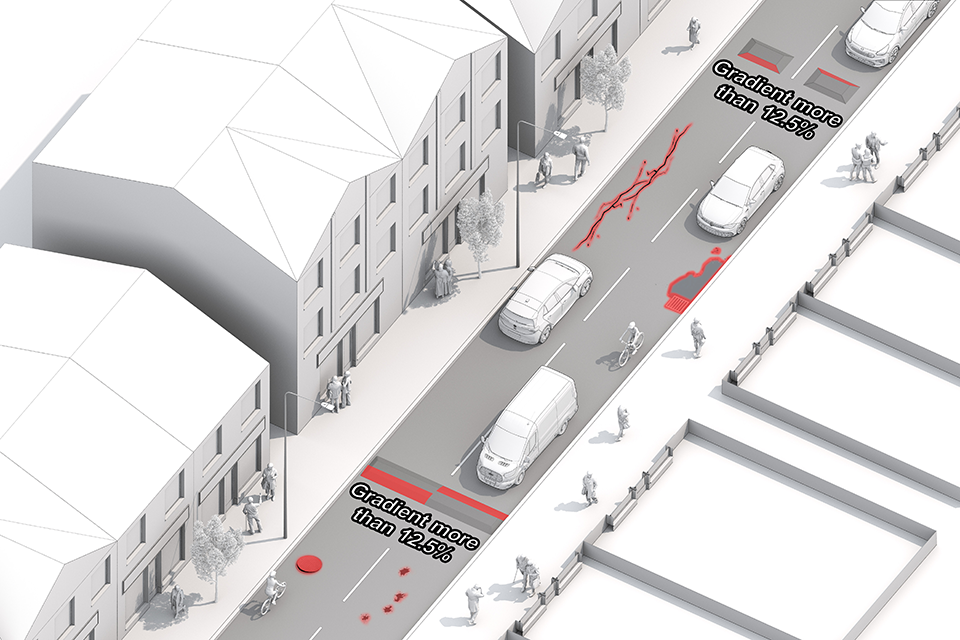
Graphic shows a street scene where there are defects in the road – speed bumps, cracked surfaces, potholes, a raised cover and a drainage issue.
This critical issue covers the risk of collisions arising from the presence of major defects in the cycling space. Such defects can lead to cyclists losing control or making sudden evasive manoeuvres, increasing the likelihood of collisions with motor vehicles.
This critical condition is considered present when there are major defects in the space where people will be cycling. Identifiable defects may include, but are not limited to:
- sharp gradients (of over 12.5%) on features such as speed bumps or cushions
- non-cycle friendly ironworks
- raised/sunken covers or gullies
- potholes
- loose/cracked surfaces
- poor drainage or slip risks
- overgrown vegetation
This issue is resolved by undertaking repairs to the faults identified or designing features for easy maintenance.
Relevant guidance
| Guidance | Description |
|---|---|
| LTN 1/20 | Chapter 8.5 and Chapter 15.2, which describe the importance of cycling surface material quality. |
Key evidence
The Little Book of Highway Defects
The guide provides detailed thresholds for identifying and prioritising major surface defects that pose risks to cyclists.
It defines specific defect types and their critical dimensions. This includes:
- potholes: 20mm depth, 100mm diameter
- open joints: 20mm gap, 200mm length
- cracking: 20mm gap, 200mm length
- difference in level (for example, raised/sunken covers): 20mm upstand
- flooding and poor drainage: classified as Category 1A defects requiring a 2-hour response
- cracking around ironworks and edge deterioration are flagged as high risk for cyclists
The document emphasises that defects meeting these thresholds should be treated as major hazards, especially for vulnerable road users such as cyclists.
It supports a risk-based approach to maintenance, prioritising repairs that reduce the likelihood of crashes or falls due to surface issues.
15: Walking/wheeling surface and maintenance defects
Major defects.
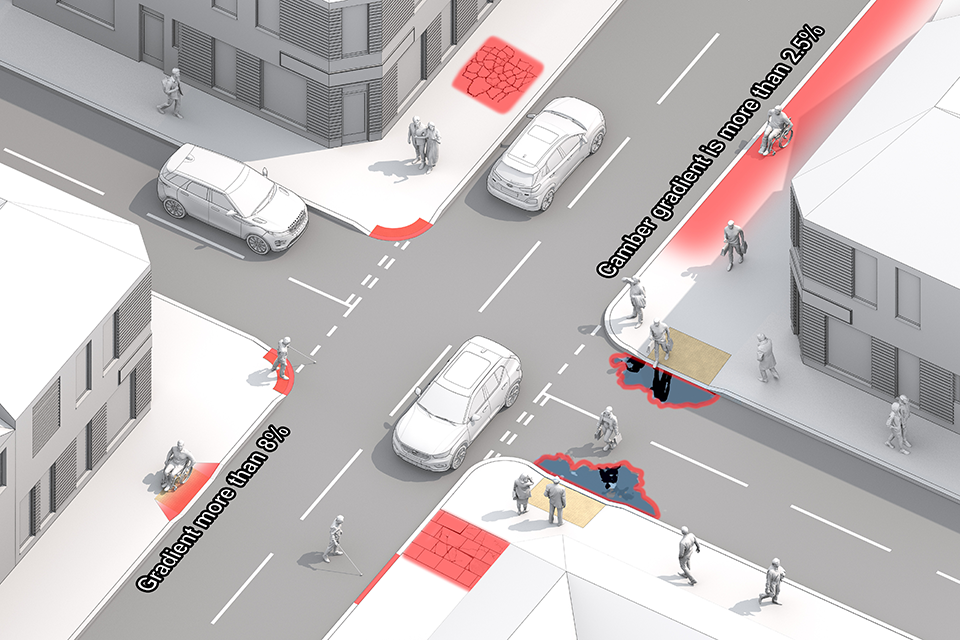
Graphic shows a street scene where there are defects in the pedestrian space – steep gradients, drainage issues, cracked surfaces.
This critical issue covers risks arising from the presence of maintenance-related major defects in the pedestrian space, affecting those walking or using wheelchairs and other mobility aids.
This critical condition is considered present when there are major defects in the space where people will be walking and wheeling. Identifiable defects include:
- steep camber (horizontal gradient more than 2.5%)
- steep longitudinal gradients (over 8% for a length of under 1m, or gradients of over 5% for a length of 1m or more)
- missing dropped kerbs
- non-flush tables, with a level difference of more than 6mm
- misleading tactile paving information that may lead pedestrians to situations where they might become stranded on the carriageway
- loose/cracked surfaces
- poor drainage or slip risks
- overgrown vegetation
This issue is resolved by undertaking repairs to the faults identified or designing features for easy maintenance.
Relevant guidance
| Guidance | Description |
|---|---|
| Guidance on the use of tactile paving surfaces | Provides guidance relating to the use of tactile materials and recommended maximum gradients at pedestrian crossing points. |
| Inclusive Mobility | Provides best practice guidance relating to the accessibility of transport infrastructure, including detailed guidance on gradients and crossfall. |
Key evidence
Guidance on the use of tactile paving surfaces
The guidance outlines best practice for designing and maintaining walking and wheeling surfaces, with a focus on accessibility for disabled users.
It identifies major defects that compromise safety and usability, which includes:
- missing dropped kerbs, which create barriers for wheelchair and scooter users
- non-flush raised tables, which can cause trip hazards and discomfort
- misleading tactile paving, which risks confusion and mis-navigation for visually impaired users
- loose/cracked surfaces, which increase risk of falls and discomfort
- poor drainage, which can lead to flooding and slip risks
- overgrown vegetation, which obstructs footways and reduces usable width
- steep slopes, which require careful design to ensure safe gradients for wheeling users
The guidance emphasises that tactile paving must be:
- consistently applied to avoid confusion
- detectable underfoot without causing discomfort or trip hazards
- maintained to avoid deterioration, which can turn accessibility features into hazards
The guidance supports inclusive design principles and aligns with the Equality Act 2010, ensuring public realm infrastructure supports independent mobility for all users.
16: Guard railing
Presence of guard railing.
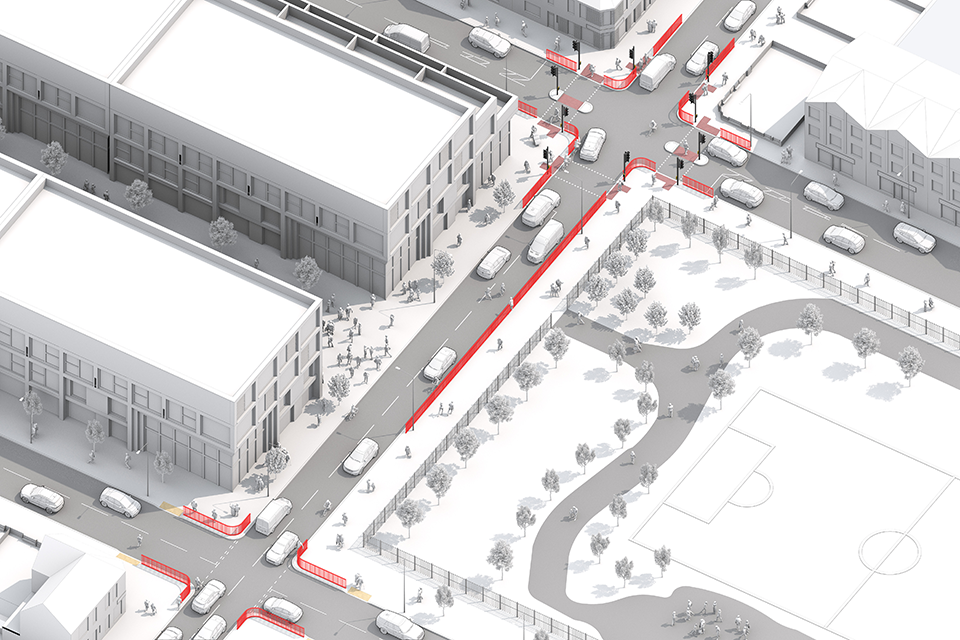
Graphic shows a street scene where roads intersect. There are motor vehicles, pedestrians, cyclists, two big buildings and a park. Guard railing is highlighted where it constitutes a critical issue, for example where it blocks where pedestrians cross the street to get to the park entrance.
This critical issue covers the risk of cyclists or pedestrians being crushed by motor vehicles against guard railing. It also covers the risk of increased vehicle speeds from collisions when guard railing is used as standard without consideration of its inherent safety risks.
This critical issue is considered present when guard railing has been used as standard without consideration of inherent safety risks. Safety risks will vary from site to site but could typically include:
- locations where guard railing blocks main desire lines, resulting in pedestrians regularly crossing the street away from their desired crossing points
- junctions and other locations with guard railing where cyclists could encounter either ‘hooking’ type collisions or collisions from alongside or behind, with the guard railing potentially increasing the likelihood or severity of such incidents
This critical issue is unlikely to be present where guard railing is used to reduce risk in a carefully considered manner. For example, guard railing against the carriageway at the bottom of a ramp where it would mitigate the risk of a cyclist or wheelchair user who has lost control from entering the carriageway. Using it on staggered crossings is not appropriate in most contexts.
This issue can be resolved by removing the guard rail.
Relevant guidance
| Guidance | Description |
|---|---|
| LTN 2/09 Pedestrian Guardrailing | Provides guidance on pedestrian guard railing. |
| LTN 1/20 | Provides guidance on guard railing at paragraph 10.4.19. |
| Inclusive Mobility | Provides inclusivity considerations for guardrails in section 4.4. |
Key evidence
Pedestrian Guardrail Risk Assessment – Dulwich Village Outline Design
The report was commissioned following a Stage 1 Road Safety Audit recommendation to assess the safety implications of removing pedestrian guard railing at the Dulwich Village/Turney Road junction.
It found that guard railing had been installed as standard prior to 2008, but since then:
- a 20mph speed limit and bus gates have significantly reduced traffic volumes during peak pedestrian times
- the need for guard railing has diminished, especially as the highest pedestrian volumes coincide with the lowest traffic volumes
The assessment identified several inherent safety risks associated with guard railing. These include:
- encouraging unsafe crossings. Pedestrians were observed bypassing the railing to cross at informal points
- creating a hostile environment. Guard railing segregates pedestrians and reduces usable footway space
- increasing collision severity. Pedestrians and cyclists can be trapped between traffic and the railing
- encouraging higher vehicle speeds due to perceived separation of pedestrians
The design proposals include:
- significant footway widening
- carriageway narrowing to reduce speeds
- wider crossings on desire lines
- removal of guard railing to improve pedestrian comfort and accessibility
A PCL assessment showed that the proposed design would improve comfort and reduce risk, even during peak periods.
The report concludes that removal of guard railing does not pose a safety risk and aligns with TfL and Southwark guidance advocating for context-sensitive design rather than default installation.
Road Safety Audit and Removal of Pedestrian Guardrailings in London
This report outlines TfL’s systematic approach to assessing and removing pedestrian guard railing across London.
A guard rail risk assessment framework (GRAF) was developed to evaluate:
- pedestrian flow
- carriageway width
- casualty history
- road user visibility
- traffic speeds and turning movements
The key findings include:
- a pilot study showed that 32% of guard rail on the Transport for London Road Network (TLRN) met removal criteria
- 16% of all guard rail across London could be safely removed over 4 years, equating to 32km
- during the first year, 42% of assessed guard rail was deemed suitable for removal
TfL adopted the 3Ms approach:
- managed: auditable process
- measured: monitor flows and casualties
- mitigated: apply alternative safety measures if needed
The report emphasises that guardrail should not be installed by default, and removal should be based on site-specific safety audits.
Pedestrian Guardrails – Effectiveness and Safety Review
This review summarises multiple studies on the safety impact of pedestrian guard rails.
Key findings include:
- guard rails have no clear safety benefit – collision rates were similar at sites with and without guard rails
- negative impacts include:
- reduced visibility of pedestrians, especially children
- restricted pedestrian movement and comfort
- increased risk of cyclists being crushed against railings
- guard rails create visual clutter, detracting from the urban realm and discouraging walking and cycling
- they are costly to maintain as they are frequently damaged by vehicles
The report recommends alternative safety measures such as:
- speed reduction
- traffic calming
- improved crossing design
It concludes that guard rail should only be used in exceptional cases, such as near school exits or alleyways, and not as a standard design feature.