Coroners statistics 2019: England and Wales
Updated 29 May 2020

© Crown copyright 2020
This publication is licensed under the terms of the Open Government Licence v3.0 except where otherwise stated. To view this licence, visit nationalarchives.gov.uk/doc/open-government-licence/version/3 or write to the Information Policy Team, The National Archives, Kew, London TW9 4DU, or email: psi@nationalarchives.gov.uk.
Where we have identified any third party copyright information you will need to obtain permission from the copyright holders concerned.
This publication is available at https://www.gov.uk/government/statistics/coroners-statistics-2019/coroners-statistics-2019-england-and-wales
1. Main Points
| Decrease in the number of deaths reported to coroners in 2019 | 210,900 deaths were reported to coroners in 2019, the lowest level since 1998 – down 4% (9,700) compared to 2018. |
| 40% of all registered deaths were reported to coroners in 2019 | The proportion of registered deaths in England and Wales reported to coroners has decreased by one percentage point compared to 2018, the lowest proportion since 1998. |
| Deaths in state detention, down 7% in the last year | 478 deaths in state detention were reported to coroners in 2019 (down from 514 in 2018), the decline is driven by a 16% and 5% fall in deaths of individuals under the Mental Health Act 1983 and in prison custody respectively. |
| Post-mortem examinations were carried out on 39% of all deaths reported in 2019 | There were 82,100 post-mortem examinations ordered by coroners in 2019, a 4% decline compared to 2018. However, the proportion of reported deaths requiring a post-mortem has remained stable over the same period. |
| 3% more inquests opened in 2019 | 30,000 inquests were opened in 2019, up 3% compared to 2018. |
| Inquest conclusions up 2%, driven by a rise in suicide and unclassified conclusions | In 2019, 31,300 inquest conclusions were recorded in total, up 2% on 2018. Suicide and unclassified conclusions were the main drivers in the increase, up 11% and 4% on 2018, to 4,600 and 6,300 inquest conclusions in 2019 respectively. |
| Average time taken to process an inquest rises by one week | The estimated average time taken to process an inquest increased from 26 weeks in 2018 to 27 weeks in 2019. |
This annual publication presents statistics of deaths reported to Coroners in England and Wales in 2019. Information is provided on the number of deaths reported to coroners, post-mortem examinations and inquests held, and conclusions recorded at inquests. A map reference of Coroner areas in England and Wales is available in the supporting document published alongside this bulletin. For previous editions of this report please see: www.gov.uk/government/collections/coroners-and-burials-statistics.
2. Statistician’s comment
The proportion of deaths reported to coroners in England and Wales continues to fall; 40% of all deaths were reported to the coroner in 2019, the lowest since 1999.
There was a slight increase in inquests ordered by the coroner in 2019 and the average time taken to complete an inquest rose by one week from 26 weeks 2018 to 27 weeks in 2019. The proportion of deaths in which an inquest was opened has remained fairly stable for the last couple of years, at 14%.
There was a two per cent increase in deaths where an inquest was opened and concluded (up to 31,284 cases in 2019); the largest driver of this increase was in suicide and unclassified conclusions (up 11% and 4% on 2018, to 4,620 and 6,331 inquest conclusions in 2019 respectively). Males represented 56% of deaths in 2019, but 77% of suicide verdicts following an inquest.
The period covered by this publication is January to December 2019 (pre-Covid-19) and will therefore not include any Covid-19 related deaths.
3. Deaths Reported
4% decrease in the number of deaths reported to coroners in 2019
210,912 deaths were reported to coroners in 2019, the lowest level since 1998. This is a decrease of 9,736 (4%) from 2018.
40% of all registered deaths were reported to coroners in 2019
The percentage of all registered deaths that were reported to coroners has decreased by one percentage point compared with 2018, the lowest proportion since 1999.
All deaths in England and Wales must be registered with the Registrar of Births and Deaths and statistics on all deaths are published by the Office for National Statistics (ONS). The ONS mortality statistics, based on death registrations, report the number of deaths registered in England and Wales in a particular year irrespective of whether a coroner has investigated the death. These Ministry of Justice’s coroner statistics provide the number of deaths which are reported to coroners in England and Wales. Further background information is provided in Chapter 1 of the supporting guidance document.
The number of deaths reported to coroners in 2019 decreased by 9,736 (4%) to 210,912, the lowest level since 1998. In comparison, ONS registered deaths fell 10,732 (2%)[footnote 1] from 2018 to 2019. The proportion of registered deaths in 2019 that were reported to coroners was 40%, down one percentage point since 2018.
The number of registered deaths in England and Wales has been broadly increasing, from a low of 484,367 in 2011 before gradually rising to 541,589 in 2018. Provisional figures for 2019, however, show a decrease to 530,857. The number of deaths reported to coroners has followed a similar trend, from a low of 222,371 deaths reported in 2011 and then rising to a high of 241,211 in 2016. However, in contrast to deaths registered in 2017 and 2018, deaths reported to coroners over these two years fell, as shown in figure 1. This shows a reversal to similar broadly stable levels seen prior to 2015, before the impact of Deprivation of Liberty Safeguard (DoLS) on 2015, 2016 and 2017 figures. In 2019, there were decreases in both deaths registered and deaths reported.
Figure 1: Registered deaths and deaths reported to coroners, England and Wales, 2009-2019 (Source: Table 2)
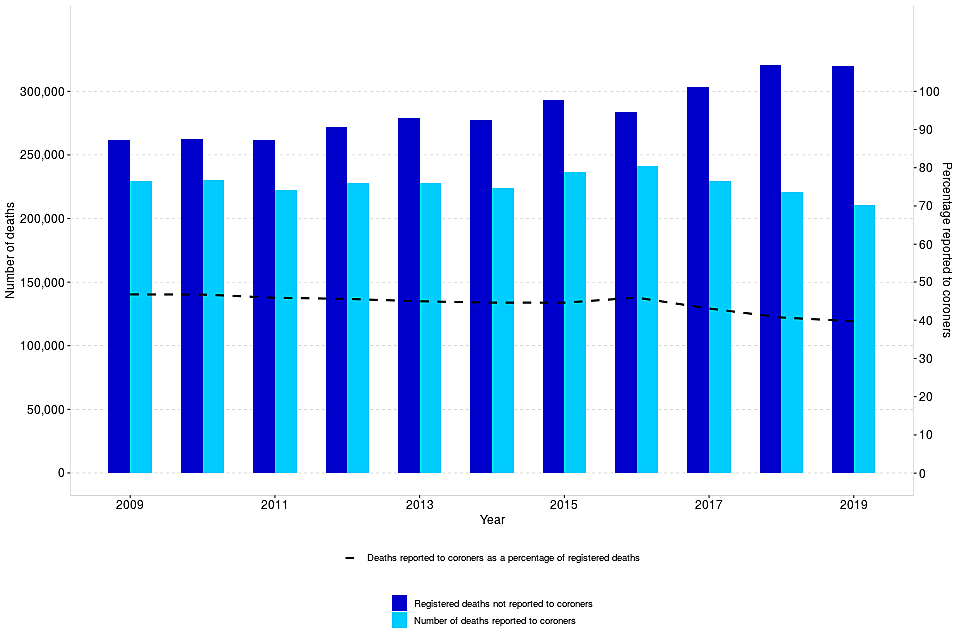
Registered deaths and deaths reported to coroners, England and Wales, 2009-2019
Out of England and Wales Orders
To remove a body of a deceased person out of England and Wales, notice must be given to the coroner within whose area the body is lying. When the coroner gives permission for the removal of a body, an Out of England and Wales order is issued.
Coroners issued 5,632 Out of England and Wales orders in 2019, compared with 5,861 issued in 2018. In 2019, the number of orders issued represented 3% of the total number of deaths reported to coroners, continuing the consistently rising trend seen since 2015, (see Table 5).
Deaths abroad
Of the 210,912 deaths reported to coroners in 2019, around 1% (1,939) were reports of deaths that had occurred outside England and Wales, remaining at approximately the same level since 2011.
4. Deaths in State Detention
Deaths in state detention, excluding DoLS, down 7% in the last year
Deaths in state detention reported to coroners decreased by 7% to 478 in 2019, driven by a fall in number of deaths of individuals in prison custody and detained under the Mental Health Act 1983 (as amended).
In 2019, a total of 478 deaths which occurred in state detention were reported to coroners[footnote 2], a decrease of 36 deaths (7%) on the previous year and representing less than 1% of all deaths reported to coroners.
There were 144 deaths of individuals subject to Mental Health Act Detention in 2019, a 16% decrease (27 cases) compared to 2018. The Care Quality Commission reported 195 deaths under the Mental Health Act 1983 (as amended)[footnote 3] in financial year 2018/19, down 21% on the number they reported in 2017/18 (247 deaths). The number of deaths in prison custody decreased by 5% (17 cases) compared to 2018, to 299 deaths in 2019.
From 2015 to 2017 the inclusion of deaths under a Deprivation of Liberty Safeguard (DoLS) led to a distortion of the long-term trend seen in the number of deaths in state detention. This requirement was removed from 1 April 2017 and as such the deaths under DoLS have been excluded from Figure 2 below, in order to aid year-on-year comparison of figures. For more information on DoLS please refer to the supporting guidance which accompanies this bulletin. There has been a general rise in deaths in state detention since 2011, although the number has been decreasing in the last three years.
Figure 2: Number of deaths in state detention by type of detention, 2011-2019 (Source: Table 6)
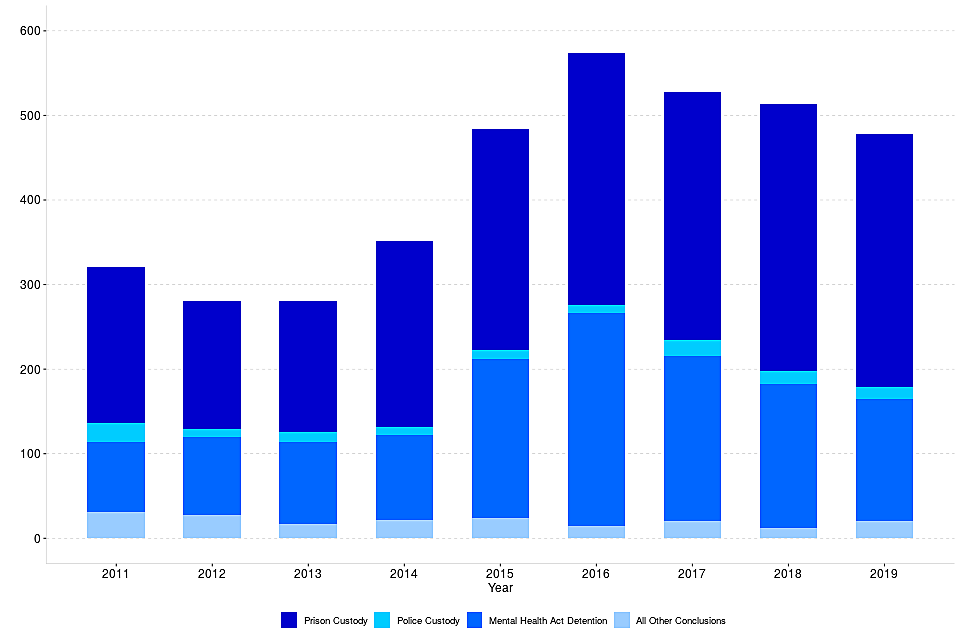
Number of deaths in state detention (excluding DoLS), by type of detention, 2011-2019
5. Post-Mortem examinations held
Post-mortem examinations were carried out on 39% of all deaths reported in 2019
There were 82,072 post-mortem examinations ordered by coroners in 2019, 39% of all cases reported to them (no change since 2018).
Post-mortem examinations were held for 82,072 deaths reported to coroners in 2019, down 3,521 (4%) from 2018. This represents 39% of all deaths reported to coroners in 2019, the same proportion of the 2018 amount.
Figure 1 of the supporting guidance document provides an overview of the possible outcomes when a death is reported to a coroner, including circumstances involving a post-mortem.
Figure 3: Post-Mortems as a percentage of deaths reported to coroners, England and Wales, 2010-2019 (Source: Tables 3-4)

Post-Mortems as a percentage of deaths reported to coroners, England and Wales, 2010-2019
Post-mortem examinations can be classed as either standard or non-standard, depending on the cost of the examination. A non-standard post-mortem is charged at a higher rate than a standard post-mortem and is defined as a post-mortem which requires special skills. A non-standard post-mortem could, for example, require a paediatric or specialist pathologist. In 2019, almost all (94%) of post-mortems were ordered at a standard rate – this proportion is one percentage point lower than in 2018.
The proportion of post-mortems carried out varies from 18% of deaths reported in Staffordshire South to 65% in North Yorkshire (Eastern), as shown by Map 1.
Map 1: Post-Mortems held as a proportion of deaths reported to coroners, England and Wales, 2019
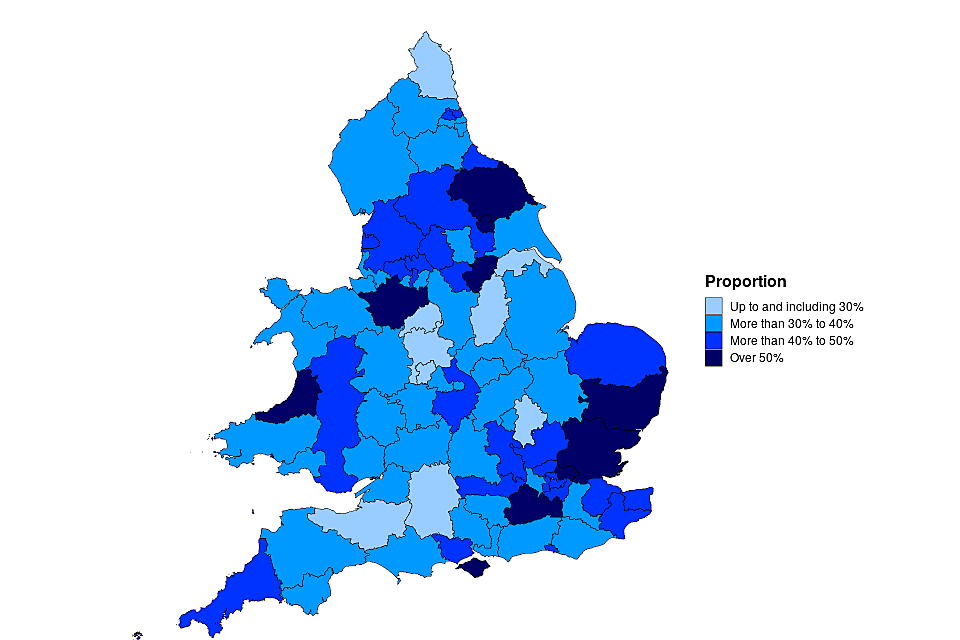
Post-Mortems held as a proportion of deaths reported to coroners, England and Wales, 2019
Post-mortem examinations in inquest cases
When an inquest is opened, a post-mortem examination will often be conducted. In 2019, 59% of inquest cases involved a post-mortem, down three percentage points on 2018.
Post-mortem examinations in non-inquest cases
In the majority (82%) of cases referred to coroners, there is no inquest. In 2019, there were 57,998 non-inquest cases where a post-mortem was held. The percentage of non-inquest cases that required a post-mortem has not changed and was 34% in both 2018 and 2019. This figure has remained fairly stable since 2017. There had previously been a downward trend since the beginning of the series (56% in 1995 to 32% in 2016).
Post-mortem examinations in potential inquest cases
Prior to July 2013, cases were either categorised as ‘inquest’ or ‘non-inquest’ cases. Changes in the way coroners conduct an investigation mean that there is now a third category of ‘potential inquest’ cases. This means that the coroner is investigating the death, but has not yet decided whether it is necessary to hold an inquest. Depending on whether or not the coroner deems it necessary to hold an inquest, these cases will all eventually end up in either the ‘inquest’ or ‘non-inquest’ category. In 2019, there were 8,748 potential inquest cases being dealt with by coroners in England and Wales, with 74% requiring a post-mortem. The number of potential inquests in total has decreased by 6% in the past year, ending the rising trend seen since the category was introduced in 2013.
Cases requiring neither a post-mortem nor inquest
There were 114,197 cases reported to coroners where there was neither an inquest nor a post-mortem. This type of case has decreased by 6% in the current year and the number of cases reported is the lowest level since 2004. This continues the decrease seen in 2017 (down 4%, to 127,601) and 2018 (down 5%, to 120,900). The proportion of all deaths reported where there was neither an inquest nor a post-mortem examination has decreased by one percentage point to 54% in 2019. This proportion has remained fairly constant since 2011 and is still the most common outcome when a death is reported to a coroner.
Post-mortem types (Histology, Toxicology and Less-Invasive)
In 2019, 22% (18,123) of all post-mortems included histology, no change from 22% (19,012) in 2018. Post-mortems including toxicology increased by 976 cases over the same period to 19,291 (up 5%), with 24% of all post-mortems held in 2019 including toxicology - continuing the consistently rising trend seen since 2011.
There were 5,044 post-mortems conducted using less-invasive techniques (such as Computerised Tomography [CT] Scans) in 2019, up from 3,326 cases in 2018. The number of less-invasive post-mortems carried out varied from zero in 34 areas to 1,659 in Lancashire and Blackburn with Darwen. Lancashire and Blackburn with Darwen, South Yorkshire (Western) and Black Country conducted over a half (94%, 67% and 51% respectively) of all their post-mortems using less-invasive techniques. Sefton, Knowsley and St Helens and Leicester City and South Leicestershire conducted over a quarter of all their post-mortems using less-invasive techniques (42% and 45% respectively).
6. Inquests Opened
3% increase in inquests opened in 2019
The number of inquests opened in 2019 increased by 875 (up 3%) to 29,969.
There were 29,969 inquests opened in 2019, a 3% increase on 2018. The number of inquests opened in 2018 and 2019 is mostly consistent with figures before DoLS investigation requirements (see section 4) were introduced (excluding 2014, which had 25,889).
Inquest cases represented 14% of all the deaths reported to coroners in 2019, a marginal increase from 13% in 2018. The number of inquests opened as a proportion of deaths reported in 2019 varied across coroner areas, from 6% in Newcastle upon Tyne to 26% in City of London. However, most coroner areas held inquests for between 10% and 20% of all deaths reported (63 of the 88 coroner areas). Map 2 shows the inquests opened as a proportion of deaths reported in 2019 for all coroner areas in England and Wales.
Inquests with juries and adjourned inquests
There were 527 inquests held with juries in 2019 (representing 2% of all inquests), an increase of 104 (25%) compared to 2018.
The number of inquests held with juries showed a downward trend until 2014, but then increased year on year to 576 in 2016, the highest level since 2003. There was a decrease to 423 in 2018, mirroring the fall in the number of inquests held and the overall number of deaths reported to coroners. The rise in 2019 reflects the increase in overall number of inquests held. The proportion of inquests held with juries has however remained stable between 1% and 2% of all inquests concluded over the last decade (see Table 9).
In 2019, 849 inquests were adjourned (and not resumed) by the coroner under Schedule 1[footnote 4] of the Coroners and Justice Act 2009 because criminal proceedings took place. This represents 3% of all inquests concluded, the same proportion as in 2018.
Map 2: Inquests opened as a proportion of deaths reported to coroners, England and Wales, 2019
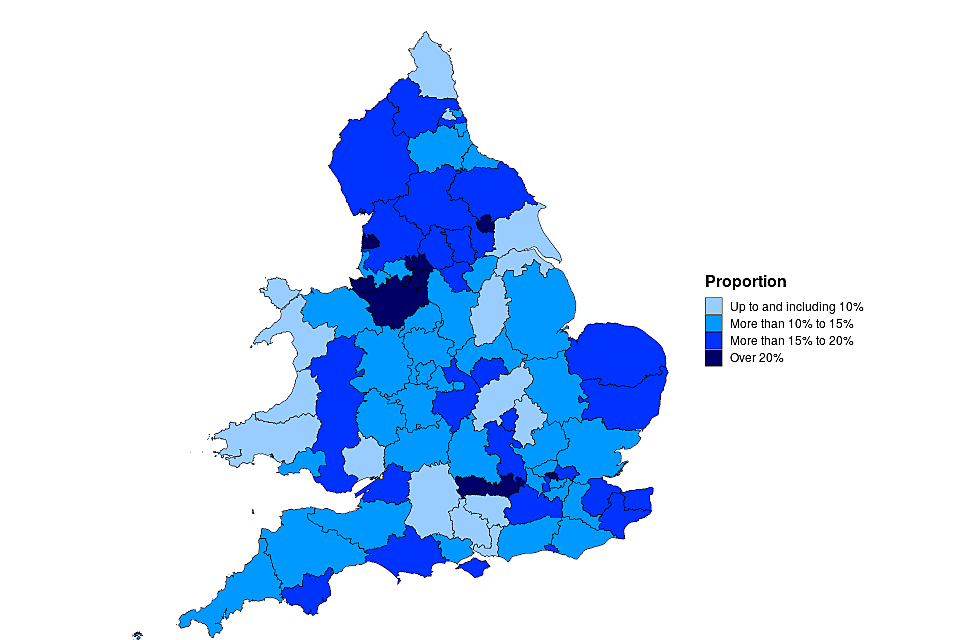
Inquests opened as a proportion of deaths reported to coroners, England and Wales, 2019
7. Inquest Conclusions
2% increase in inquest conclusions recorded, driven by suicide and unclassified conclusions
In 2019, 31,284 inquest conclusions were recorded, up 2% on 2018, reflecting the increase in the number of inquests opened. Inquest conclusions of suicide and unclassified conclusions were up 11% and 4% on 2018 to 4,620 and 6,331 respectively.
There were 31,284 inquests conclusions recorded in 2019, up 552 (2%) since 2018, in part reflecting the increase in the number of inquests opened. This is the highest level since 2017. Background information on inquest conclusions is provided in Chapter 1 of the supporting guidance document.
In 2019 the most common short form conclusions (by order of frequency) were death by misadventure (7,736 or 25% of all conclusions), suicide (4,620 or 15%) and death by natural causes (3,957 or 13%). Unclassified conclusions (which include narrative verdicts) made up 20% (6,331) of all inquest conclusions in 2019.
Figure 4: Number of conclusions recorded at inquests, England and Wales, 2009-2019 (Source: Table 7)
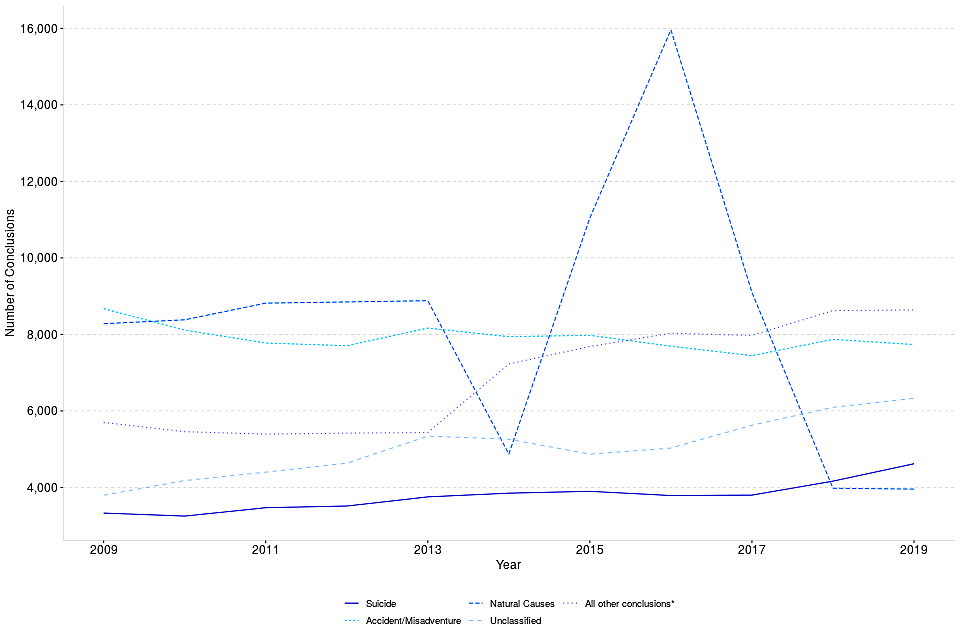
Number of conclusions recorded at inquests, England and Wales, 2009-2019
*Includes Killed unlawfully; Killed lawfully; Attempted or self-induced abortion; Cause of death aggravated by lack of care or self-neglect; Want of attention at birth; Stillborn; Disasters; Open; Industrial Diseases; Drugs/Alcohol related[footnote 5]; and Road traffic collision.
In 2015 and 2016, there were significant increases seen in natural causes conclusions, driven by deaths of individuals subject to DoLS authorisations where the majority (94%) had an inquest conclusion of natural causes. In line with the falls seen in the number of inquests opened and inquest conclusions following the removal of the requirement to report DoLS deaths, there has also been a corresponding decrease in the number of natural cause conclusions in 2017 and 2018. In 2019, natural causes decreased less than 1%, suggesting a stabilisation following the DoLS impact and the Coroners Act 2009 coming into effect in July 2013, which meant a coroner could now issue a death certificate without holding an inquest when it was known that a death had occurred naturally.
In 2019, the number of unclassified conclusions increased by 237 cases (up 4%) to 6,331. Unclassified conclusions made up 20% of all conclusions in 2019, the same proportion as in 2018. The rise in unclassified conclusions seen until 2014 and again from 2016 is partly due to the increasing use of what are known as ‘narrative conclusions’ by some coroners. In these cases, the conclusion is recorded as unclassified. As well as narrative conclusions, this category includes short non-standard conclusions which a coroner or jury might return when the circumstances do not easily fit any of the standard conclusions[footnote 6].
The proportion of conclusions recorded as suicide has remained broadly constant over the past ten years, generally at around 11-12%. However, in 2018, it accounted for 14% of all inquest conclusions and 15% in 2019. This proportion varies from 3% in Gateshead and South Tyneside to 33% in East Sussex[footnote 7].
For the remaining conclusion types, drugs and alcohol related cases increased by 177 cases (up 5%) to 3,414 and road traffic collisions increased by 33 cases (up 3%) to 995.
Open conclusions have seen a decrease over the last decade - they accounted for 5% in 2019 compared with 8% in 2009.
Figure 5 shows the proportion changes in inquest conclusions between 2018 and 2019.
Figure 5: Conclusions recorded at inquest, by category and as a proportion of all conclusions, England and Wales, 2018 and 2019 (Source: Table 7)[footnote 8] [footnote 9]
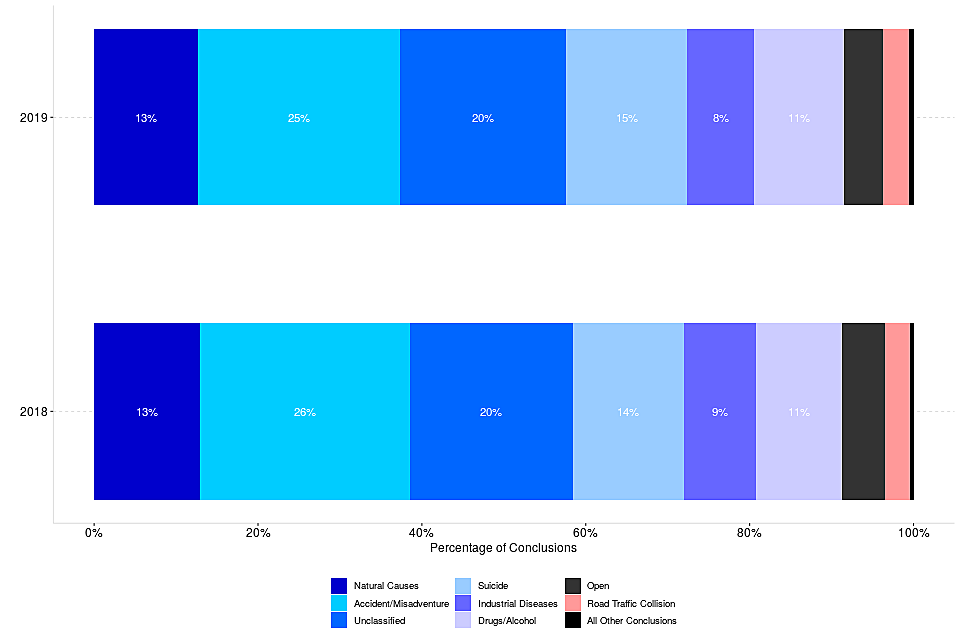
Conclusions recorded at inquest, by category and as a proportion of all conclusions, England and Wales, 2018 and 2019
8. Inquest Conclusions by Sex
Conclusions recorded at inquests by sex[footnote 10]
Male deaths accounted for 65% of all conclusions recorded in 2019 while female deaths accounted for 35%. In 2018, the percentages were 66% and 34% respectively.
The pattern of conclusions recorded differs between males and females. Male deaths accounted for 65% of all conclusions recorded in 2019 and accounted for 56% of deaths reported; this suggests that males are more likely to die in circumstances that lead to an inquest.
Figure 6 shows the variation in the sex proportions, depending on the type on inquest conclusion. Industrial disease had the highest proportion of males, at 91%, and accident/misadventure had the highest proportion of females[footnote 11], at 45%.
Figure 6: Conclusions recorded at inquests by sex, England and Wales, 2019 (Source: Table 7)
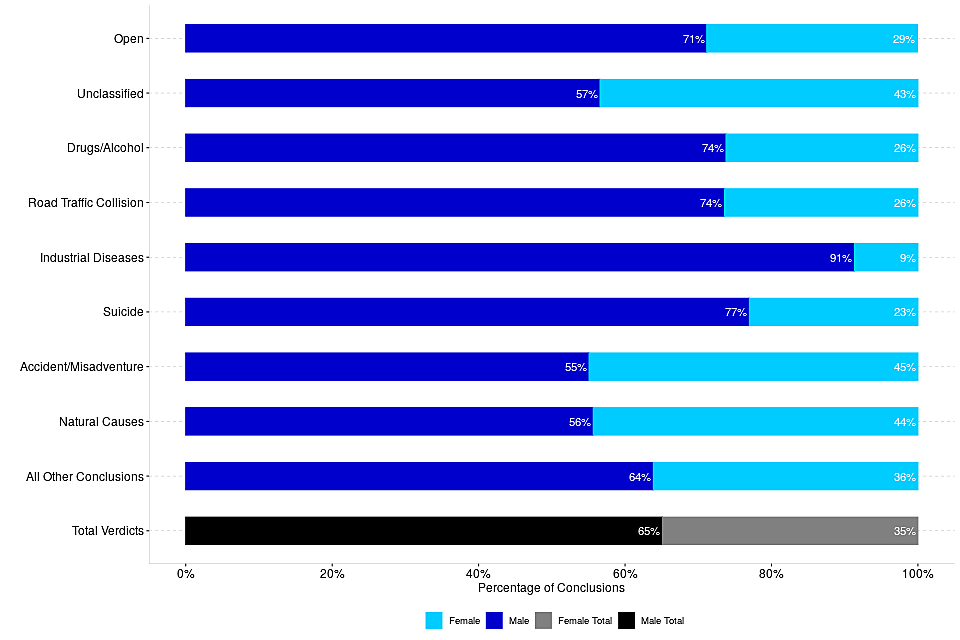
Conclusions recorded at inquests by sex, England and Wales, 2019
9. Inquest Conclusions by Age
The majority of inquests completed were for those aged 65 years and over
Of the inquests completed in 2019, 53% related to persons who were aged 65 years or over at time of death compared with 6% related to persons under 25 years of age.
The profile of the age of deceased at inquests has remained mostly stable from 2018 to 2019. The percentage of inquests completed relating to persons aged 65 or over was unchanged at 53%. By contrast, 6% of inquests concluded related to persons under 25 years of age, while the percentage of those between 25 and 65 years has increased marginally from 41% to 42% (see Table 8).
Although an age breakdown of registered deaths in England and Wales in 2019 is not yet available, ONS figures for 2018[footnote 12] show that 85% of registered deaths in England and Wales were persons aged 65 or over, with only 1% aged under 25 years old.
Figure 7: Proportion of inquest conclusions by age of deceased, England and Wales, 2019 (Source: Table 8)[footnote 13]
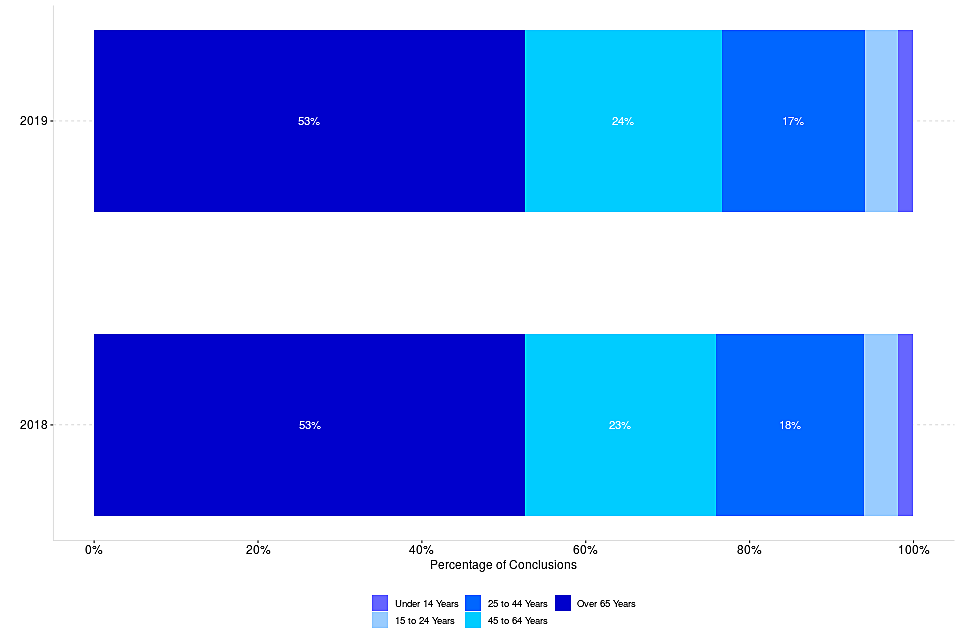
Proportion of inquest conclusions by age of deceased, England and Wales, 2019
10. Time taken to process an inquest
Overall an increase of one week in average time taken to process an inquest
The estimated average time taken to process an inquest is up from 26 weeks in 2018 to 27 weeks in 2019.
The estimated[footnote 14] average time taken to process an inquest in 2019 (defined as being from the date the death was reported until the conclusion of the inquest) was 27 weeks (see Table 13)[footnote 15], an increase of one week compared to 2018.
The decreases in time taken that occurred in 2015 and 2016 can largely be attributed to DoLS deaths where, in accordance with the Chief Coroner’s guidance, in uncontroversial cases, there could be a ‘paper inquest’, i.e. the Coroner in open court considered the evidence on the papers, which had been discussed in advance with the family (and interested persons) – this agreed process which usually did not require a post-mortem examination report took much less time to process and conclude – thus reducing the average time.
The time taken to process an inquest varies by coroner area - the maximum average time taken to process an inquest in 2019 was 50 weeks in City of London, and the minimum average time was eight weeks in North Tyneside. The large range of average time (42 weeks – based on eight and 50 weeks) is due to the fact that coroners’ caseloads can vary greatly and a direct comparison between coroner areas is therefore not advised. Map 3 provides an overview of average time taken across coroner areas in England and Wales.
More information about how the average time taken has been estimated can be found in the Guide to Coroners Statistics published alongside this report.
Figure 8: Average time taken to process an inquest (in weeks), 2009-2019 (Source: Table 9)
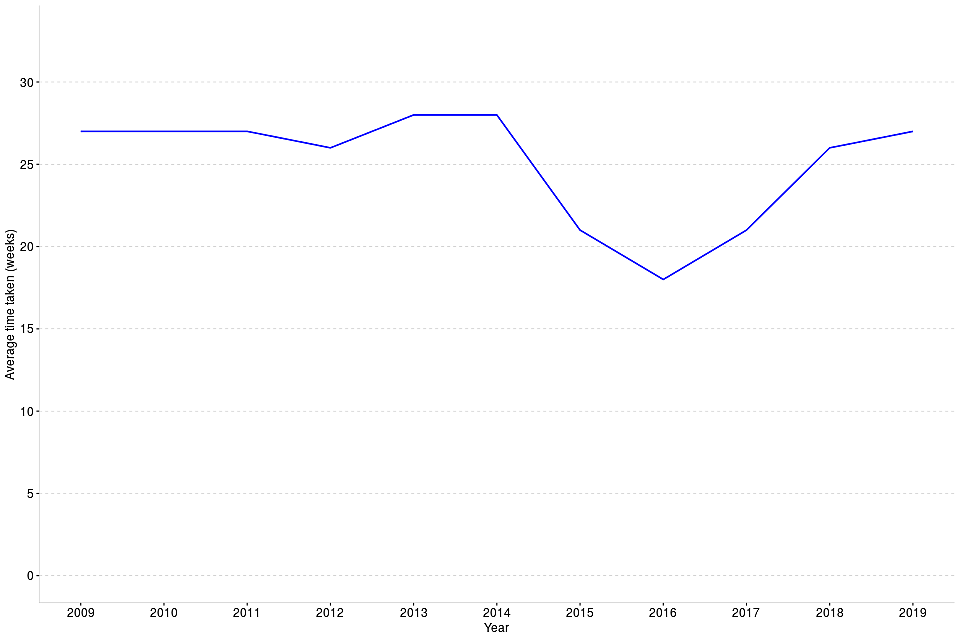
Average time taken to process an inquest (in weeks), 2009-2019
Map 3: Estimated average time taken to process inquests, England and Wales, 2019
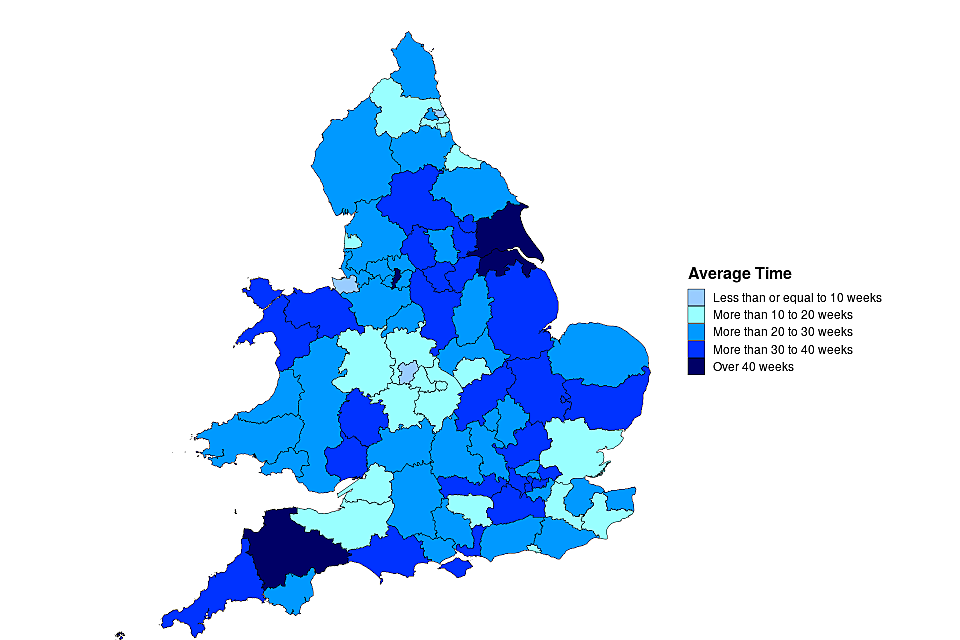
Estimated average time taken to process inquests, England and Wales, 2019
11. Treasure and Treasure Trove
There was a 6% increase in Treasure finds[footnote 16] reported in 2019 and a 11% decrease in inquest conclusions into finds
1,061 finds were reported to coroners in 2019, an increase of 62 on 2018. 380 inquests were concluded into finds. Of these, 92% (349) returned a verdict of treasure, an increase in proportion by three percentage points when compared to 2018.
In 2019, 1,061 finds were reported and 380 inquests were concluded. There were no inquests held into Treasure Trove in 2019 (relating to finds made before the Treasure Act 1996 came into force), however it is likely that a few such inquests will continue to be held from time to time.
The number of finds reported has historically been steadily increasing since the commencement of the 1996 Act in September 1997, from 54 finds in 1997 to 1,059 in 2017, before decreasing to 999 in 2018. In 2019, the number of finds rose to 1,061 (up 6%). This appears to be a return to the rising trend.
Of those 380 inquests concluded in 2019, 92% (349) returned a verdict of treasure, an increase in proportion by three percentage points when compared to 2018.
Figure 9: Finds reported to coroners, treasure inquests held under the Treasure Act, and proportion of Treasure verdicts returned, 2009-2019 (Source: Table 10)[footnote 17]
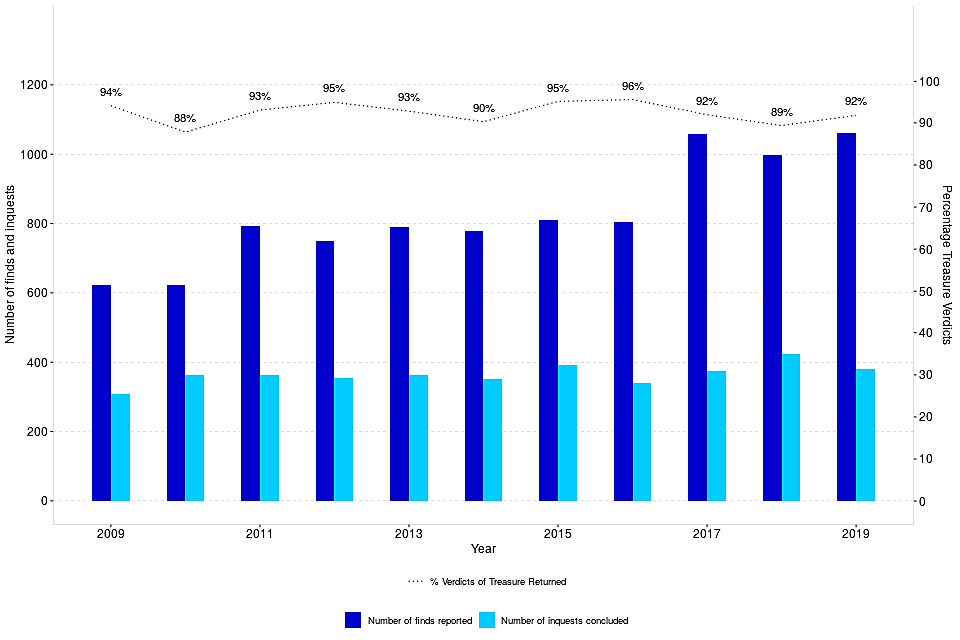
Finds reported to coroners, treasure inquests held under the Treasure Act, and proportion of Treasure verdicts returned, 2009-2019
The number of finds and inquests held varies greatly across the country, most likely due to geographical and historical differences between areas. In 2019, 23 coroner areas had no treasure finds reported to them, whilst Lincolnshire had the highest number of treasure finds at 89. Map 4 shows treasure finds across England and Wales in 2019. More information about the duties of coroners to investigate treasure found within their jurisdiction and the provisions of the Treasure Act 1996 (and the previous Treasure Trove provisions) can be found in the supporting guidance.
Map 4: Number of treasure finds reported to coroners, England and Wales, 2019
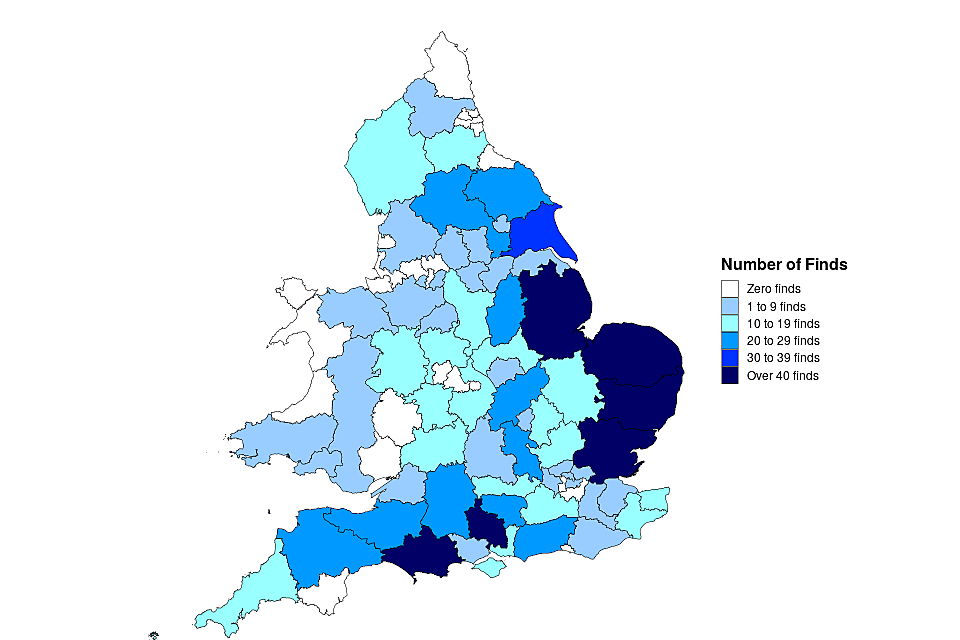
Number of treasure finds reported to coroners, England and Wales, 2019
12. Annex A: Details of recent Coroner Area amalgamations
The following table summarises the coroner area amalgamations that have occurred during 2018. There were no amalgamations in 2019. For a list of all historical amalgamations and changes to coroner areas, please refer to the supporting guidance document.
| Date effective | Previous Coroner Area | New Coroner Area | Nature of merge |
|---|---|---|---|
| 01-Aug-18 | Teesside; Hartlepool | Teesside and Hartlepool | 2 into 1 |
13. Annex B: Further analysis of deaths reported to coroners
In 2019 the number of deaths reported to coroners as a proportion of registered deaths varied widely across coroner areas, from 23% in North Yorkshire (Western) to 98% in Manchester City
The number of deaths reported to coroners in 2019 varied by coroner area – from 277 in City of London to 6,781 in Nottinghamshire. The number of deaths reported in each area will be affected by its size, population and demographic breakdown so comparisons of deaths reported to the coroner across coroner areas should be treated with caution.
When looking at the number of deaths reported to coroners in 2019 as a proportion of registered deaths[footnote 18], which allow for some differences in population characteristics, there is still a wide variation across coroner areas, with a minimum of 23% in North Yorkshire (Western) compared to the maximum of 98% in Manchester City. However, caution should be taken when using these figures as local area factors can influence these proportions. For example, large hospitals near boundary lines can impact the proportion, due to the difference between the coroners’ figures being based on the place of death and the ONS figures being based on the place of residence. The high proportion in Manchester City is due to the low levels of residence and high level of commuters.
Figure 10: Deaths reported to coroners in 2019 as a proportion of registered deaths (Source: Table 11)[footnote 19] [footnote 20]
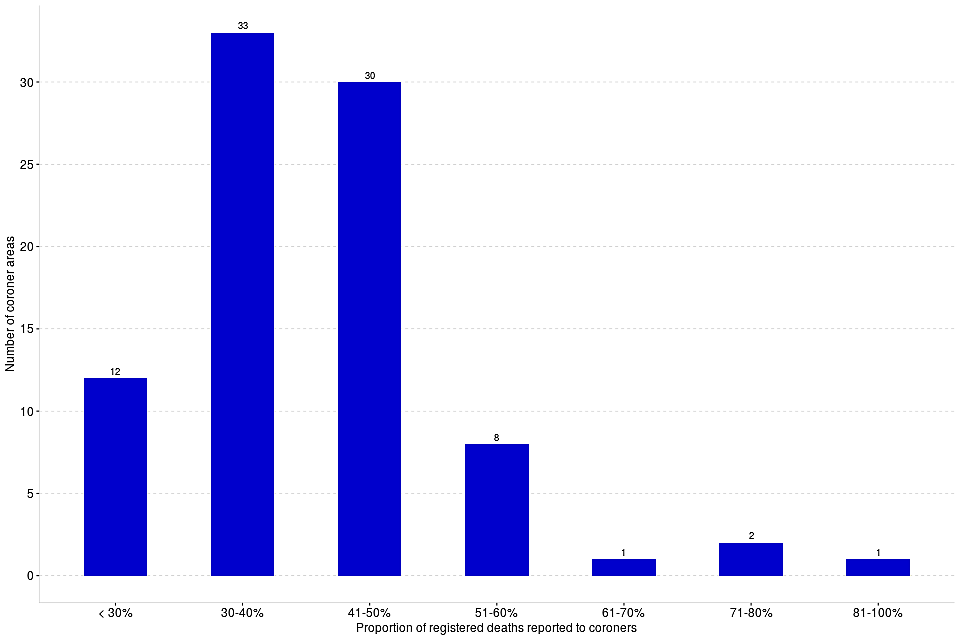
Deaths reported to coroners in 2019 as a proportion of registered deaths
13.1 Further Information
Revisions to statistics for previous years
The estimated figure for the number of registered deaths in 2018 which was derived from monthly data for the purposes of Table 2 in last year’s edition of this bulletin has now been replaced by the annual figure published by the Office for National Statistics. The 2018 number of deaths in residents of probation approved premises figure has been revised in this edition, as an error was found in Staffordshire South’s 2018 figure (which would also affect the total deaths in state detention figure), after the publication of the Coroner Statistics 2018.
Symbols and rounding convention
Within the ‘Main Points’ sections, figures greater than 1,000 are rounded to the nearest 100. The following symbols have been used throughout the tables in this bulletin:
| n/a | = | Not applicable |
| - | = | Zero |
| .. | = | No data available |
| (p) | = | Provisional Data |
| (r) | = | Revised Data |
Accompanying files
-
This publication should be read alongside the statistical tables which accompany it.
-
There is also a supporting comma-separated values file (CSV) to allow users to carry out their own analysis.
-
In addition to the bulletin and tables, we have published a coroners’ statistical tool. The tool provides easier access to local level data and allows the user to compare up to four areas of interest, for example, it is possible to compare a coroner area with a geographical region, England and/or Wales.
-
The accompanying guide to coroner statistics provides a more detailed overview of coroners; including the functions of coroners and the chief coroner, policy background and changes, statistical revision policies, and data sources and quality. It also includes a glossary with brief definitions for some commonly used terms.
-
The quality statement published with this guide sets out our policies for producing quality statistical outputs for the information we provide to maintain our users’ understanding and trust.
National Statistics Status
National Statistics status means that official statistics meet the highest standards of trustworthiness, quality and public value.
All official statistics should comply with all aspects of the Code of Practice for Official Statistics. They are awarded National Statistics status following an assessment by the Authority’s regulatory arm. The Authority considers whether the statistics meet the highest standards of Code compliance, including the value they add to public decisions and debate.
It is the Ministry of Justice’s responsibility to maintain compliance with the standards expected for National Statistics. If we become concerned about whether these statistics are still meeting the appropriate standards, we will discuss any concerns with the Authority promptly. National Statistics status can be removed at any point when the highest standards are not maintained, and reinstated when standards are restored.
Contact
Press enquiries should be directed to the Ministry of Justice or HMCTS press office:
Sebastian Walters (MoJ) - email: Sebastian.Walters@justice.gov.uk
Other enquiries about these statistics should be directed to the Justice Statistics Analytical Services division of the Ministry of Justice:
Carly Gray - email: CAJS@justice.gov.uk
Next update: Thursday 13th May 2021
URL: www.gov.uk/government/collections/coroners-and-burials-statistics
© Crown copyright Produced by the Ministry of Justice
For any feedback on the layout or content of this publication or requests for alternative formats, please contact cajs@justice.gov.uk
-
Provisional figure based on ONS monthly death registration figures for 2019: https://www.ons.gov.uk/peoplepopulationandcommunity/birthsdeathsandmarriages/deaths/datasets/monthlyfiguresondeathsregisteredbyareaofusualresidence ↩
-
These data only represent deaths in custody which were referred to a coroner and subsequently reported to the Ministry of Justice in the coroner’s annual return. ↩
-
For further detail please see Figure 23 of ‘Monitoring the Mental Health Act in 2018/19’, available at the following link: https://www.cqc.org.uk/sites/default/files/20200206_mhareport1819_report.pdf ↩
-
Schedule 1 to the Coroners and Justice Act 2009 states that the coroner should adjourn an inquest in the event that criminal proceedings may or will take place. ↩
-
For years 2007-2013 this includes the previously used conclusions “Dependence on drugs” and “Non-dependence on drugs” ↩
-
An analysis on unclassified conclusions can be found in the Coroners Statistics 2012 publication (Annex A), available at: www.gov.uk/government/statistics/coroners-statistics ↩
-
Note that Ceredigion has been excluded from this analysis due to a disproportionately low number of inquest conclusions (26) distorting the trend. ↩
-
Total percentages may not equal 100% due to rounding ↩
-
‘All other conclusions’ includes: Killed lawfully; Killed unlawfully; Attempted or self-induced abortion; Cause of death aggravated by lack of care or self-neglect; Stillborn and represent together less than 1% of the short-form conclusions recorded. ↩
-
The sex of the deceased is based on the ‘registrable particulars’ which coroners have a duty to record. Deaths certificates only gives two options, ‘male’ and ‘female’, and these will normally be completed by the registrar based on the information given to them by the informant. Under normal circumstances there would not be an investigation to ascertain whether what the informant says corresponds to biological sex or DNA of the deceased. ↩
-
Killed lawfully and stillborn were excluded from above, as there was only 4 and 5 such inquest conclusions in 2019 respectively. ↩
-
ONS data is available online at: www.ons.gov.uk/peoplepopulationandcommunity/birthsdeathsandmarriages/deaths/datasets/deathsregisteredinenglandandwalesseriesdrreferencetables ↩
-
The ‘age not known’ category has been excluded from the chart due to small numbers (less than 0.5%). Totals may not add up to 100% due to rounding. ↩
-
A direct average of the time taken to process an inquest cannot be calculated from the summary data collected; an estimate has therefore been made instead. Please see the Guide to the Coroners statistics published alongside this report. ↩
-
Only deaths occurring within England and Wales are included in this estimation. ↩
-
The latest Department for Digital, Culture, Media & Sport (DCMS) figures are for 2018 and showed there was a fall to 1,090 finds reported in England and Wales, in line with the fall to 999 treasure finds reported to Coroner Areas in 2018. These figures can be found at: https://www.gov.uk/government/statistics/statistical-release-for-reported-treasure-finds-2017-and-2018 ↩
-
This chart does not include reported findings under “Treasure Trove” ↩
-
As the ONS death registration figures are based on the area of usual residence whereas the coroners’ figures are based on the area where a person died, these figures should be used with caution. For example, the coroner office for the City of London shows a distorted figure above 100% due to the low level of residence and high level of commuters. ↩
-
Provisional figure based on ONS monthly death registration figures for 2019 ↩
-
City of London has been excluded from this analysis due to the percentage of deaths being greater than 100% - please see footnote 18 above for further information. So only 87 coroner areas have been included in this analysis. ↩