Civil Justice Statistics Quarterly: April to June 2020
Published 3 September 2020

© Crown copyright 2020
This publication is licensed under the terms of the Open Government Licence v3.0 except where otherwise stated. To view this licence, visit nationalarchives.gov.uk/doc/open-government-licence/version/3 or write to the Information Policy Team, The National Archives, Kew, London TW9 4DU, or email: psi@nationalarchives.gov.uk.
Where we have identified any third party copyright information you will need to obtain permission from the copyright holders concerned.
This publication is available at https://www.gov.uk/government/statistics/civil-justice-statistics-quarterly-april-to-june-2020/civil-justice-statistics-quarterly-april-to-june-2020
1. Main Points
| Covid-19 and associated actions have had a significant impact on all civil claims | A significant decrease in all types of civil justice actions has occurred in the current quarter, with figures dropping to unprecedentedly low levels. This reduction in claims is linked to Covid-19 measures undertaken by the courts. As a result, the data is unlikely to be representative of general trends in civil actions. |
| Decrease in County Court claims driven by specified money claims | In April to June 2020, County Court claims were down 75% on the same period in 2019, to 118,000. Of these, 77,000 were specified money claims (down 79%). |
| Unspecified money claims were also down 37% to 19,000 | The decrease in unspecified money claims was driven by a decrease in Personal Injury claims (down 42% to 16,000). |
| The number of claims defended and number of trials has decreased | There were 46,000 claims defended (down 39%) and 4,200 claims that went to trial in April to June 2020 (down 72%). |
| Mean time taken from claim to hearing has increased | The mean time taken for small claims and multi/fast track claims to go to trial was 41.8 weeks and 61.9 weeks, 5.2 weeks and 2.9 weeks longer than the same period in 2019 respectively. |
| Judgments were down 78% whilst default judgments were down 78% | Judgments were down 78% (to 68,000) in April to June 2020, compared to the same period in 2019; with 86% of these being default judgments. |
| 3,700 enforcement applications and 6,100 enforcement orders made | Enforcement applications were down 83% while enforcement orders were down 65%. |
| 2,400 warrants were issued | Warrants issued were down 97% when compared to same quarter in 2019 - driven by a decrease in warrants of control. |
| 1,400 judicial review applications in 2020 to date | There were 1,400 Judicial Reviews in the first half of 2020, down 17% on the same period in 2019. Of the 650 cases in 2020 that reached the permission stage, 88 (13%) were found to be ‘totally without merit’. |
This publication gives civil county court statistics for the latest quarter (April to June 2020), compared to the same quarter of the previous year. The judicial review figures cover the period up to April to June 2020. For more details, please see the supporting document.
Statistics on the Business and Property Court for England and Wales have also been published alongside this quarterly bulletin as Official Statistics. For technical detail, please refer to the accompanying support document.
For general feedback related to the content of this publication, please contact us at: CAJS@justice.gov.uk
2. Statistician’s comment
The impacts of Covid-19 can be seen in the low volume of cases across all Civil Justice data this quarter. During the initial Covid response, administrative and judicial resource was a significant challenge, resulting in a number of courts suspending operations for a period. This led to unprecedented falls in volumes, and significant changes to timeliness measures. To help the system cope with demand, additional venues – referred to as Nightingale courts have been provided to add temporary capacity to hear cases, and help the court and tribunal system to run as effectively and safely as possible during the coronavirus outbreak.
As society and the economy begins to recover from the impact of Covid-19, it is expected that claims volumes will return to historic trend levels, and may even temporarily exceed the pre-covid-19 volumes as the backlog of claims is processed. We are working with representative bodies to understand the expected demand and will continue to monitor future trends in both volumes and timeliness.
While these statistics are still believed to be of interest to the public, it is worth noting that the significantly reduced volumes of claims being registered mean that the data is unlikely to be representative of general trends in civil actions.
Caution should therefore be used when interpreting and applying these figures.
3. Claims Summary
County court claims were down 75% on the same quarter of 2019, driven by money claims.
There were 118,000 County Court claims lodged in April to June 2020. Of these, 96,000 were money claims (down 76% from April to June 2019).
Non-money claim volumes were at 21,000, down 67% when compared to the same quarter last year.
Mortgage and landlord possession claims were down 90% over the same period to 3,200, ‘other non-money claims’ were down 41% to 17,000 and claims for return of goods were down 77% to 700.
Figure 1: County Court claims by type, Q2 (April to June) 2015 to Q2 (April to June) 2020 (Source: table 1.2)
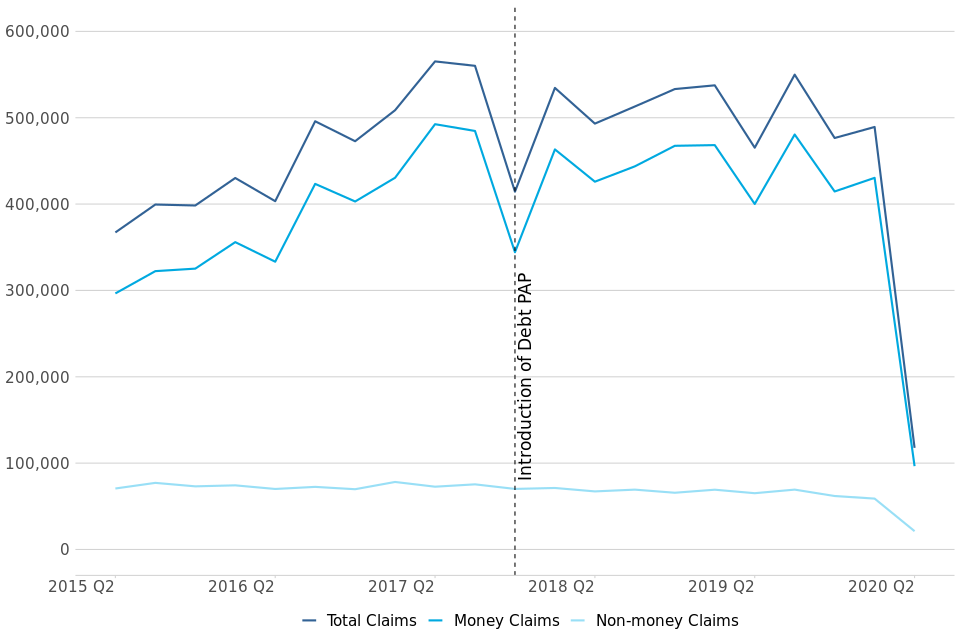
County Court claims by type, Q2 (April to June) 2015 to Q2 (April to June) 2020
In the most recent quarter, total claims were down 75% compared to the same period in 2019 (from 465,000 to 118,000). Of these, 96,000 were money claims, down 76% from April to June 2019 (from 400,000). Money claims made up 82% of all claims in April to June 2020 in comparison to 86% of total claims in April to June 2019 (down 4pp).
Prior to the current quarter, County Court claims had been generally increasing from 2015, reaching a peak of 565,000 claims in April to June 2017. This increase was driven by a rise in money claims, which make up the majority of claims received. Across the last few quarters, claim volumes have been relatively unchanged but volatile, with this volatility driven by a few “bulk issuers” slowing down and then ramping up their volume of claims. These issuers have noticeably slowed down their claim volumes following the outbreak of Covid 19.
Non-money claims have been generally decreasing since 2015. However, they have shown less of an impact following Covid-19 in contrast to money claims. In the current quarter, these claims were down 67% (from 65,000 to 21,000) compared to the same period in 2019, the lowest in the time series.
Within non-money claims, ‘other’ non-money claims have shown a decline since 2018. In the most recent quarter, ‘other’ non-money claims were down 41% (from 29,000 to 17,000) compared to the same period in 2019.
The overall trend in Mortgage and Landlord Possession claims has been decreasing since a peak of 60,000 in January to March 2014. There were 3,200 claims in April to June 2020, down 90% compared to the same quarter of 2019 (33,000 claims). This decrease has been driven by a fall in all claims types since March 2020 due to actions following Coronavirus (COVID-19). Further details can be found in the Mortgage and Landlord Possessions publication annex here.
Claims for return of goods increased steadily to a high of over 3,000 in April-June 2019, with this trend stabilising in recent quarters. This quarter, as for other claim types, claims for return of goods were down 77% (from 3,000 to 700) in April to June 2020 compared to the same period in 2019.
3.1 County court claims by month and 5-year average
Claims for quarters 1 and 2 of 2020 – which covers the peak Covid-19 period, have been shown by month (figure 2) to further examine the impact of Covid-19 and related actions on claim volumes in county courts.
Figure 2: Monthly county court claims by type, January-June 2019 and 2020, and 5-year average
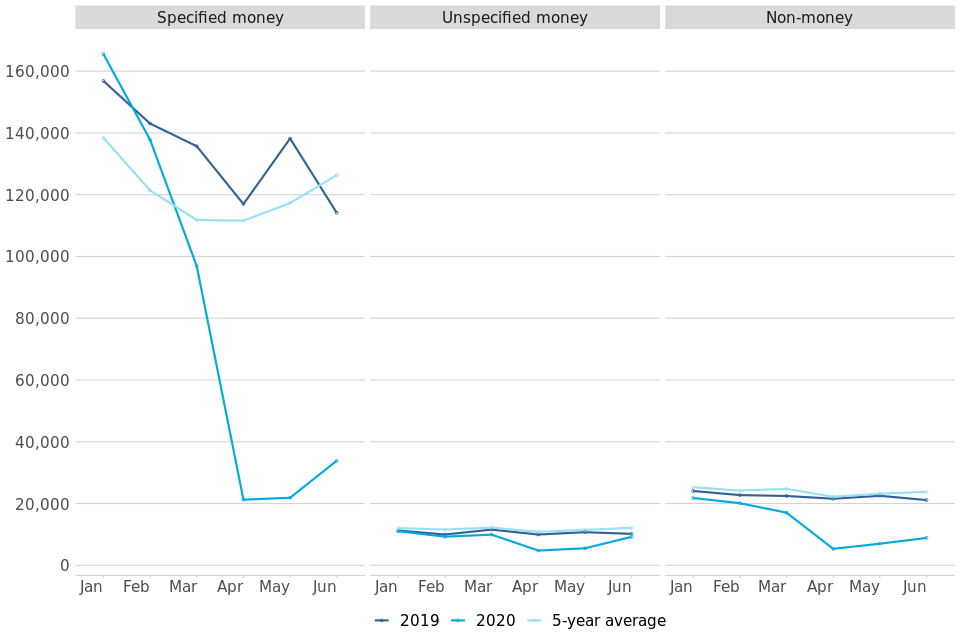
Monthly county court claims by type, January-June 2019 and 2020, and 5-year average
A pronounced trend is visible for specified money claims; while January and February showed little change in comparison to previous years, March was already down 29% on 2019 and down 13% on the five-year average; this coincides with wide-scale closure of courts[footnote 1] across England and Wales as a result of Covid-19, and many bulk claim issuers “pausing” new claims following guidance from the FCA[footnote 2].
Specified claim volumes fell further in April and May with just 21,000 and 22,000 claims respectively (down more than 80% on the five year average in both cases). However, a significant uptick was seen in June, with 34,000 claims. This may represent the start of the recovery of claim volumes, although it is noteable that this is still down 73% on the 5-year average.
Unspecified money claim volumes did not see such a significant decline; at the lowest points this reached 4,800 claims in April, down 56% on the five-year average. By June, as for specified money claims a recovery has been seen, with claim volumes only down 24% on the five year average.
4. Money Claims
Specified money claims were down 79% (to 77,000 claims) in April to June 2020 compared to the same quarter in 2019, driving the overall trend in money claims.
Specified money claims of up to (and including) £1,000 were down 87% over this period to 32,000, driving the overall trend in specified money claims.
Unspecified claims were down 37% to 19,000, driven by a fall in personal injury claims (down 42% to 16,000) compared to the same quarter in 2019.
Personal Injury claims accounted for 84% of all unspecified money claims in the most recent quarter, down 7pp on April to June 2019, when they accounted for 91% of all claims.
Historically, specified money claims reached a peak in October to December 2017, at which point the implementation of the Pre-Action Protocol (PAP) for Debt Claims in October 2017 led to a sharp drop in claims. An increasing trend resumed the following quarter, suggesting that the impact of the PAP on claim volumes was temporary. The main aim of the protocol is to encourage early engagement between parties to resolve disputes without needing to start court proceedings. In the most recent quarter (April to June 2020), there were 77,000 claims, down 79% on the same quarter in 2019 (369,000 claims).
This quarter, the majority (57%) of specified money claims were processed and issued at the County Court Business Centre (CCBC). There were 44,000 such claims at the CCBC in April to June 2020 (down 86% on the same quarter in 2019). CCBC claims have been particularly affected by Covid-19 and associated actions, showing a more significant decrease than other specified money claims, and making up a smaller proportion of specified money claims than in previous quarters (for example, making up 83% of specified money claims in April to June 2019). This is as a result of bulk issuers almost completely ceasing their issue during the immediate response to the pandemic, with these volumes expected to slowly increase over the coming months.
The change in specified money claims is driven by lower value claims (up to and including £1,000). These were down 87% in the period April to June 2020, compared to 2019, to 32,000 claims and account for just 41% of total specified money claims in the most recent quarter. This is a significant decline, with this category making up 66% of total specified money claims in April to June 2019. When compared to the same quarter in the previous year, the next claim band (above £1,000 up to and including £5,000) was less significantly affected, down 68% to 32,000 claims. As a result, this value bracket made up 41% of total specified money claims in the most recent quarter, compared to just 26% in April to June 2019.
Figure 3: Specified money claims by monetary value, Q2 (April to June) 2015 to Q2 (April to June) 2020 (Source: civil workload CSV)

Specified money claims by monetary value, Q2 (April to June) 2015 to Q2 (April to June) 2020
Prior to this quarter, unspecified money claims have fluctuated between 30,000 and 40,000 claims each quarter over the last five years (since April to June 2015). More recently, the volumes were down 37% in April to June 2020 compared to the same period in 2019 (from 31,000 to 19,000). This was driven by personal injury claims, down 42% from 28,000 to 16,000. This is unsurprising given movement restrictions during the Covid-19 lockdown period, and a corresponding decline in the number of road traffic accidents.
4.1 Allocations (table 1.3)
In April to June 2020, 23,000 money claims were allocated to track, down 48% (from 44,000) on the same period in 2019. A decrease was seen across all tracks, with fast-track allocations showing the largest decline. Compared to April to June 2019, of these allocations:
- 14,000 were allocated to small claims, down 44% on April to June 2019. This accounts for 63% of all allocations (compared to 58% of all allocations in the same quarter of 2019);
- 6,700 were allocated to fast track, down 55% on April to June 2019. This accounts for 29% of all allocations (compared to 34% of all allocations in the same quarter of 2019);
- 1,800 were allocated to multi-track, down 43% on April to June 2019. This accounts for 8% of all allocations (compared to 7% of all allocations in the same quarter of 2019);
5. Defences (including legal representation) and Trials
The number of claims defended was down 39% to 46,000 compared to the same quarter in 2019.
Of those claims defended, 65% had legal representation for both claimant and defendant, 16% had representation for claimant only, and 4% for defendant only.
The number of trials was down 72% to 4,200 compared to the same quarter in 2019
Average time taken for small claims was 41.8 weeks (5.2 weeks longer than compared to the same quarter in 2019) and for multi and fast track claims it was 61.9 weeks (2.9 weeks longer than April to June in 2019).
Of those claims defended in April to June 2020, 65% had legal representation for both claimant and defendant, 16% had representation for claimant only, and 4% for defendant only. Almost all (96%) unspecified money defences had legal representation for both the defendant and claimant, compared with 47% of specified money defences.
Changes in representation compared to the same quarter last year is influenced by two factors. Firstly, there was a larger fall in specified money claim volumes in comparison to unspecified money claims, with the latter being more likely to have representation for both parties. Secondly, the representation for specified money defences has also increased, with 47% having representation for both parties, in comparison to 37% in the same quarter last year. This is likely as a result of Covid-19 actions; debt-related specified claims are more likely to be unrepresented, and as many of these ceased, those cases that did get issued are more likely to be those that are represented. It is unlikely that this increase represents a more general trend of increasing representation for specified money defences.
Figure 4: Proportion of civil defences and legal representation status, April to June 2020 (Source: table 1.6)
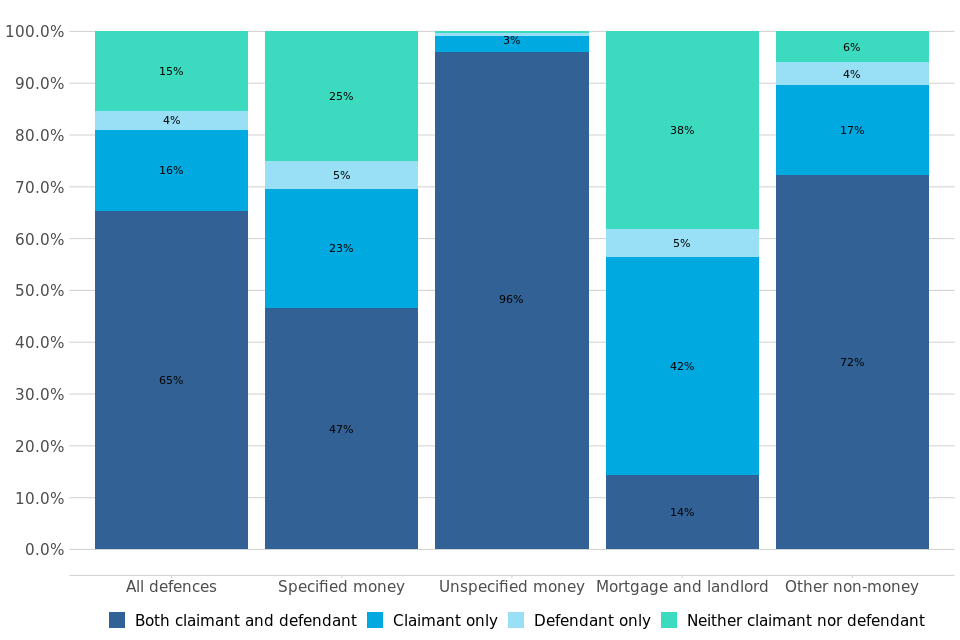
Proportion of civil defences and legal representation status, April to June 2020
The total number of claims defended was down 39% in April to June 2020 compared to the same quarter in 2019, from 74,000 to 46,000 cases. This was driven by decreases across all claim types, with the most significant impact from specified money claims being defended (down 40% from 45,000 to 27,000). However, it should be noted that this fall in specified money claims defended (down 40%) is much less than the fall in specified money claims issued (down 79%).
Figure 5: Monthly county court claims defended, January-June 2019 and 2020, and five year average
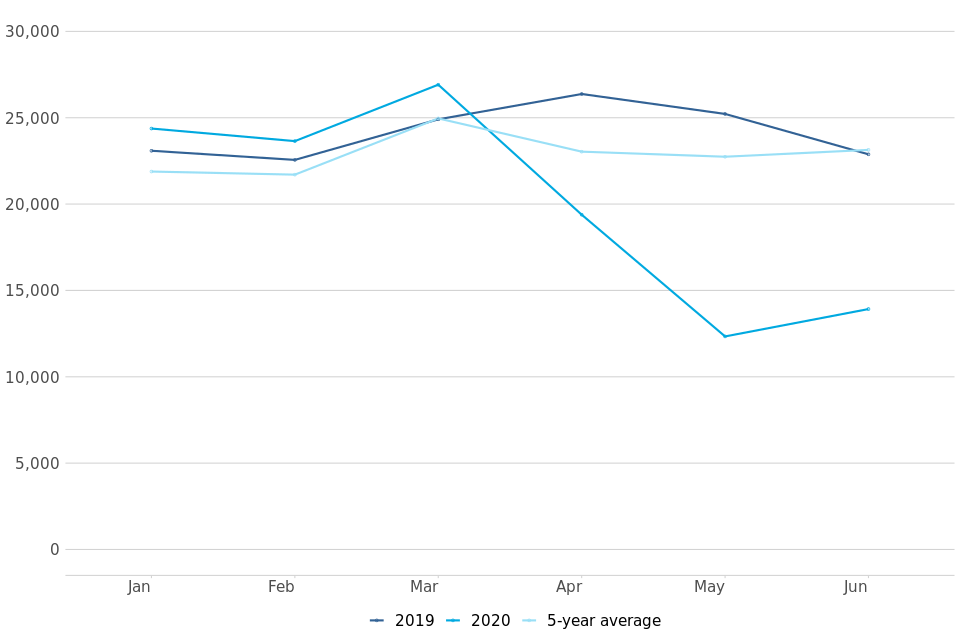
Monthly county court claims defended, January-June 2019 and 2020, and five year average
As for claims, a monthly breakdown of claims defended shows variance throughout the past two quarters. March defence volumes were up 8% in comparison to the five year average, with the time taken from claim to defence meaning that the initial decline in defence volumes is not seen until April, where claims defended were down 16%. A more significant fall was observed in May, with claims defended down 46% to 12,000 defenses, before a slight increase in June to 14,000 defenses, although it is noteable that this is still down 40% on the five-year average.
5.1 Trials and Time Taken to Reach Trial (table 1.5)
Defended cases which are not settled or withdrawn generally result in a trial. In total, there were 4,200 trials in April to June 2020, down 72% compared to the same period in 2019. Of the claims that went to trial, 3,300 (79%) were small claims trials (down 71% compared to the same quarter in 2019) and 900 (21%) were fast and multi-track trials (down 78% from the same quarter of 2019).
Figure 6: Average number of weeks from claim being issued to initial hearing date, Q2 (April to June) 2015 to Q2 (April to June) 2020 (Source: table 1.5)
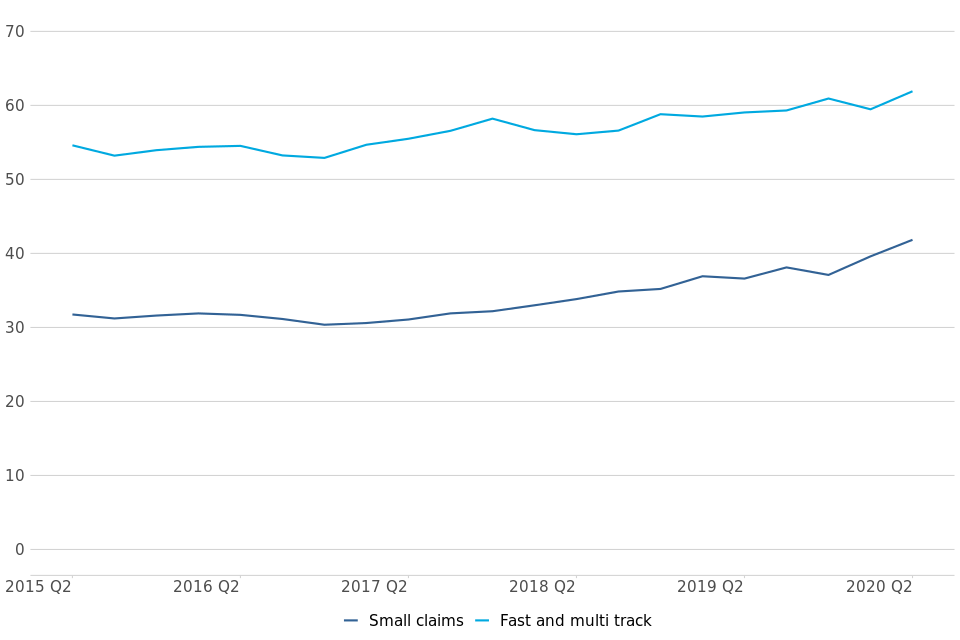
Average number of weeks from claim being issued to initial hearing date, Q2 (April to June) 2015 to Q2 (April to June) 2020
In April to June 2020, it took an average of 41.8 weeks between a small claim being issued and the claim going to trial, 5.2 weeks longer than in the same period in 2019.
For multi/fast track claims, it took on average 61.9 weeks to reach a trial, 2.9 weeks longer than in April to June 2019 – continuing to exceed the upper limit of the range 2009-2019 (52 to 61 weeks).
Covid-19 and associated actions have led to an uptick in time taken for all claims to reach trial. However it should be noted that this timeliness is calculated from a significantly reduced volume of cases, and is not necessarily representative of a trend. Prior to this, a sustained period of increasing receipts has increased the time taken to hear civil cases and caused delays to case progress. Additional venues have been provided to add temporary capacity to hear cases, and help the court and tribunal system to run effectively.
6. Judgments
Judgments were down 78% compared to same quarter in 2019
There were 68,000 judgments made in April to June 2020, in comparison to 304,000 in the same quarter of 2019. Of these judgments, 59,000 (86%) were default judgments.
Figure 7: All claims, judgments and default judgments, Q2 (April to June) 2015 to Q2 (April to June) 2020 (Source: tables 1.2 and 1.4)
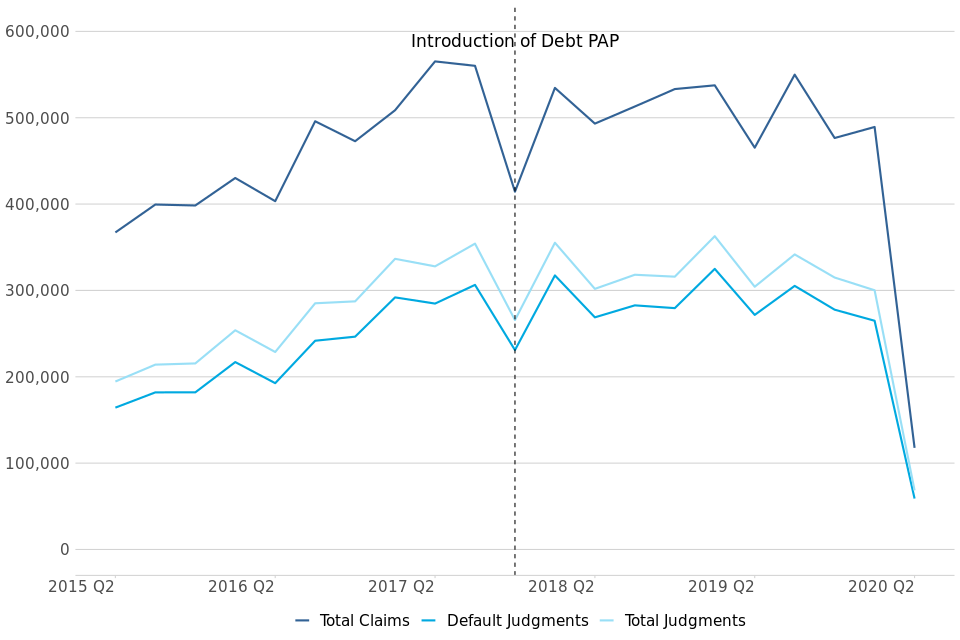
All claims, judgments and default judgments, Q2 (April to June) 2015 to Q2 (April to June) 2020
There were 68,000 judgments made in April to June 2020, down 78% compared to the same quarter of 2019. Of these, 86% were default judgments. The number of default judgments was down 78% (from 272,000 to 59,000) on April to June 2019.
The second largest type of judgment was ‘judge’, of which there were 4,800 in April to June 2020, down 59% on the same quarter in 2019 (from 12,000). ‘Judge’ judgments accounted for 7% of all judgments.
7. Warrants and Enforcements
Warrants issued were down 97% when compared to same quarter in 2019
In April to June 2020, 2,400 warrants were issued, down 97% from 93,000 in the same quarter of 2019. Of these, 2,100 (86%) were warrants of control, down 97% compared to the same period in 2019.
Enforcement applications were down 83% and enforcement orders were down 65% when compared to April to June 2019
All application categories were down on April to June 2019. Attachment of earnings (AoE) applications were down 87% (from 14,000 to 1,800), while AoE orders were down 79% (from 7,800 to 1,700).
Figure 8: Warrants and enforcements issued – Q2 (April to June) 2015 to Q2 (April to June) 2020 (Source: tables 1.7 and 1.8)
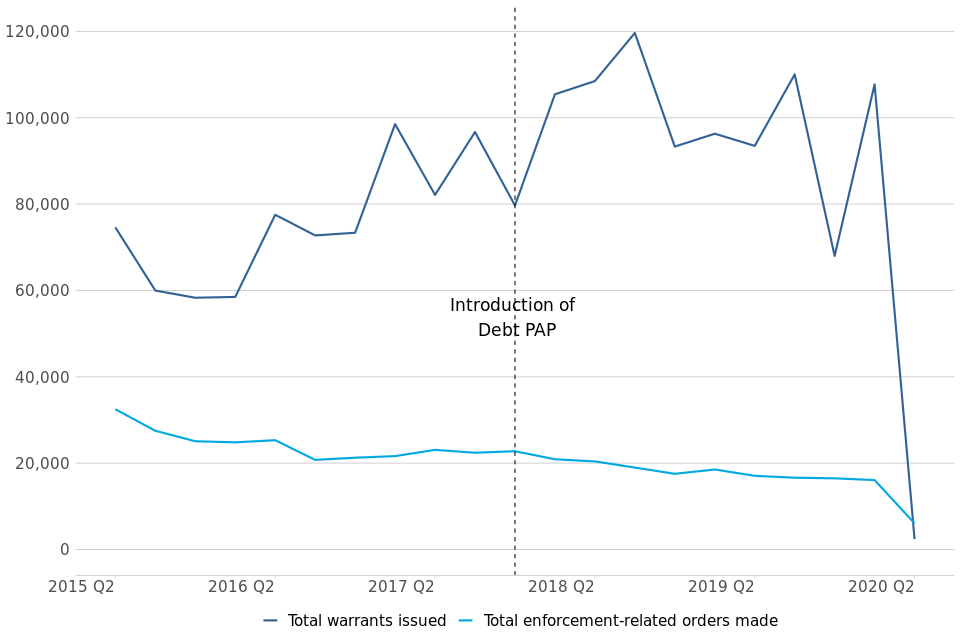
Warrants and enforcements issued – Q2 (April to June) 2015 to Q2 (April to June) 2020
7.1 Warrants (table 1.7)
In the latest quarter (April to June 2020) there were 2,400 warrants issued, down 97% (from 93,000) on the same quarter in 2019. While this decline is as a result of Covid-19 and related actions, a decline was also seen in previous quarters, with generally low numbers seen across the whole of 2019.
Figure 9: Monthly warrants issued by type, January-June 2019 and 2020, and five year average
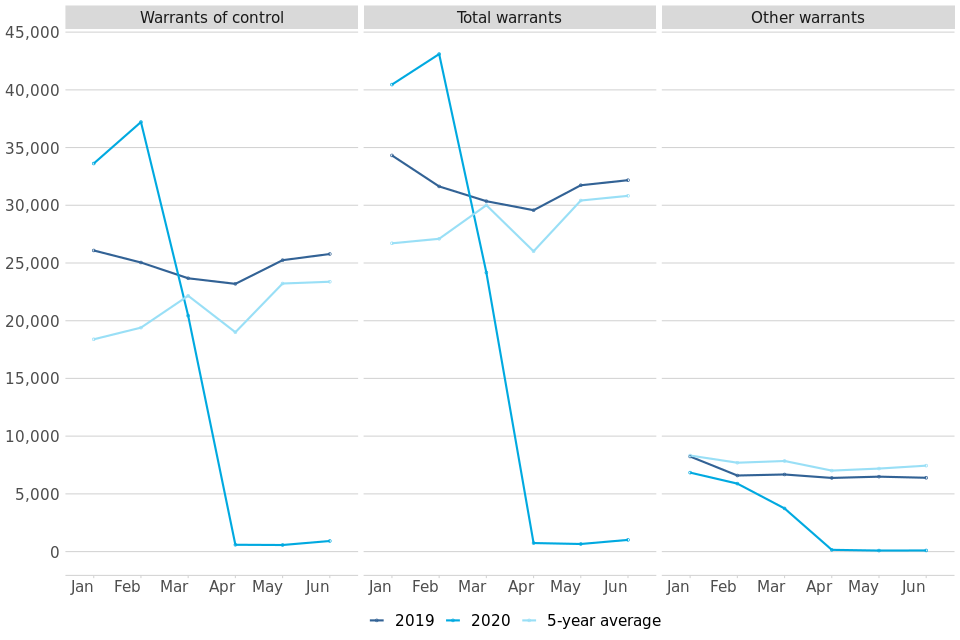
Monthly warrants issued by type, January-June 2019 and 2020, and five year average
A monthly breakdown of warrants issued shows a particularly sharp decline following the impact of Covid-19. While volumes of all warrants issued in January and February were high (up 51% compared to the 5-year average for January and up 59% for February), a significant decline was seen in March (down 19%). This was then followed by a further decline in April to just 740 warrants (down 97% on the five year average). Volumes remained similarly low for both May and June (660 and 1,000 warrants issued respectively), still down 97% on the five-year average.
7.2 Enforcements (table 1.8)
In April to June 2020, there were 3,700 enforcement-related order applications (which include attachment of earnings orders, charging orders, third party debt orders, administration orders, and orders to obtain information), down 83% compared to the same quarter of 2019. All application types were down, in particular attachment of earnings (AoE) applications, which were down 87% (from 14,000 to 1,800).
There were 6,100 enforcement-related orders made in April to June 2020, down 65% compared to the same quarter of 2019. As for applications, orders fell across all order types, with the decrease driven by AoE orders, which were down 79% (from 7,800 to 1,700).
Over the longer term, there has been a decreasing trend in enforcement-related applications received and orders made since 2009, possibly due to claimants’ preference for using warrants instead to retrieve money, property or goods.
8. Judicial reviews[footnote 3]
Of the 1,400 applications received in the first half of 2020, 38% have already closed, and 88 were found to be ‘Totally Without Merit’ (13% of cases that reached the permission stage).
There were 1,400 judicial review applications received so far in 2020, down 17% on the same period in 2019. In 2019, there were 3,400 applications received in total, down 6% on 2018 (from 3,600).
Figure 10: Annual Judicial Review Applications, by type; calendar year 2010-2019 (Source: table 2.1)
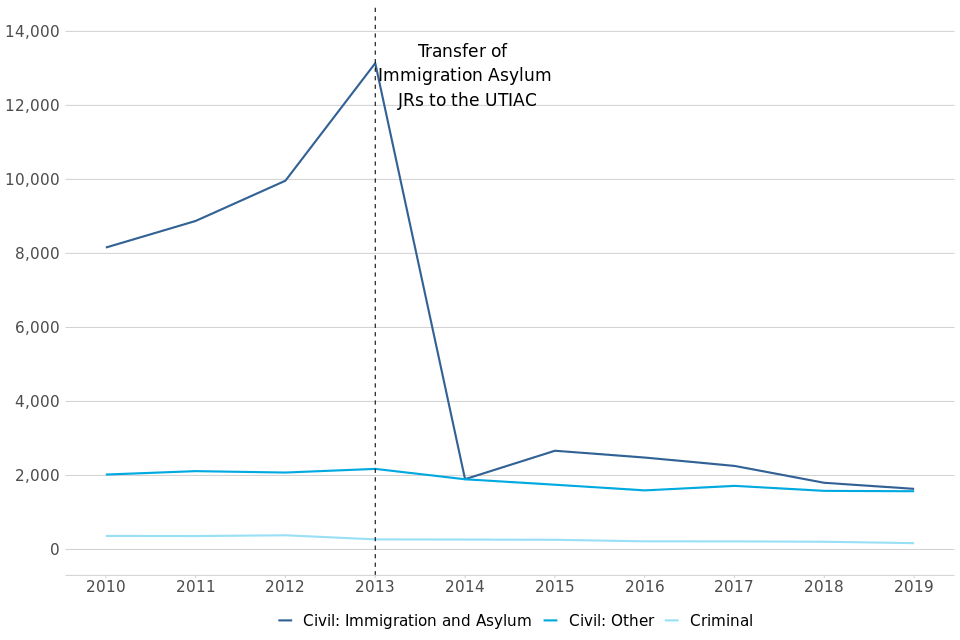
Annual Judicial Review Applications, by type; calendar year 2010-2019
Of the 1,400 applications received in the first half of 2020, 550 were civil immigration and asylum applications, 820 were civil (other), and 82 were criminal, down 38%, up 4% and up 14% respectively on the same period of 2019. 16 of the civil immigration and asylum cases have since been transferred to the UTIAC.
Of the applications that were made in the first half of 2020, 38% are now closed. Of the total applications, 650 reached the permission stage within the first half of 2020, and of these:
- 13% (88) were found to be totally without merit (TWM).
- 170 cases were granted permission to proceed and 470 were refused at the permission stage. However, 12 of cases refused at permission stage went on to be granted permission at the renewal stage.
- 180 of the 2020 cases have been assessed to be eligible for a final hearing and of these, 13 have since been heard.
- For the 2020 cases, the mean time from a case being lodged to the permission decision was 63 days, up from 60 days across the same period of 2019. The mean time from a case being lodged to final hearing decision was 99 days, similar to the same period of 2019.
Future quarterly bulletins will give more insight into the 2020 cases, as they work their way through the system.
9. Privacy Injunctions[footnote 4]
In the first six months of 2020, there were 5 proceedings where the High Court considered an application for a new interim privacy injunction.
Two proceedings were considered at the High Court on whether to continue or amend an interim injunction, and no proceedings were considered to issue a final permanent injunction.
There were no proceedings considered at the High Court on whether to continue or amend an undertaking, and no proceedings considered a final undertaking[footnote 5] .
Figure 11: Revised number of privacy injunction proceedings, by type of proceeding, from Aug-Dec 2011[footnote 6] to Jan-Jun 2020 (Source: tables 3.1, 3.2 and 3.3)
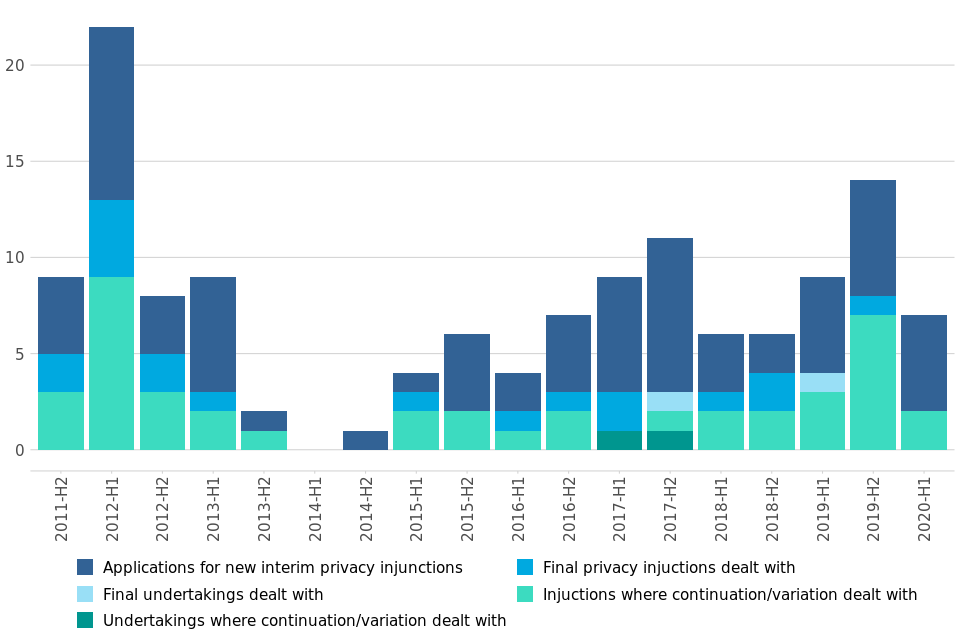
Revised number of privacy injunction proceedings, by type of proceeding, from Aug-Dec 2011 to Jan-Jun 2020
9.1 New interim privacy injunctions (Table 3.1)
Three of the proceedings at the High Court that took place in January to June 2020 were granted. In the previous six months (July to December 2019) 6 new interim privacy injunction proceedings took place, and all of these were granted.
9.2 Continuation of existing interim injunctions (Table 3.2)
The continuation of two existing interim injunction proceedings that took place in January to June 2020 were all granted/varied. In July to December 2019, the continuation of six existing interim injunctions proceeding were granted/varied, and one was discharged.
9.3 Final privacy injunctions (Table 3.3)
There were no final privacy injunctions or final undertakings dealt with in January to June 2020.
10. Further information
10.1 Provisional data and revisions
The statistics in the latest quarter are provisional and revisions may be made when the next edition of this bulletin is published. If revisions are needed in subsequent quarters, these will be annotated in the tables.
10.2 Accompanying files
As well as this bulletin, the following products are published as part of this release:
- A supporting document providing further information on how the data is collected and processed, as well as information on the revisions policy and legislation relevant to civil justice.
- The quality statement published with this guide sets out our policies for producing quality statistical outputs for the information we provide to maintain our users’ understanding and trust.
- A set of tables providing statistics on the Business and Property Courts of England and Wales.
- A set of overview tables and CSV files, covering each section of this bulletin.
10.3 Rounding convention
Figures greater than 10,000 are rounded to the nearest 1,000, those between 1,000 and 10,000 are rounded to the nearest 100 and those between 100 to 1,000 are rounded to the nearest 10. Less than 100 are given as the actual number.
10.4 National Statistics status
National Statistics status means that official statistics meet the highest standards of trustworthiness, quality and public value.
All official statistics should comply with all aspects of the Code of Practice for Official Statistics. They are awarded National Statistics status following an assessment by the Authority’s regulatory arm. The Authority considers whether the statistics meet the highest standards of Code compliance, including the value they add to public decisions and debate.
It is the Ministry of Justice’s responsibility to maintain compliance with the standards expected for National Statistics. If we become concerned about whether these statistics are still meeting the appropriate standards, we will discuss any concerns with the Authority promptly. National Statistics status can be removed at any point when the highest standards are not maintained, and reinstated when standards are restored.
10.5 Future publications
Our statisticians regularly review the content of publications. Development of new and improved statistical outputs is usually dependent on reallocating existing resources. As part of our continual review and prioritisation, we welcome user feedback on existing outputs including content, breadth, frequency and methodology. Please send any comments you have on this publication including suggestions for further developments or reductions in content.
10.6 Contacts
Press enquiries should be directed to the Ministry of Justice (MoJ) press office:
Sebastian Walters - email: sebastian.walters@justice.gov.uk
Other enquiries about these statistics should be directed to the Justice Statistics Analytical Services division of the Ministry of Justice:
Carly Gray - email: cajs@justice.gov.uk
Next update: 3 December 2020
-
https://www.gov.uk/government/news/priority-courts-to-make-sure-justice-is-served ↩
-
https://www.fca.org.uk/publications/finalised-guidance/personal-loans-coronavirus-temporary-guidance-firms ↩
-
The judicial review data are Official Statistics ↩
-
The privacy injunction data are Official Statistics ↩
-
An undertaking is different from an injunction, in that it is a promise given by the defendants, rather than an injunction which is an order of the court. ↩
-
H2 2011 only covers the period August-December 2011 and is not a full half-year ↩