Technical annex – quantitative analysis of downward mobility
Published 18 November 2020

© Crown copyright 2020
This publication is licensed under the terms of the Open Government Licence v3.0 except where otherwise stated. To view this licence, visit nationalarchives.gov.uk/doc/open-government-licence/version/3 or write to the Information Policy Team, The National Archives, Kew, London TW9 4DU, or email: psi@nationalarchives.gov.uk.
Where we have identified any third party copyright information you will need to obtain permission from the copyright holders concerned.
This publication is available at https://www.gov.uk/government/publications/changing-gears-understanding-downward-social-mobility/technical-annex-quantitative-analysis-of-downward-mobility
Technical Annex:
Quantitative Analysis of Downward Mobility
Research report
November 2020
1. Executive summary
1.1 Key summary points
Social mobility is a key priority for policymakers, with a large focus on opportunities to move up. However, for there to be relative mobility, individuals need to move down too. Downward mobility is an under-studied topic.
About 21% of men and 24% of women aged 30 to 59 are downwardly mobile in recent years.
Education plays a crucial role in determining chances of downward mobility. After accounting for other individual characteristics, including early skills and class origin, those with higher education qualifications and those with A-level or equivalent qualifications are far less likely to experience downward mobility than those with no qualifications.
Chances of downward mobility are further reduced for graduates with higher degree classifications, by studying maths or science subjects, or going on to postgraduate qualifications.
Some Black and minority ethnic groups, such as Bangladeshi, Black African and Other Asian groups, are much more likely to experience downward mobility, even after accounting for their educational qualifications and other individual characteristics. These effects are concentrated amongst those born outside the UK, which is the vast majority for adults in these groups.
Having more children increases the chances of experiencing downward mobility for women, but only has a small effect for men. While the effects of having more children have declined over time for women, the effects remain substantial demonstrating that women continue to disproportionately carry the ‘parent penalty’.
Downward mobility appears to be a largely permanent state. Of those experiencing downward mobility in a given year, about 80% remain downwardly mobile about 5 years later.
Wages are similar for those who experience downward mobility into intermediate and working-class occupations as compared with those whose parents worked in these occupations. This suggests no persistent advantage or any ‘glass floor’ in earnings for those coming from a professional background.
In sharp contrast, there is clear evidence of a ‘glass ceiling’. Individuals who move up to professional occupations experience 5% to 15% lower earnings than those who came from professional backgrounds, even after accounting for a range of other individual characteristics, such as education.
This glass ceiling effect has gotten worse over time. This upward mobility penalty seems to have increased over time for those born in 1970 compared to 1958.
2. Introduction
There has been considerable policy interest in improving social mobility in the UK. This is driven in part by well-established trends from the academic literature. In the UK over time, social mobility has remained constant in terms of movement between different occupational groups (Goldthorpe and Jackson, 2007; Goldthorpe and Mills, 2008; Goldthorpe, 2013; Bukoi and others, 2015; Bukodi and Goldthorpe, 2018). However, intergenerational income mobility has declined: incomes now are more closely related to parent’s incomes than they were for previous cohorts (Blanden and others, 2004; 2007, Gregg and others, 2017). Research to reconcile these findings concludes that differences are driven, in part, by increasing income inequalities within broad social class groupings (Blanden and others, 2013; Breen and others, 2016).
These inequalities within social classes are highlighted in the recent work on the ‘Class Pay Gap’, which shows that when comparing individuals who enter into prestigious occupations, those from lower class backgrounds are still paid 16% less than those from professional class families (Friedman and Laurison, 2019). They find a range of explanations for these within-class inequalities, including the ‘Bank of Mum and Dad’ affecting the opportunities that people can take, and sponsorship from higher-level colleagues and dominant behavioural codes encompassing differences in cultural capital.
Similarly, comparing across countries, the UK is at best average, or often worse than average in terms of international rankings, again depending on the measures used (Corak, 2013; Jerrim and Macmillan, 2015; Erikson and Goldthorpe, 1992; Breen, 2004; Hertel and Groh-Samberg, 2019). This is perhaps unsurprising, given our high levels of income inequality – many studies have shown a strong association between countries with high levels of income inequality and low levels of economic mobility across generations (Corak, 2013; Jerrim and Macmillan, 2015). Similarly, new work by Hertel and Groh-Samberg (2019) has found a strong link between countries with high levels of inequality and low levels of social fluidity. Inequalities of outcomes are therefore linked to inequalities of opportunities
Yet policy makers and politicians’ dialogue has predominately focused on the idea of helping people to experience upward mobility, neglecting the fact that in relative terms this also means that people have to move down. Here, the latest evidence on absolute class mobility in the UK highlights that the stable trends over time are masking an underlying pattern of declining upward mobility and increasing downward mobility for recent cohorts (Bukodi and others, 2015, Bukodi and Goldthorpe, 2019). This finding is largely attributed to the slow-down in the large expansion of professional and managerial careers witnessed from the 1950s to the 1980s. In this work, we investigate this phenomenon of downward mobility in greater depth, considering the nature of this type of movement (who experiences it? how prevalent is it?), before exploring the potential drivers and consequences of such movements.
We use data from a range of sources to document the nature, causes and consequences of downward mobility, using each to its strengths. Our main focus is on analysis from the Labour Force Survey (LFS), a representative survey of the UK population, including detailed data on individual occupations/earnings, education qualifications, subject of study at higher education (if attended). This data source has large sample sizes (over 50,000 households per quarter) and from 2014, it also included retrospective information on parental occupation when the respondent was age 14, enabling direct calculation of occupational mobility, and allowing for a more detailed understanding of the nature of downward mobility. This enables us to understand patterns in downward mobility for detailed ethnic groups, educational experiences, with different family compositions, across destination regions. This analysis was used to identify the types of individuals of most interest for the qualitative interviews in the main report.
We complement our LFS analysis with analysis from the 2 older British birth cohort studies, the National Child Development Study (NCDS), a cohort of all people born in one week in March 1958, and the British Cohort Study (BCS), a cohort of all people born in one week in April 1970. These surveys have been used extensively in past research in intergenerational class and income mobility. The richness of the data provides us with additional context for understanding the nature of downward mobility (including early measures of skills), while the longitudinal nature of the data allows us to explore longer term consequences of downward mobility. Finally, we also use Understanding Society, a household panel survey that followed 40,000 households from 2010 onwards, to inform our analysis of the consequences of downward mobility. As well as including retrospective questions about parental occupation when the respondent was age 14, crucially for our analysis, this data source also includes annual destination occupations and wages of respondents over the past 8 years.
The next section sets the scene, drawing on previous literature to explore what constitutes a healthy level of downward mobility, and related work on opportunity hoarding. In Section 3, we document the nature of downward mobility across our main data sources, describing its prevalence, and who experiences it, before investigating the relative contribution of various characteristics and their association with downward mobility in Section 4. Section 5 then explores the longer-term consequences of such moves. We end with a discussion of the implications of this work for future research and policy.
3. Background and context?
3.1 What is a healthy level of downward mobility?
Considering trends across countries in absolute downward mobility, Bukodi and others (2017) compare rates of downward (and upward) mobility across 30 European countries, using the European Social Survey (ESS). They note 3 groups of countries; one that experiences high levels of upward and lower levels of downward mobility, including Netherlands and Luxembourg; another that experiences high levels of downward mobility and low levels of upward mobility, typically post-socialist countries including Poland, Hungary and Russia; and the largest group, where men experience similar levels of both upward and downward mobility, in which the UK, along with France and Nordic societies feature.
The OECD (2018) report finds similar patterns, adding in non-European nations such as Australia and Canada, which feature in the group with high levels of downward and low levels of upward mobility, and the US and Korea, featuring in the group with low levels of downward and high levels of upward mobility. Both Bukodi and others (2017) and the OECD (2018) show that these patterns are associated with changes in the class structure between parent and child generations. The high upward / low downward settings experienced marked and continuous recent expansion of the upper classes, relative to the parents’ generation, coupled with stability in the size of the working class and relative shrinkage of the middle. Conversely, those from high downward / low upward settings experienced a large contraction in upper classes, coupled with an expansion of working-class positions (post-socialism, and Canada and Australia). For the majority of countries (similar upward and downward rates), these are characterised by earlier expansion of upper classes, which have since slowed down, allowing more scope for downward mobility than the first group.
Blanden and others (2019) show that absolute earnings mobility has also declined for those born since the 1970s. While 60% of sons born by 1970 achieved higher earnings than their fathers, only 40% of sons born in 1988 were earning as much, or more, than their fathers: the majority of sons in most recent cohorts experienced downward mobility by earning less than the previous generation. Corak and others (2014), compare rates of upward and downward intergenerational income mobility in the US, Sweden and Canada and find very similar patterns to those found using class mobility in OECD (2018). They find larger differences across countries in downward mobility than upward mobility, with the highest income mobility countries, Canada and Sweden, experiencing the most downward mobility, and the least income mobile country, the US experiencing the least downward mobility.
3.2 Opportunity hoarding, the glass floor and class ceiling
It is well known that children from high-income and professional families are more likely to stay in education longer and attain higher-level qualifications. This can be seen across all stages of education, though socio-economic differences in post-16 and higher education participation have narrowed over the last 20 to 30 years (Belfield and others, 2018). A large portion of the socio-economic gaps in post-compulsory education can be explained by differences in prior educational attainment at age 16 and earlier (Chowdry and others, 2013). Research has therefore focused on how children from richer and higher social class families maintain their advantage from an early age and the persistence of socio-economic gaps when considering later life chances and labour market outcomes.
Previous work by Goldthorpe (2013) has highlighted how those from higher social classes utilise their multiple resources to ensure that their offspring maintain their social standing, often by using education as a ‘positional good’. This type of action, known as opportunity hoarding or reinforcing a ‘glass floor’, ensures that social positions are protected regardless of the talent or skills of the individuals.
McKnight (2015) explores the factors associated with the creation of this glass floor in the UK, and finds parental education plays an important role, ensuring that children from higher social class families who are low attaining in cognitive tests at age 5 recover by age 10, have higher non-cognitive skills, are more likely to attend a private or grammar school, and are more likely to attain a degree qualification. For early high-attaining children, parents from higher social classes are better able to translate their early cognitive advantage into later labour market rewards.
Similarly, in the US, Reeves and Howard (2013) find that 43% of adults who are of ‘modest skill’ remain on higher incomes, despite being expected to experience downward mobility for their given skill level. They also find college attendance to be a significant driver of this, concluding that college places would be better allocated to higher skilled low-income students to increase mobility. Friedman and Macmillan (2017) also highlight the role of geographical mobility in this type of opportunity hoarding, with domestic migrants into London, predominantly from higher class backgrounds, being far less likely to experience downward mobility that those from similar backgrounds who live elsewhere.
Yet, several recent papers have shown that individuals from advantaged backgrounds do better in the labour market, regardless of their educational attainment. Gregg and others (2018) and Crawford and others (2016) highlight the persistent role of childhood parental incomes for those who go on to be top earners as adults, over and above the role of early childhood skills and educational attainment. Macmillan and others (2015) show that family background, and in particular private school attendance, is significantly associated with accessing a top job after university, even comparing individuals with very similar educational attainment. Laurison and Friedman (2016) and Friedman and others (2017) show that a class pay gap exists even within those who make it into top occupations, with those from higher class backgrounds earning £6,800 a year more than those from lower class backgrounds. These pay gaps persist, to a smaller degree, even after accounting for a range of observable differences in people from different backgrounds.
In summary, research and evidence show that education and skills play a crucial role in shaping different economic opportunities for children from different socio-economic and class backgrounds. Children from higher-class families show higher cognitive and soft skills during childhood, and are more likely to participate in post-compulsory education and attain higher qualifications, though some of these gaps have been narrowing over last 20 to 30 years. Individuals from higher socio-economic backgrounds also earn more regardless of overall education levels, which may be linked to opportunity hoarding through greater access to prestigious education opportunities, accumulation of soft skills and other forms of advantage.
4. The nature of downward mobility
In this section we ask: How much downward mobility is there? And which groups are most likely to experience it? To understand the extent of downward mobility, and explore the characteristics of those who experience it, we first detail how we measure origin and destination class across surveys, and how we combine this information to define those who are downwardly mobile.
4.1 Labour Force Survey
The class destination of survey respondents is measured using the derived National Statistics Socio-Economic Classification (NS-SEC) of the survey respondent based on their current or last occupation. Since 2014 the LFS has also collected retrospective information on the origin occupations of the ‘main earner’ of the survey respondent’s household when they were 14 in each summer wave (July-September). In 80% of cases the main earner is the respondent’s father. The main earner’s occupation is coded as a 4-digit SOC code, which is transformed into an NS-SEC category using the simplified method.[footnote 1] We combine information from 50,855 men and 54,115 women aged 30 to 59 across 5 years (2014 to 2018).
4.2 Cohort studies
The longitudinal nature of the cohort studies mean that they are not directly comparable with the respondents in the LFS for a number of reasons. First, class destinations, while measured in a similar manner using the NS-SEC for the current or last occupation, are measured for a certain age group at a given point in time in the cohort studies (age 33, 1991 and age 42, 2000 in NCDS, and age 34, 2000, and age 42, 2012 in the BCS). As we show in the LFS analysis, the chances of experiencing downward mobility vary with age, and so while we can compare directly across the 2 birth cohort studies, we urge caution with any comparison with the LFS data directly.
Second, class origins in the cohort studies are directly reported by the parents of the cohort members in childhood, rather than retrospectively reported. To be as comparable as possible, we use the ‘dominance method’, taking the highest reported parental social class of the cohort members at age 16 in the cohorts, to mimic that of the ‘main earner’ at age 14 in the LFS.[footnote 2] Yet there are some obvious differences in this definition – main earners will not necessarily be those in the highest occupational grouping (consider the high-earning self-employed plumber, as an example, who would be in NS-SEC category 4, partnered with a lower-earning teacher, who would be in NS-SEC category 2). The father is the highest-class parent of the cohort member for 70% of our sample in the NCDS, and 67% in the BCS, which compares with 80% in the LFS when we use ‘main earner’. The samples are more restricted in the cohort studies with just over 3,700 men and women in the NCDS, and just over 2,000 men and 2,400 women in the BCS.
The origin and destination class distributions across all 3 data sources are given in Table 3.1 While the origin class structure of men and women are very similar, as would be expected, there has been an increase in the proportion of those from NS- SEC 1 and 2 classes over time in the BCS, relative to the NCDS. Around 44% of cohort members are from NS-SEC 1 and 2 families in the 1970 cohort, compared to around 33% in the earlier NCDS cohort. There are also fewer respondents from semi- and routine occupations (NS-SEC 6 and 7) in the later cohort (13%) relative to the earlier NCDS cohort (25%).
The share of individuals from NS-SEC 1 and 2 classes in the LFS is around 36%, which is lower than the 44% observed for the BCS. The share from semi-routine and routine occupations (NS-SEC 6 and 7) is higher in the LFS at 26% for both men and women, as compared with 13% in the BCS. These differences are not driven by differences in the ages of participants (with similar figures for the LFS if we just focus on those aged 40 to 49) or by the years under consideration since the sample covers very similar years (the BCS relates to around 2012, while the LFS relates to 2014 to 2018). Instead, the differences are more likely to be driven by differences in how questions about parental occupation were asked (main earner or higher occupation), differences in the share of individuals with missing data (around 4% to 5% in the LFS as compared with over 10% in the BCS) and different samples (by definition, the BCS will not include individuals who were not born in the UK).
Table 3.1: Origin and Destination Occupational structure (8 groups) for men and women in the LFS, BCS and NCDS
| Men in different occupations | NCDS: Origin (%) | NCDS: Dest. Age 42 (%) | BCS: Origin (%) | BCS: Dest. Age 42 (%) | LFS: Origin (%) | LFS Dest. (Ages 30 to 59) (%) |
|---|---|---|---|---|---|---|
| 1. Higher | 11.3 | 18.3 | 20.0 | 23.1 | 15.3 | 21.9 |
| 2. Lower | 22.8 | 24.6 | 23.7 | 27.4 | 20.9 | 24.2 |
| 3. Intermediate | 27.1 | 7.1 | 22.3 | 9.3 | 9.7 | 6.6 |
| 4. Small | 4.2 | 13.1 | 6.4 | 13.0 | 12.0 | 13.1 |
| 5. Lower | 5.2 | 13.5 | 4.0 | 9.8 | 12.3 | 9.3 |
| 6.Semi-routine | 15.2 | 9.8 | 8.4 | 6.3 | 12.0 | 8.3 |
| 7. Routine Occs. | 9.9 | 10.4 | 4.8 | 6.6 | 13.6 | 10.3 |
| Missing/Workless | 4.3 | 3.1 | 10.4 | 4.6 | 4.3 | 6.4 |
| Women in different occupations | NCDS: Origin (%) | NCDS: Dest. Age 42 (%) | BCS: Origin (%) | BCS: Dest. Age 42 (%) | LFS: Origin (%) | LFS Dest. (Ages 30 to 59) (%) |
|---|---|---|---|---|---|---|
| 1. Higher | 11.5 | 7.3 | 17.5 | 10.8 | 14.6 | 12.0 |
| 2. Lower | 22.0 | 26.1 | 26.1 | 28.7 | 21.1 | 28.9 |
| 3. Intermediate | 27.3 | 19.0 | 23.2 | 18.2 | 10.1 | 17.2 |
| 4. Small | 4.6 | 6.3 | 5.7 | 7.0 | 11.7 | 6.5 |
| 5. Lower | 5.4 | 5.4 | 3.7 | 3.7 | 11.9 | 3.6 |
| 6.Semi-routine | 14.9 | 17.9 | 8.3 | 13.3 | 12.1 | 13.3 |
| 7. Routine Occs. | 10.2 | 8.9 | 4.6 | 3.3 | 13.9 | 6.0 |
| Missing/Workless | 4.0 | 9.2 | 11.0 | 15.1 | 4.5 | 12.4 |
Notes and sources: Authors’ calculations using the Labour Force Survey July to September 2014 to 2018, National Child Development Survey and Birth Cohort Study.
The destination class patterns also reflect a trend of an increase in professional occupations, with over 50% of men in the BCS working in an NS-SEC 1 or 2 occupation at age 42 compared to 42% in the NCDS. The destination class structures also vary by gender, with a higher proportion of women found in intermediate occupations, (18% compared to 7% to 9% of men) although this has remained broadly constant for women across the cohorts. While a similar proportion of women work in lower managerial and professional occupations (NS-SEC 2) compared to men, there are fewer women in higher managerial and professional occupations (NS-SEC 1), relative to men, although this has increased slightly over time (11% women compared to 23% men in BCS cohort).
The figures for the LFS are very similar to the BCS with around 46% of men and 41% of women in NS-SEC 1 or 2 occupations, as compared with 50% of men 40% of women in the BCS. The share in NS-SEC 6 or 7 occupations is also similar across the BCS and LFS. This further underlines that differences between the LFS and BCS are more likely to be driven by differences in how parental occupation was recorded.
In all 3 data sources, we follow the standard convention in the literature of focusing only on those reporting a current or last occupation (excluding NS-SEC 8, long-term unemployed). For origin class, given our focus on the family unit (or ‘main earner’), the extent of missing data is 5% of our total sample in the NCDS and LFS (and 10% in the BCS). For destination class, our focus is on the individual survey respondent, meaning that there are some clear differences across gender, with women having a higher proportion of missing data. Table 3.2 illustrates that the primary reason for missing NS-SEC among men is ‘sick or disabled’, while among women it is ‘looking after the home or family’.
Table 3.2: Economic activity for those not reporting a current / last NS-SEC
| Men | NCDS: Age 33 (%) | NCDS: Age 42 (%) | BCS: Age 34 (%) | BCS: Age 42 (%) | LFS: Ages 30 to 59 (%) | LFS: Ages 40 to 49 (%) |
|---|---|---|---|---|---|---|
| Unemployed seeking work | 49 | 26 | 15 | 35 | 21 | 22 |
| Sick/disabled | 41 | 48 | 52 | 37 | 47 | 50 |
| Looking after home/family | 2 | 10 | 10 | 16 | 8 | 11 |
| Other (Education, Govt | 8 | 17 | 23 | 12 | 24 | 17 |
| % of total sample | 1.3 | 3.1 | 2.4 | 4.6 | 6.4 | 5.7 |
| Women | NCDS: Age 33 (%) | NCDS: Age 42 (%) | BCS: Age 34 (%) | BCS: Age 42 (%) | LFS: Ages 30 to 59 (%) | LFS: Ages 40 to 49 (%) |
|---|---|---|---|---|---|---|
| Unemployed seeking work | 3 | 6 | 2 | 6 | 10 | 10 |
| Sick/disabled | 5 | 20 | 12 | 17 | 29 | 29 |
| Looking after home/family | 90 | 64 | 76 | 71 | 41 | 47 |
| Other (Education, Govt | 3 | 11 | 10 | 8 | 19 | 14 |
| % of total sample | 6.4 | 9.2 | 10.6 | 15.0 | 12.4 | 12.4 |
Notes and sources: Authors’ calculations using the Labour Force Survey July to September 2014 to 2018, National Child Development Survey and Birth Cohort Study.
Downward mobility is calculated using a transition matrix, tabulating origin and destination class together. Combining the 7-class NS-SEC origin and destinations’, a downward movement is considered one in which the survey respondent’s destination class is below that of their parents’ origin class, with the exception of movements within classes 3 to 5 which are considered horizontal movements.
While this is the standard measure of downward mobility, this includes moves from class 1 to 2, and from class 6 to 7 as downward movements. For the purposes of our analysis, we made the decision to focus only on larger class movements, collapsing the NS-SEC structure from 7 classes to 3, professional, intermediate or middle, and working class, measuring downward mobility as any move from professional to intermediate or working class, and from intermediate to working class. This allows us to focus on major changes in occupations between origin and destination classes.
For our main analysis in the LFS, we focus on individuals who are aged between 30 and 59 at the time of the survey. This is because individuals’ occupational choices are still relatively fluid during their 20s. Occupational decisions and levels of downward mobility (see Figure 3.1 below) are relatively stable from ages 30 through to 59. We exclude individuals aged 60 or above as they are more likely to be retired.
Figure 3.1 – Levels of downward mobility for men and women by age (LFS)

Notes and sources: Authors’ calculations using the Labour Force Survey July to September 2014 to 2018.
Tables 3.3, 3.4, and 3.5, show the transition matrices for the LFS ages 30 to 59, and NCDS and BCS at age 42 for the 7x7 movements, while Tables 3.6, 3.7 and 3.8 show comparable transition matrices for the collapsed 3x3 version. Comparing across the 2 different specifications, we can see that there is less downward mobility in the 3x3 approach, with just over 20% of men being defined as downwardly mobile in the collapsed version, compared with just under 30% using the full transition matrices, for each data source. This is expected given our focus on larger movements across broad class groups, excluding smaller movements within class groups. But the general pattern is very similar across the cohort studies as was found in Bukodi and others (2015) and Bukodi and Goldthorpe (2019) that downward mobility was relatively stable for those born in 1970 relative to 1958[footnote 3] and that men experience less downward mobility than women.
Table 3.3: LFS 7x7 transition matrix, percentage (%) of individuals aged 30 to 59
| Men | 1. Higher managerial | 2. Lower managerial | 3. Inter. occs. | 4. Small employers | 5. Lower supervisory | 6.Semi-routine | 7. Routine occs. | Total |
|---|---|---|---|---|---|---|---|---|
| 1. Higher Managerial | 6.3 | 5.0 | 1.1 | 1.6 | 1.0 | 0.7 | 0.7 | 16.3 |
| 2. Lower Managerial | 6.6 | 6.9 | 1.6 | 2.7 | 1.6 | 1.3 | 1.3 | 22.1 |
| 3. Intermediate Occ. | 2.5 | 3.0 | 0.9 | 1.2 | 0.8 | 0.9 | 0.9 | 10.2 |
| 4. Small Employers | 2.0 | 2.6 | 0.7 | 3.0 | 1.5 | 1.2 | 1.6 | 12.5 |
| 5. Lower supervisory | 2.7 | 3.1 | 0.9 | 1.6 | 1.6 | 1.3 | 1.5 | 12.8 |
| 6.Semi-routine Occs. | 1.7 | 2.7 | 0.9 | 1.8 | 1.6 | 1.6 | 2.0 | 12.2 |
| 7. Routine Occs. | 1.9 | 2.7 | 0.9 | 2.1 | 1.8 | 1.7 | 2.7 | 13.8 |
| Total | 23.8 | 26.1 | 7.0 | 14.0 | 9.8 | 8.6 | 10.7 | 100.0 |
| Women | 1. Higher managerial | 2. Lower managerial | 3. Inter. occs. | 4. Small employers | 5. Lower supervisory | 6.Semi-routine | 7. Routine occs. | Total |
|---|---|---|---|---|---|---|---|---|
| 1. Higher Managerial | 3.8 | 6.1 | 2.8 | 1.2 | 0.4 | 1.3 | 0.4 | 16.0 |
| 2. Lower Managerial | 4.1 | 8.9 | 4.0 | 1.7 | 0.7 | 2.3 | 0.8 | 22.6 |
| 3. Intermediate Occ. | 1.5 | 3.8 | 2.3 | 0.8 | 0.4 | 1.4 | 0.6 | 10.7 |
| 4. Small Employers | 1.2 | 3.6 | 2.3 | 1.1 | 0.6 | 2.2 | 1.1 | 12.0 |
| 5. Lower supervisory | 1.3 | 4.0 | 2.8 | 0.9 | 0.6 | 2.1 | 0.8 | 12.6 |
| 6.Semi-routine Occs. | 1.0 | 3.3 | 2.5 | 0.8 | 0.7 | 2.6 | 1.3 | 12.2 |
| 7. Routine Occs. | 1.0 | 3.7 | 3.0 | 0.9 | 0.7 | 3.1 | 1.6 | 14.0 |
| Total | 13.9 | 33.4 | 19.7 | 7.4 | 4.1 | 14.9 | 6.6 | 100.0 |
Notes and sources: Authors’ calculations using the Labour Force Survey July to September 2014 to 2018.
Table 3.4: NCDS 7x7 transition matrix, % of individuals aged 42
| Men | 1. Higher managerial | 2. Lower managerial | 3. Inter. occs. | 4. Small employers | 5. Lower supervisory | 6.Semi-routine | 7. Routine occs. | Total |
|---|---|---|---|---|---|---|---|---|
| 1. Higher Managerial | 4.3 | 3.9 | 1.1 | 1.0 | 0.8 | 0.3 | 0.4 | 11.8 |
| 2. Lower Managerial | 5.6 | 6.7 | 1.8 | 3.2 | 2.7 | 2.0 | 1.5 | 23.5 |
| 3. Intermediate Occ. | 4.8 | 7.3 | 2.4 | 3.6 | 4.0 | 3.0 | 2.7 | 27.8 |
| 4. Small Employers | 0.8 | 0.9 | 0.2 | 1.3 | 0.5 | 0.3 | 0.4 | 4.3 |
| 5. Lower supervisory | 0.6 | 1.3 | 0.2 | 0.8 | 1.1 | 0.6 | 0.7 | 5.2 |
| 6.Semi-routine Occs. | 1.6 | 3.2 | 1.1 | 2.4 | 3.3 | 1.9 | 2.8 | 16.2 |
| 7. Routine Occs. | 1.1 | 2.1 | 0.7 | 1.3 | 1.7 | 2.1 | 2.3 | 11.2 |
| Total | 18.9 | 25.4 | 7.4 | 13.6 | 13.9 | 10.1 | 10.8 | 100 |
| Women | 1. Higher managerial | 2. Lower managerial | 3. Inter. occs. | 4. Small employers | 5. Lower supervisory | 6.Semi-routine | 7. Routine occs. | Total |
|---|---|---|---|---|---|---|---|---|
| 1. Higher Managerial | 1.8 | 4.9 | 2.1 | 0.9 | 0.2 | 1.5 | 0.3 | 11.7 |
| 2. Lower Managerial | 2.6 | 7.8 | 4.8 | 1.7 | 0.9 | 3.7 | 1.3 | 22.8 |
| 3. Intermediate Occ. | 1.8 | 7.2 | 6.7 | 1.7 | 1.8 | 5.8 | 2.6 | 27.7 |
| 4. Small Employers | 0.4 | 1.3 | 0.9 | 0.8 | 0.5 | 0.9 | 0.3 | 5.1 |
| 5. Lower supervisory | 0.4 | 1.3 | 1.2 | 0.4 | 0.3 | 1.3 | 0.5 | 5.6 |
| 6.Semi-routine Occs. | 0.7 | 3.8 | 3.5 | 0.8 | 1.1 | 3.6 | 2.7 | 16.2 |
| 7. Routine Occs. | 0.3 | 2.4 | 1.5 | 0.7 | 1.2 | 2.9 | 2.1 | 11.1 |
| Total | 8.0 | 28.7 | 20.9 | 6.9 | 6.0 | 19.7 | 9.8 | 100 |
Notes and sources: Authors’ calculations using the National Child Development Survey.
Table 3.5: BCS 7x7 transition matrix, % of individuals aged 42
| Men | 1. Higher managerial | 2. Lower managerial | 3. Inter. occs. | 4. Small employers | 5. Lower supervisory | 6.Semi-routine | 7. Routine occs. | Total |
|---|---|---|---|---|---|---|---|---|
| 1. Higher Managerial | 8.2 | 7.0 | 1.6 | 1.8 | 0.9 | 0.6 | 0.7 | 20.8 |
| 2. Lower Managerial | 7.2 | 8.4 | 2.9 | 3.1 | 2.2 | 1.4 | 0.9 | 26.2 |
| 3. Intermediate Occ. | 4.3 | 7.4 | 3.0 | 3.7 | 3.3 | 2.3 | 1.6 | 25.7 |
| 4. Small Employers | 1.2 | 1.7 | 0.5 | 2.3 | 0.7 | 0.4 | 0.6 | 7.4 |
| 5. Lower supervisory | 1.0 | 0.9 | 0.5 | 0.5 | 0.6 | 0.3 | 0.4 | 4.3 |
| 6.Semi-routine Occs. | 1.3 | 2.4 | 0.8 | 1.1 | 1.7 | 1.0 | 1.7 | 10.0 |
| 7. Routine Occs. | 1.0 | 0.9 | 0.4 | 0.9 | 0.9 | 0.6 | 1.0 | 5.6 |
| Total | 24.2 | 28.7 | 9.8 | 13.6 | 10.3 | 6.6 | 7.0 | 100 |
| Women | 1. Higher managerial | 2. Lower managerial | 3. Inter. occs. | 4. Small employers | 5. Lower supervisory | 6.Semi-routine | 7. Routine occs. | Total |
|---|---|---|---|---|---|---|---|---|
| 1. Higher Managerial | 3.8 | 7.9 | 3.0 | 1.5 | 0.7 | 1.7 | 0.4 | 18.9 |
| 2. Lower Managerial | 3.9 | 10.2 | 6.2 | 2.2 | 1.2 | 3.7 | 0.8 | 28.2 |
| 3. Intermediate Occ. | 2.8 | 7.5 | 7.3 | 2.5 | 1.2 | 4.7 | 1.2 | 27.0 |
| 4. Small Employers | 0.6 | 2.4 | 1.1 | 0.8 | 0.4 | 1.3 | 0.2 | 6.7 |
| 5. Lower supervisory | 0.4 | 1.4 | 1.0 | 0.2 | 0.1 | 0.8 | 0.1 | 4.0 |
| 6.Semi-routine Occs. | 0.8 | 2.8 | 1.6 | 0.7 | 0.4 | 2.1 | 0.8 | 9.3 |
| 7. Routine Occs. | 0.6 | 1.6 | 1.2 | 0.4 | 0.4 | 1.5 | 0.4 | 5.9 |
| Total | 12.7 | 33.8 | 21.4 | 8.2 | 4.3 | 15.7 | 3.9 | 100 |
Notes and sources: Authors’ calculations using the Birth Cohort Study.
Table 3.6: LFS 3x3 transition matrix, % of individuals aged 30 to 59
| Men | 1. NSSEC 1 and 2 | 2. NSSEC 3 to 5 | 3. NSSEC 6 and 7 | Total |
|---|---|---|---|---|
| 1. NSSEC 1 and 2 | 24.8 | 9.6 | 4.0 | 38.4 |
| 2. NSSEC 3 to 5 | 16.0 | 12.2 | 7.4 | 35.6 |
| 3. NSSEC 6 and 7 | 9.0 | 9.0 | 7.9 | 26.0 |
| Total | 49.8 | 30.8 | 19.3 | 100.0 |
| Women | 1. NSSEC 1 and 2 | 2. NSSEC 3 to 5 | 3. NSSEC 6 and 7 | Total |
|---|---|---|---|---|
| 1. NSSEC 1 and 2 | 22.9 | 10.8 | 4.8 | 38.5 |
| 2. NSSEC 3 to 5 | 15.4 | 11.7 | 8.2 | 35.3 |
| 3. NSSEC 6 and 7 | 9.1 | 8.6 | 8.5 | 26.2 |
| Total | 47.4 | 31.2 | 21.5 | 100.0 |
Notes and sources: Authors’ calculations using the Labour Force Survey July to September 2014 to 2018.
Table 3.7: NCDS 3x3 transition matrix, % of individuals aged 42
| Men | 1. NSSEC 1 and 2 | 2. NSSEC 3 to 5 | 3. NSSEC 6 and 7 | Total |
|---|---|---|---|---|
| 1. NSSEC 1 and 2 | 20.6 | 10.4 | 4.3 | 35.3 |
| 2. NSSEC 3 to 5 | 15.7 | 14.0 | 7.6 | 37.3 |
| 3. NSSEC 6 and 7 | 8.0 | 10.4 | 9.0 | 27.4 |
| Total | 44.3 | 34.8 | 20.9 | 100 |
| Women | 1. NSSEC 1 and 2 | 2. NSSEC 3 to 5 | 3. NSSEC 6 and 7 | Total |
|---|---|---|---|---|
| 1. NSSEC 1 and 2 | 17.1 | 10.6 | 6.8 | 34.4 |
| 2. NSSEC 3 to 5 | 12.6 | 14.3 | 11.5 | 38.4 |
| 3. NSSEC 6 and 7 | 7.1 | 8.8 | 11.3 | 27.2 |
| Total | 36.7 | 33.7 | 29.5 | 100 |
Notes and sources: Authors’ calculations using the National Child Development Survey.
Table 3.8: BCS 3x3 transition matrix, % of individuals aged 42
| Men | 1. NSSEC 1 and 2 | 2. NSSEC 3 to 5 | 3. NSSEC 6 and 7 | Total |
|---|---|---|---|---|
| 1. NSSEC 1 and 2 | 30.8 | 12.5 | 3.7 | 47.0 |
| 2. NSSEC 3 to 5 | 16.5 | 15.2 | 5.6 | 37.4 |
| 3. NSSEC 6 and 7 | 5.6 | 5.8 | 4.2 | 15.6 |
| Total | 52.9 | 33.6 | 13.5 | 100 |
| Women | 1. NSSEC 1 and 2 | 2. NSSEC 3 to 5 | 3. NSSEC 6 and 7 | Total |
|---|---|---|---|---|
| 1. NSSEC 1 and 2 | 25.8 | 14.8 | 6.6 | 47.1 |
| 2. NSSEC 3 to 5 | 15.0 | 14.4 | 8.2 | 37.7 |
| 3. NSSEC 6 and 7 | 5.8 | 4.7 | 4.7 | 15.2 |
| Total | 46.5 | 33.9 | 19.6 | 100 |
Notes and sources: Authors’ calculations using the Birth Cohort Study.
Table 3.9: Mobility rates by data sources and transition matrix, (% of individuals age 42 in NCDS/BCS, 30 to 59 LFS)
| Men | NCDS: 7x7 | NCDS: 3x3 | BCS: 7x7 | BCS: 3x3 | LFS: 7x7 | LFS: 3x3 |
|---|---|---|---|---|---|---|
| Total | 80.0 | 56.4 | 75.5 | 49.8 | 77.1 | 55.0 |
| Upward | 41.8 | 34.1 | 35.8 | 28.0 | 42.4 | 34.0 |
| Downward | 29.0 | 22.3 | 30.5 | 21.8 | 27.9 | 21.0 |
| Horizontal | 9.3 | 9.2 | 6.8 |
| Women | NCDS: 7x7 | NCDS: 3x3 | BCS: 7x7 | BCS: 3x3 | LFS: 7x7 | LFS: 3x3 |
|---|---|---|---|---|---|---|
| Total | 77.0 | 57.3 | 75.4 | 55.1 | 79.1 | 56.9 |
| Upward | 34.0 | 28.5 | 30.8 | 25.5 | 40.2 | 33.1 |
| Downward | 36.5 | 28.8 | 38.3 | 29.6 | 31.2 | 23.8 |
| Horizontal | 6.5 | 6.2 | 7.7 |
Notes and sources: Authors’ calculations using the Labour Force Survey July to September 2014 to 2018, National Child Development Survey and Birth Cohort Study.
Figure 3.2 summarises levels of downward mobility for women and men in each of our 3 data sources at different ages from our collapsed (3x3) transition matrices. Consistent with Figure 3.1, we can see a decline in downward mobility rates for men (and women in the NCDS) between age 33/34 and 42 in the cohort studies, as individuals’ age. The picture for women in the BCS is more stable with a slight increase across ages. In the LFS the picture is broadly stable across the main sample (age 30 to 50) compared to the more restrictive sample (age 40 to 49).
Figure 3.2 and Table 3.9 show that across all 3 data sources, men have downward mobility rates of just over 20 percent across broad class groups. Women have slightly higher rates of downward mobility, but these are again broadly stable across the cohorts (at age 42) with around 30 percent of women experiencing downward mobility at that age. Women in the LFS have slightly lower rates of downward mobility relative to the cohort studies. This could be partly driven by the different distributions of origin class, as discussed above, in the LFS relative to the cohorts, meaning that these is more scope for downward mobility in the cohorts relative to the LFS. The origin distributions for women look more similar in the NCDS compared to the LFS, but there more class stability in NS-SEC 1 and 2 for women in the LFS.
Figure 3.2: Levels of downward mobility for men and women across data sources at various ages
| Data and age | Percentage experiencing downward mobility: Men | Percentage experiencing downward mobility: Women |
|---|---|---|
| NCDS (age 33) | 27% | 35% |
| NCDS (age 42) | 22% | 29% |
| BCS (age 34) | 21% | 27% |
| BCS (age 42) | 22% | 30% |
| LFS (age 40 to 49) | 20% | 23% |
| LFS (age 30 to 59) | 21% | 24% |
Notes and sources: Authors’ calculations using the Labour Force Survey, National Childhood Development Survey and Birth Cohort Study.
Table 3.10 summarises levels of downward mobility in the LFS by key characteristics including education, ethnicity, number of children, and destination region.
Downward mobility is strongly related to the highest education level achieved, with 30% of men and 35% of women who achieve below level 2 (below 5 A*-C at GCSE) experiencing downward mobility, compared with just 8(10)% for men (women) with a postgraduate degree.
Downward mobility also varies a great deal by ethnicity. While White British men and women’s experience of downward mobility are in line with the national average (which is unsurprising given that they are by far the largest group), only 13% of Chinese men and 17% of Black Caribbean women experience downward mobility. Conversely, 38% to 40% of Black African and 33% to 39% of Bangladeshi men and women are downwardly mobile.
People with more children are more likely to be downwardly mobile, and as expected this holds more for women than men. Nearly 30% of women with 3 or more children experience downward mobility, compared with 23% with no children.
Finally, men in London and the South East experience the lowest rates of downward mobility, below 20%, compared to 23% in the North West. Interestingly, women in the South East have one of the highest rates of downward mobility, with over 25% of women in that region moving down. Women in the South West and East of England also have high rates of downward mobility, while women in Northern Ireland and the North West have lower rates (21%).
Table 3.10: Level of downward mobility and sample sizes for men and women with different characteristics
| % men experiencing downward mobility | Weighted sample size | % women experiencing downward mobility | Weighted sample size | |
|---|---|---|---|---|
| Total (ages 30 to 59) | 21.0% | 50,855 | 23.8% | 54,115 |
| Of which (ages 40 to 49) | 20.3% | 17,579 | 23.3% | 18,176 |
| Educational qualifications | ||||
| Less than Level 2 | 29.6% | 4,606 | 35.0% | 3,965 |
| Level 2 (GCSEs) | 28.1% | 8,985 | 30.5% | 11,607 |
| Level 3 (A-level) | 21.8% | 15,970 | 24.3% | 16,369 |
| Level 4 to 6 (Degree) | 12.8% | 13,933 | 17.4% | 15,407 |
| Level 7+ (Postgraduate) | 8.3% | 3,816 | 10.9% | 4,320 |
| Missing /Undefined | 32.7% | 3,545 | 34.8% | 2,446 |
| Ethnicity | ||||
| White British | 19.8% | 41,366 | 22.8% | 44,263 |
| White Other | 10.6% | 305 | 11.4% | 329 |
| Indian | 21.4% | 1,627 | 26.4% | 1,433 |
| Pakistani | 28.3% | 856 | 26.0% | 499 |
| Bangladeshi | 33.2% | 368 | 39.3% | 147 |
| Chinese | 13.4% | 233 | 28.8% | 318 |
| Other Asian | 32.0% | 570 | 37.8% | 713 |
| Black African | 38.2% | 747 | 40.2% | 930 |
| Black Caribbean | 19.1% | 410 | 16.9% | 648 |
| Other | 30.4% | 895 | 33.1% | 847 |
| Mixed | 24.8% | 3,479 | 27.0% | 3,988 |
| Number of children | ||||
| No Children | 22.5% | 27,015 | 22.9% | 27,188 |
| 1 | 19.5% | 9,369 | 24.0% | 11,570 |
| 2 | 17.7% | 10,812 | 24.1% | 11,772 |
| 3 | 21.3% | 2,821 | 29.0% | 2,872 |
| 4+ | 24.3% | 838 | 32.3% | 714 |
| Destination Region | ||||
| North West | 22.9% | 1,842 | 21.4% | 2,061 |
| North East | 22.4% | 5,365 | 23.2% | 5,729 |
| Yorkshire and Humber | 20.8% | 4,021 | 23.5% | 4,228 |
| East Midlands | 22.3% | 3,614 | 24.0% | 3,913 |
| West Midlands | 22.0% | 4,280 | 22.9% | 4,443 |
| East of England | 20.0% | 4,899 | 25.4% | 5,260 |
| London | 19.6% | 7,293 | 23.4% | 7,133 |
| South East | 19.2% | 7,484 | 25.3% | 8,075 |
| South West | 21.2% | 4,320 | 26.3% | 4,722 |
| Wales | 22.3% | 2,238 | 22.5% | 2,450 |
| Scotland | 21.4% | 4,222 | 22.1% | 4,766 |
| Northern Ireland | 20.9% | 1,276 | 21.0% | 1,336 |
Notes and sources: Authors’ calculations using the Labour Force Survey.
Table 3.11 describes levels of downward mobility by detailed parental occupation. By virtue of the definition of downward mobility, people from working class families cannot be downwardly mobile. Men and women from professional backgrounds are more likely to experience downward mobility, in part because they have more scope to move down than those from intermediate backgrounds. 35% of men and 41% of women with a professional highest earning parent moved down to an intermediate or working-class position in adulthood, compared with 21% of men and 23% of women from intermediate backgrounds (who can only move to working class positions to experience downward mobility).
Within those from professional class upbringings, downward mobility tends to be highest for both men and women whose main earner worked as police, fire or military officers, nurses or general manager/directors. This is notable as these are occupations that have tended to become more graduate-led over time.[footnote 4] Children might thus have not been able to access similar occupations as their parents without themselves going to higher education.
Downward mobility tends to be lowest for those whose parents worked as doctors, lawyers, teachers and scientists. These are occupations that have been graduate-led for a much longer period of time, suggesting a further strong link to the role of formal education qualifications.
There is less heterogeneity amongst individuals whose parents worked in intermediate occupations. Here, we see the highest levels of downward mobility for men whose parents worked in skilled transport, building and construction and food/hospitality. Downward mobility is also high for women whose parents worked in these professions, as well as those whose parents worked in agriculture and leisure/travel.
It tends to be lower for individuals whose parents worked in clerical or office environments (administration and printing/design).
Table 3.11: Level of downward mobility by detailed parental occupation
| Downward mobility (% men) | Weighted sample size | Share of population (men) | Downward mobility (%women) | Weighted sample size | Share of population (women) | |
|---|---|---|---|---|---|---|
| Total | 21% | 50,855 | 100.0% | 24% | 54,115 | 100.0% |
| Professional | 35% | 19,087 | 37.5% | 41% | 20,545 | 38.0% |
| Managers and Directors | 40% | 5,246 | 10.3% | 47% | 5,610 | 10.4% |
| Finance and Accounting | 30% | 1,825 | 3.6% | 37% | 2,021 | 3.7% |
| Police, Fire and Military | 43% | 540 | 1.1% | 48% | 552 | 1.0% |
| Health Professional | 34% | 276 | 0.5% | 39% | 289 | 0.5% |
| Scientists | 23% | 342 | 0.7% | 33% | 332 | 0.6% |
| Engineers | 38% | 2,240 | 4.4% | 43% | 2,344 | 4.3% |
| IT Professional | 30% | 472 | 0.9% | 38% | 554 | 1.0% |
| Doctors | 24% | 785 | 1.5% | 26% | 820 | 1.5% |
| Nurses | 48% | 637 | 1.3% | 40% | 744 | 1.4% |
| Teachers | 29% | 2,484 | 4.9% | 32% | 2,673 | 4.9% |
| Law | 23% | 270 | 0.5% | 34% | 308 | 0.6% |
| Architects and Surveyors | 30% | 784 | 1.5% | 38% | 864 | 1.6% |
| Welfare and Social Work | 36% | 431 | 0.8% | 40% | 442 | 0.8% |
| Journalists | 36% | 106 | 0.2% | 36% | 110 | 0.2% |
| Creative | 38% | 239 | 0.5% | 45% | 274 | 0.5% |
| Pilots and Officers | 33% | 171 | 0.3% | 42% | 171 | 0.3% |
| Business Professional | 34% | 1,037 | 2.0% | 43% | 1,137 | 2.1% |
| Other Professional | 41% | 1,024 | 2.0% | 45% | 1,076 | 2.0% |
| CEOs | 27% | 178 | 0.4% | 38% | 224 | 0.4% |
| Intermediate | 21% | 18,304 | 36.0% | 23% | 19,246 | 35.6% |
| Agriculture | 22% | 1,976 | 3.9% | 28% | 1,991 | 3.7% |
| Police, Fire and Military | 20% | 1,245 | 2.4% | 18% | 1,321 | 2.4% |
| Printing and Design | 13% | 453 | 0.9% | 16% | 499 | 0.9% |
| Government | 14% | 684 | 1.3% | 19% | 771 | 1.4% |
| Administrators | 15% | 1,930 | 3.8% | 16% | 2,240 | 4.1% |
| Skilled Manual | 20% | 3,805 | 7.5% | 21% | 3,872 | 7.2% |
| Skilled Transport | 25% | 1,472 | 2.9% | 28% | 1,594 | 2.9% |
| Building and Construction | 23% | 4,206 | 8.3% | 27% | 4,238 | 7.8% |
| Food and Hospitality | 27% | 737 | 1.4% | 27% | 786 | 1.5% |
| Childcare | 16% | 161 | 0.3% | 21% | 178 | 0.3% |
| Leisure and Travel | 19% | 162 | 0.3% | 29% | 184 | 0.3% |
| Hairdressers | 16% | 114 | 0.2% | 22% | 127 | 0.2% |
| Sales and Customer Service | 20% | 864 | 1.7% | 24% | 936 | 1.7% |
| Other Skilled | 24% | 495 | 1.0% | 26% | 509 | 0.9% |
| Working | n/a | 13,464 | 26.5% | n/a | 14,324 | 26.5% |
| Metal Work | n/a | 600 | 1.2% | n/a | 692 | 1.3% |
| Textiles | n/a | 367 | 0.7% | n/a | 397 | 0.7% |
| Carer | n/a | 593 | 1.2% | n/a | 735 | 1.4% |
| Cleaning and Housekeeping | n/a | 960 | 1.9% | n/a | 1,190 | 2.2% |
| Retail Assistant | n/a | 745 | 1.5% | n/a | 837 | 1.5% |
| Process and Plant | n/a | 3,937 | 7.7% | n/a | 4,055 | 7.5% |
| Construction | n/a | 1,050 | 2.1% | n/a | 992 | 1.8% |
| Driver | n/a | 2,713 | 5.3% | n/a | 2,808 | 5.2% |
| Unskilled Agriculture | n/a | 496 | 1.0% | n/a | 483 | 0.9% |
| Unskilled Administration | n/a | 479 | 0.9% | n/a | 489 | 0.9% |
| Security | n/a | 367 | 0.7% | n/a | 365 | 0.7% |
| Storage | n/a | 663 | 1.3% | n/a | 690 | 1.3% |
| Other Unskilled | n/a | 494 | 1.0% | n/a | 591 | 1.1% |
Notes and sources: Authors’ calculations using the Labour Force Survey.
In Table 3.12, we show rates of downward mobility by the detailed destination occupation of the survey respondents to show which occupations absorb most downward mobility.
Amongst men working in intermediate occupations, about 31% had experienced downward mobility, as had 35% of women working in such professions. This increases to 40% for men working in administrative jobs, printing/design and police, fire and military roles. This generally matches parental jobs that experienced the lowest levels of downward mobility. Downward mobility was lowest for men working in agriculture, building/construction skilled transport and food and hospitality. This continues the inverse pattern we’ve seen already, with these being the parental occupations experiencing the highest levels of downward mobility. This suggests knock- on consequences across generations, with people moving down to particular occupations and then children whose parents worked in these occupations moving down themselves.
Amongst women, downward mobility was highest for those working in the building/construction, printing/design and the police, fire and military. However, these are relatively uncommon occupations amongst women, employing around 1% of women in total. It was lowest for women working in skilled manual jobs, food/hospitality or as hairdressers. There is less evidence of an inverse relationship for women.
Looking at working class jobs, men and women in these jobs naturally experienced higher levels of downward mobility given the greater number of jobs to fall from, around 60% in each case. There is also relatively little heterogeneity by detailed occupation. There is only slightly higher downward mobility for men working in security and retail jobs and slightly lower levels in textiles and agriculture.
Amongst women, the distribution of occupations is heavily skewed towards retail, social care and cleaning, which together account for over half of women in working class occupations. These occupations have average levels of downward mobility but will absorb more downward mobility by virtue of employing large numbers of women.
Table 3.12: Level of downward mobility by detailed own occupation
| Downward mobility (% men) | Weighted sample size | Share of population (men) | Downward mobility (% women) | Weighted sample size | Share of population (women) | |
|---|---|---|---|---|---|---|
| Total | 21% | 50,855 | 100.0% | 24% | 54,115 | 100.0% |
| Professional | n/a | 25,068 | 49.3% | n/a | 25,396 | 46.9% |
| Managers and Directors | n/a | 6,390 | 12.6% | n/a | 3,413 | 6.3% |
| Finance and Accounting | n/a | 2,850 | 5.6% | n/a | 2,289 | 4.2% |
| Police, Fire and Military | n/a | 197 | 0.4% | n/a | 35 | 0.1% |
| Health Professional | n/a | 400 | 0.8% | n/a | 1,397 | 2.6% |
| Scientists | n/a | 376 | 0.7% | n/a | 345 | 0.6% |
| Engineers | n/a | 2,071 | 4.1% | n/a | 423 | 0.8% |
| IT Professional | n/a | 3,132 | 6.2% | n/a | 825 | 1.5% |
| Doctors | n/a | 748 | 1.5% | n/a | 1,156 | 2.1% |
| Nurses | n/a | 276 | 0.5% | n/a | 2,283 | 4.2% |
| Teachers | n/a | 1,627 | 3.2% | n/a | 3,915 | 7.2% |
| Law | n/a | 310 | 0.6% | n/a | 336 | 0.6% |
| Architects and Surveyors | n/a | 780 | 1.5% | n/a | 197 | 0.4% |
| Welfare and Social Work | n/a | 425 | 0.8% | n/a | 1,236 | 2.3% |
| Journalists | n/a | 235 | 0.5% | n/a | 279 | 0.5% |
| Creative | n/a | 579 | 1.1% | n/a | 542 | 1.0% |
| Pilots and Officers | n/a | 142 | 0.3% | n/a | 15 | 0.0% |
| Business Professional | n/a | 1,742 | 3.4% | n/a | 1,860 | 3.4% |
| Other Professional | n/a | 1,992 | 3.9% | n/a | 2,269 | 4.2% |
| CEOs | n/a | 201 | 0.4% | n/a | 84 | 0.2% |
| Intermediate | 31% | 15,822 | 31.1% | 35% | 16,978 | 31.4% |
| Agriculture | 24% | 1,067 | 2.1% | 36% | 241 | 0.4% |
| Police, Fire and Military | 37% | 970 | 1.9% | 40% | 314 | 0.6% |
| Printing and Design | 39% | 375 | 0.7% | 52% | 264 | 0.5% |
| Government | 38% | 364 | 0.7% | 33% | 946 | 1.7% |
| Administrators | 40% | 1,381 | 2.7% | 35% | 6,677 | 12.3% |
| Skilled Manual | 28% | 2,543 | 5.0% | 21% | 347 | 0.6% |
| Skilled Transport | 26% | 976 | 1.9% | 39% | 19 | 0.0% |
| Building and Construction | 21% | 3,043 | 6.0% | 43% | 61 | 0.1% |
| Food and Hospitality | 25% | 744 | 1.5% | 28% | 551 | 1.0% |
| Childcare | 29% | 106 | 0.2% | 34% | 2,504 | 4.6% |
| Leisure and Travel | 38% | 159 | 0.3% | 38% | 266 | 0.5% |
| Hairdressers | 15% | 65 | 0.1% | 27% | 578 | 1.1% |
| Sales and Customer Service | 35% | 565 | 1.1% | 33% | 960 | 1.8% |
| Other Skilled | 29% | 385 | 0.8% | 34% | 573 | 1.1% |
| Working | 59% | 9,965 | 19.6% | 61% | 11,741 | 21.7% |
| Metal Work | 58% | 385 | 0.8% | SUPP | SUPP | SUPP |
| Textiles | 52% | 287 | 0.6% | 65% | 88 | 0.2% |
| Carer | 68% | 83 | 0.2% | 62% | 3,085 | 5.7% |
| Cleaning and Housekeeping | 57% | 648 | 1.3% | 55% | 1,716 | 3.2% |
| Retail Assistant | 65% | 751 | 1.5% | 60% | 2,294 | 4.2% |
| Process and Plant | 56% | 741 | 1.5% | 57% | 518 | 1.0% |
| Construction | 58% | 1,315 | 2.6% | SUPP | SUPP | SUPP |
| Driver | 57% | 783 | 1.5% | 68% | 199 | 0.4% |
| Unskilled Agriculture | 55% | 3,130 | 6.2% | 72% | 55 | 0.1% |
| Unskilled Administration | 59% | 138 | 0.3% | 68% | 158 | 0.3% |
| Security | 72% | 452 | 0.9% | 62% | 403 | 0.7% |
| Storage | 57% | 456 | 0.9% | 57% | 189 | 0.3% |
| Other Unskilled | 69% | 907 | 1.8% | 58% | 1,103 | 2.0% |
Notes and sources: Authors’ calculations using the Labour Force Survey.
5. Drivers of downward mobility
In this section, we analyse the nature and potential drivers of downward social mobility by estimating the effect of various characteristics on the chances of experiencing downward mobility. We show both raw differences and the estimated effects once controlling for a range of factors.
We undertake this analysis using a similar main specification across the Labour Force Survey (LFS), Birth Cohort Study and National Childhood Development Survey. We then further explore the determinants in more detail using the extra data items available in the different datasets. Table 4.1 shows the variables included in the main estimation, together with the additional data items explored in the different datasets.
We estimate logistic regressions separately for men and women, with the outcome being whether individuals experienced downward social mobility (as defined in earlier sections). We also break this down further for individuals whose parents worked in the professional and intermediate classes given that individuals with parents in professional occupations have further to fall from. Individuals with parents in working class occupations are necessarily excluded as they cannot experience downward mobility. Estimated effects represents marginal effects estimated at the mean for all control factors.
Table 4.1: Regression specifications across datasets
| Labour Force Survey | BCS and NCDS | |
|---|---|---|
| Main specification | ||
| Age | Yes (ages 30 to 59) | Single age (33/34) |
| Broad education | Yes | Yes |
| Number of children | Yes | Yes |
| Destination region | Yes | Midlands combined, South East and London combined |
| Ethnicity and country of birth | Yes | No |
| Additional analysis by dataset | ||
| Detailed qualifications | Yes | No |
| Degree class | Yes | No |
| Cognitive and non-cognitive | No | Yes |
| Region of origin | No | Yes |
Tables 4.2 to 4.4 in the “Regression results” sub-section below show our results using the Labour Force Survey for men and women aged 30 to 59 between 2014 and 2018. The sample sizes are shown at the bottom of each table and include all individuals with non-missing own and parental occupation.
Table 4.2 and 4.3 show our results using the main specification for men and women, respectively. The first column shows the raw differences for each characteristic relative to the stated omitted category (with only controls for age, year and specific NS-SEC parental occupation group). The second column shows the estimated differences after controlling for all characteristics listed in the table. In each case, the results are broken down by broad parental occupational group (professional class background and intermediate class background).
Table 4.4 then repeats the main specification, but with more detailed educational qualification controls and degree classification for those with an undergraduate degree. This is shown for men and women from professional and intermediate backgrounds once controlling for all factors in the main specification plus the detailed education controls. Table 4.5 shows the effect of education qualifications for those born in and outside the UK.
Tables 4.6 to 4.9 show our estimates using the cohort studies (BCS and NCDS). Tables 4.6 and 4.7 show all estimates for men and women, respectively, from professional parental class backgrounds. Tables 4.8 and 4.9 show the results for men and women, respectively, from intermediate class backgrounds. In each case, the first column shows the raw differences relative to the stated omitted category without accounting for other factors, the second column shows the results when controlling for other factors in the main specification and the third column shows the estimates after further controlling for early childhood factors (region of origin and skills measured at ages 10 and 11). In each case, the first 3 columns show this for the NCDS and the second set of 3 columns for the BCS.
All estimates for the cohort studies for a single age (33 in the NCDS, and 34 in the BCS) and no further controls for age or year are therefore required. The specification matches that for the LFS, with effects estimated using a logisitic model and marginal effects estimated at the mean.
In what follows we summarise the main results for each group of factors.
5.1 Education
We estimate that higher levels of educational qualifications lead to very substantial reductions in the chances of experiencing downward social mobility across men and women from all backgrounds and across all datasets. This is true in raw terms and when controlling for other factors in the main specification. We allow the effects of education to vary depending on whether individuals are from professional or intermediate backgrounds. The effects are slightly smaller for those from intermediate backgrounds, as they have less room to fall, but are still very substantial in all cases.
After controlling for other factors, having a degree or equivalent qualifications reduces the chances of downward mobility by around 50 to 60 percentage points for men and women from a professional background in the LFS and NCDS (relative to having qualifications below GCSE level). The BCS gives lower, but still substantial, effects of around 30 to 40 percentage points. For those from intermediate parental class backgrounds, the estimated effects are much more varied, with estimated effects of well over 60 percentage points in the NCDS, over 40 percentage points in the BCS and close to 40 percentage points in the LFS.
Possessing A-level or equivalent qualifications reduces chances of downward mobility by around 20 to 30 percentage points in most cases, relative to those with qualifications below GCSE level.
These are still large effects. Comparisons with the effects of degree qualifications further indicates that the extra effect of having a degree relative to A-level qualifications can reduce chances of downward mobility by around 20 percentage points.
Comparing across datasets over time, the estimated effects generally decline between the NCDS and BCS, but are slightly larger in the LFS than in the BCS. However, one should not put too much emphasis on the changes across datasets given the different ways in which parental occupation are measured and overall levels of downward mobility observed in each dataset. Furthermore, it is very clear that all datasets show that educational qualifications are one of the most substantial driving factors of patterns in downward mobility.
In Table 4.4, we examine whether there are differential effects of more detailed qualifications within each broad level in the LFS. This is shown for men and women from professional and intermediate backgrounds.
We break A-level and equivalent qualifications down to A-levels and other Level 3 qualifications. The results show that A-levels and other Level 3 qualifications seem to reduce chances of downward mobility by similar amounts, around 20 to 30 percentage points. There are no statistically significant differences between the effects of these qualifications. This indicates that taking other Level 3 qualifications instead of A-levels does not seem to put individuals at greater or lower risk of experiencing downward mobility.
We break down qualifications above Level 4 into a range of different categories: higher education diplomas; HNCS/HNDs; degree-level qualifications; postgraduate qualifications; and, other higher education qualifications (mainly teaching and nursing qualifications).
In general, degree and postgraduate qualifications have the largest effects in reducing chances of downward mobility. As compared with those with qualifications below GCSE level, degree level qualifications reduce chances of downward mobility by around 25 to 40 percentage points and postgraduate qualifications 40 to 60 percentage points. Other higher education qualifications have a similar overall effect as degree level qualifications. This is unsurprising as this group will also include a range of nursing and teaching qualifications.
Diplomas and HNCs/HNDs also reduce chances of downward mobility, but the effects are generally similar or smaller than the effects of A-levels or other Level 3 qualifications, with effects of around 20 to 30 percentage points. This suggests that taking Level 4/5 qualifications such as diplomas and HNCSs/HNDs do not seem to have any extra effect on the chances of experiencing downward mobility relative to Level 3 qualifications.
Table 4.4 shows that higher degree classification further reduce the chances of experiencing downward social mobility amongst graduates, particularly for women. For example, a first-class degree reduces chances of downward mobility by around 20 percentage points for men and 25 to 40 percentage points for women. Upper second-class degrees reduce chances of downward mobility by around 15 to 20 percentage points for men and 20 to 25 percentage points for women.
Figure 4.1 then shows that there are differences in chances of downward mobility amongst graduates by their main subject of study. The lowest chances of downward mobility are experienced by graduates who studied medicine, teaching and science subjects (7% to 12% chance of downward mobility for women, 4% to 10% for men). Graduates with the highest chances of downward mobility are female graduates in the arts, languages, technology and other graduates (20% to 24%). For men, the highest chances of downward mobility can be seen for arts graduates (22%).
Figure 4.1: Percentage of men and women experiencing downward mobility by main subject studied at university
| Subject studied at university (if any) | Percentage experiencing downward mobility: Men | Percentage experiencing downward mobility: Women |
|---|---|---|
| Medicine and related | 4% | 7% |
| Education | 7% | 9% |
| Maths and computing | 6% | 10% |
| Physics and engineering | 8% | 12% |
| Biology | 10% | 12% |
| Architecture | 8% | 13% |
| Law and social science | 9% | 14% |
| Business | 13% | 15% |
| English | 13% | 16% |
| History | 12% | 16% |
| Agriculture | 5% | 16% |
| Other graduates | 14% | 20% |
| Design and technology | 13% | 21% |
| Languages | 8% | 21% |
| Arts | 22% | 24% |
| Non-graduates | 26% | 28% |
Notes and sources: Authors’ calculations using the Labour Force Survey July to September 2014 to 2018.
5.2 Early life skills
The 3rd and 6th columns of Tables 4.5 to 4.8 show the estimated effects of all characteristics once controlling for early life skills and the estimated effects of such skills.
In general, the estimated effects of educational qualifications are slightly reduced when controlling for early life skills. For example, the estimated effects of having a degree reduces from 57 to 44 percentage points and from 59 to 50 percentage points for men and women, respectively, from professional class backgrounds in the NCDS. In the BCS, the effects reduce from 28 to 26 for men from professional class backgrounds and from 37 to 30 percentage points for women from professional backgrounds.
The direct effects of early life skills are slightly volatile. Maths skills are observed to reduce downward mobility for men in the NCDS, with a one standard deviation higher maths score at age 11 associated with a 4 to 8 percentage point lower chance of downward mobility. However, there are no statistically significant effects in the BCS.
The opposite is true for women from professional backgrounds, with no statistically significant effects of maths skills in the NCDS, but reduced chances in the BCS. For women from intermediate backgrounds, maths skills reduce the chances of downward mobility in the NCDS and BCS, with a one standard deviation higher maths score at age 11/10 associated with 4 to 6 percentage points lower probability of being downwardly mobile.
There are also significant effects of reading skills for women from professional backgrounds in the BCS, and men from intermediate backgrounds in the NCDS and BCS, with a one standard deviation higher reading score at 11/10 associated with a 3 to 4 percentage points lower probability of being downwardly mobile.
General ability (IQ) only reduces chances of downward mobility for women from intermediate backgrounds in the NCDS. Higher externalising behaviour scores are associated with more downward mobility for professional women in the NCDS only.
In general, it is notable that the effects of early life skills are relatively small. A one standard deviation change in children’s skills levels would represent a substantial change in skills levels, but is only associated with changes in the chances of downward mobility of 5 to 10 percentage points at most. This contrasts sharply with effects of formal educational qualifications of 20 percentage points or more. The effects of educational qualifications only reduce slightly when controlling for early life skills too. This strongly suggests that formal qualifications matter much more for chances of downward mobility than underlying skill levels observed during childhood.
5.3 Children
Once controlling for all factors, having more children increases the chances of experiencing downward mobility for women, but has only a small effect for men.
The effects of having children have declined markedly across cohorts for women. In the NCDS, having 4 or more children increased chances of downward mobility by over 40 percentage points (as compared with having no children). Chances of experiencing downward mobility also rose with each extra child up to 4 or more children. In the LFS and BCS, the effect of having 4 or more children, relative to having no children, has reduced to around 10 to 15 percentage points, once controlling for all factors. This suggests that the effect of caring responsibilities on the career ambitions of women have declined markedly over time, but are still relatively substantial.
Amongst men from professional backgrounds, having 4 or more children increased chances of downward mobility by over 15 percentage points in the NCDS. However, the effects are close to zero and rarely statistically significant for men in the BCS and LFS.
5.4 Ethnicity
Analysis of the effects of ethnicity is based on the LFS alone and all differences are estimated relative to men and women from White British backgrounds. All estimated effects discussed below relate to those seen after controlling for other factors in the main specifications, including education.
Being born outside the UK slightly increases the chances of downward mobility for women by about 6 to 7 percentage points and for men by about 3 to 4 percentage points, after controlling for other factors in the main specification.
Amongst those from professional backgrounds, Bangladeshi men and women are about 20 percentage points more likely to experience downward mobility, while Pakistani and Black African men are also 15 to 20 percentage points more likely to experience downward mobility. Men from Other, Mixed and Other Asian backgrounds are about 10 percentage points more likely to experience downward mobility.
Amongst those from intermediate backgrounds, differences are generally smaller. Men and women from Black African and Other Asian backgrounds are about 10 percentage points more likely to experience downward mobility. Men and women from Indian, Bangladeshi, Mixed and Other backgrounds are about 5 percentage points more likely.
Irrespective of professional/intermediate background, men and women from White Other backgrounds are about 10 to 15 percentage point less likely to experience downward mobility. Men from Chinese backgrounds are also 10 percentage points less likely to experience downward mobility.
These effects appear to be concentrated and largely driven by individuals born outside the UK. This is partly because over two-thirds of adults aged 30 to 59 from Black and Minority Ethnic groups were born outside the UK, as is shown in Figure 4.2, rising to around 90% from Black-African backgrounds. The only exception is individuals from Black-Caribbean backgrounds, only 30% of whom were born outside the UK. This is consistent with observed migration patterns from different continents over the past 50 years (Windrush generation compared to more recent African migration). Figure 4.3 then shows that amongst ethnic groups with sufficient sample sizes, downward mobility was higher amongst those born outside the UK.
We further explored the differential effects of education qualifications for those born outside the UK (see Table 4.5). In general, higher educational qualifications reduce the chances of downward mobility more for those born outside the UK than those born inside the UK, particularly those from professional backgrounds. For example, having a higher education qualification reduces chances of downward mobility by 50 percentage points for those born in the UK and by 60 percentage points for those born outside the UK (amongst those from professional backgrounds). This could be explained if formal qualifications are more important for immigrants, given that other details of their background could be less familiar to employers.
It is also notable that individuals born outside the UK are more likely to have a higher education qualification or above (45%) than those born in the UK (39%). Individuals born outside the UK are also more likely to have missing qualifications data (over 15% for those born outside the UK, compared with 2% for those born in the UK), which actually tends to reduce chances of downward mobility (suggesting that missing may relate to other qualifications that are poorly recorded in the LFS).
In summary, many Black and Minority Ethnic groups experience higher chances of downward mobility, particularly individuals from Black African, Bangladeshi and Other Asian backgrounds. These effects are largely driven and concentrated amongst adults who were not born in the UK. These effects are strong even after controlling for education qualifications. There is also no evidence of differential effects of educational qualifications depending on whether individuals were born in the UK, though the degree of missing data makes it difficult to understand in detail using the data we have available. These findings are therefore deeply troubling, suggesting that individuals from certain ethnic minority backgrounds are at substantially higher risk of downward mobility even after controlling for their educational qualifications.
Figure 4.2: Percentage of men and women from different ethnic backgrounds born outside the UK
| Ethnicity | Percentage born outside the UK: Men | Percentage born outside the UK: Women |
|---|---|---|
| White British | 3% | 4% |
| White Other | 63% | 63% |
| Indian | 70% | 67% |
| Pakistani | 70% | 49% |
| Bangladeshi | 85% | 64% |
| Chinese | 82% | 83% |
| Other Asian | 90% | 90% |
| Black African | 89% | 89% |
| Black Caribbean | 30% | 35% |
| Other | 86% | 83% |
| Mixed | 88% | 88% |
Notes and sources: Authors’ calculations using the Labour Force Survey July to September 2014 to 2018.
Figure 4.3: Chances of downward mobility by ethnic group and whether individuals were born in the UK
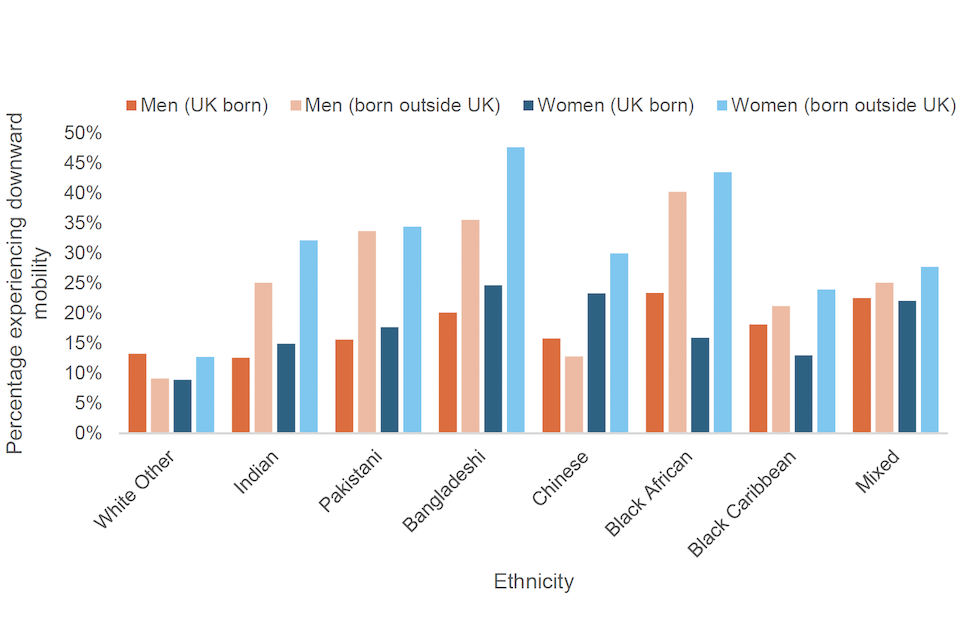
Notes and sources: Authors’ calculations using the Labour Force Survey July to September 2014 to 2018. Individuals aged 30 to 59. Not all ethnic groups are shown due to low sample sizes in some cases.
5.5 Region
The effects of destination region (the region at the time of the survey in adulthood) are generally small once controlling for other factors.
Once controlling for all factors, destination region effects are mostly small in the LFS. Men living in the East, South-East and London are about 5 to 8 percentage points less likely to experience downward mobility (relative to the North West) and women in London are about 5 percentage points less likely. Men and women in the North East are about 3 to 5 percentage points more likely to experience downward mobility. All other effects in the LFS are either small (less than 3 percentage points) or not statistically significant.
Effects in cohort studies are volatile and subject to high statistical uncertainty, with few estimates being statistically significant. Men from professional backgrounds in the BCS are significantly less likely to be downwardly mobile in the Midlands, East and South East (which includes London), relative to the North West. Men from intermediate class backgrounds in Wales are also significantly less likely to experience downward mobility. All other regional differences for men are statistically insignificant.
Amongst women, there are very few statistically significant differences in the cohort studies. Women from professional backgrounds in the Midlands and Scotland are significantly more likely to experience downward mobility. Women from intermediate backgrounds are more likely to experience downward mobility in the South East and London, and the North.
In summary, the regional differences seem less robust and more volatile, particularly for the cohort studies. The only clear conclusion emerging is lower levels of downward mobility in London and the South East.
In the cohort studies, we are able to further extend this analysis by looking at region of origin (at age 11/10), as well as destination region. Figure 4.4 shows the raw levels of downward mobility by region of origin for men and women in the NCDS, while Figure 4.5 shows the equivalent for the BCS.
This shows that individuals from the South East (including London), East and South West tend to experience higher levels of downward mobility, particularly amongst women. However, when we control for other factors in our regression analysis, the differences are generally small or statistically insignificant, subject to a high degree of statistical uncertainty and with no clear or consistent pattern. This suggests that most of the raw differences by region of origin are more likely to be explained the characteristics of individuals from those areas rather than a large causal effects of region of origin
Figure 4.4: Percentage of men and women experiencing downward mobility at age 33 by region of origin in the NCDS
| Region of origin | Percentage experiencing downward mobility: Men | Percentage experiencing downward mobility: Women |
|---|---|---|
| North | 23% | 27% |
| Yorkshire and Humber | 27% | 32% |
| North West | 29% | 31% |
| Midlands | 26% | 36% |
| East of England | 27% | 41% |
| South East | 28% | 38% |
| South West | 32% | 40% |
| Wales | 25% | 34% |
| Scotland | 25% | 29% |
Figure 4.5: Percentage of men and women experiencing downward mobility at age 34 by region of origin in the BCS
| Region of origin | Percentage experiencing downward mobility: Men | Percentage experiencing downward mobility: Women |
|---|---|---|
| North | 21% | 20% |
| Yorkshire and Humber | 25% | 28% |
| North West | 21% | 27% |
| Midlands | 19% | 26% |
| East of England | 21% | 32% |
| South East | 21% | 27% |
| South West | 23% | 34% |
| Wales | 20% | 25% |
| Scotland | 19% | 24% |
5.6 Regression results
Table 4.2: Effect of individual characteristics on chances of experiencing downward social mobility for men aged 30 to 59 in the Labour Force Survey 2014 to 2018, before and after controlling for other characteristics
| Professional: raw | Professional: conditional | Intermediate: raw | Intermediate: conditional | |
|---|---|---|---|---|
| Educational qualifications | ||||
| Less than Level 2 | omitted | omitted | omitted | omitted |
| Level 2 (GCSEs) | -0.164*** | -0.130*** | -0.112*** | -0.063*** |
| (0.018) | (0.017) | (0.011) | (0.009) | |
| Level 3 (A-level) | -0.326*** | -0.266*** | -0.242*** | -0.178*** |
| (0.016) | (0.016) | (0.010) | (0.008) | |
| Level 4 (Degree) | -0.587*** | -0.503*** | -0.361*** | -0.364*** |
| (0.016) | (0.015) | (0.011) | (0.011) | |
| Missing /Undefined | -0.043* | -0.052** | 0.008 | -0.021* |
| (0.022) | (0.023) | (0.014) | (0.011) | |
| Ethnicity | ||||
| White British | omitted | omitted | omitted | omitted |
| White Other | -0.179*** | -0.166*** | -0.135*** | -0.069 |
| (0.048) | (0.053) | (0.038) | (0.045) | |
| Indian | -0.044** | 0.021 | -0.018 | 0.053*** |
| (0.021) | (0.020) | (0.020) | (0.020) | |
| Pakistani | 0.242*** | 0.203*** | -0.006 | -0.001 |
| (0.029) | (0.028) | (0.028) | (0.027) | |
| Bangladeshi | 0.265*** | 0.195*** | 0.060 | 0.052 |
| (0.043) | (0.043) | (0.037) | (0.035) | |
| Chinese | -0.163*** | -0.105* | -0.141*** | -0.126** |
| (0.048) | (0.054) | (0.042) | (0.053) | |
| Other Asian | 0.099*** | 0.100*** | 0.064** | 0.084*** |
| (0.032) | (0.030) | (0.030) | (0.028) | |
| Black African | 0.176*** | 0.159*** | 0.083*** | 0.128*** |
| (0.028) | (0.026) | (0.027) | (0.026) | |
| Black Caribbean | 0.076 | 0.044 | 0.031 | 0.017 |
| (0.051) | (0.047) | (0.032) | (0.031) | |
| Other | 0.086*** | 0.085*** | 0.073*** | 0.066*** |
| (0.026) | (0.026) | (0.027) | (0.025) | |
| Mixed | 0.012 | 0.045*** | 0.030* | 0.060*** |
| (0.017) | (0.017) | (0.017) | (0.017) | |
| Born Outside UK | 0.024* | 0.035*** | 0.074*** | 0.052*** |
| (0.014) | (0.013) | (0.014) | (0.013) | |
| Number of children | ||||
| No Children | omitted | omitted | omitted | omitted |
| 1 | -0.050*** | -0.054*** | -0.055*** | -0.054*** |
| (0.010) | (0.009) | (0.009) | (0.008) | |
| 2 | -0.099*** | -0.089*** | -0.065*** | -0.061*** |
| (0.010) | (0.009) | (0.009) | (0.009) | |
| 3 | -0.023 | -0.037** | -0.042*** | -0.066*** |
| (0.016) | (0.015) | (0.014) | (0.014) | |
| 4+ | 0.068** | -0.042 | 0.033 | -0.020 |
| (0.031) | (0.028) | (0.023) | (0.021) | |
| Any children aged under 5 | 0.009 | 0.014 | -0.017* | -0.003 |
| (0.011) | (0.010) | (0.010) | (0.010) | |
| Destination region | ||||
| North West | omitted | omitted | omitted | omitted |
| North East | 0.022 | 0.022 | 0.055*** | 0.054*** |
| (0.023) | (0.019) | (0.019) | (0.015) | |
| Yorkshire and Humber | -0.008 | -0.011 | 0.001 | -0.000 |
| (0.017) | (0.015) | (0.014) | (0.013) | |
| East Midlands | -0.015 | -0.020 | 0.008 | 0.000 |
| (0.017) | (0.015) | (0.015) | (0.013) | |
| West Midlands | 0.011 | -0.003 | -0.000 | -0.018 |
| (0.017) | (0.015) | (0.014) | (0.012) | |
| East of England | -0.072*** | -0.065*** | -0.040*** | -0.039*** |
| (0.016) | (0.014) | (0.013) | (0.012) | |
| London | -0.113*** | -0.083*** | -0.050*** | -0.072*** |
| (0.014) | (0.014) | (0.012) | (0.013) | |
| South East | -0.093*** | -0.071*** | -0.075*** | -0.071*** |
| (0.014) | (0.012) | (0.012) | (0.012) | |
| South West | -0.049*** | -0.028** | -0.044*** | -0.029** |
| (0.016) | (0.014) | (0.014) | (0.013) | |
| Wales | 0.027 | 0.035* | -0.006 | -0.000 |
| (0.021) | (0.018) | (0.017) | (0.015) | |
| Scotland | -0.027 | 0.011 | 0.005 | 0.033*** |
| (0.017) | (0.015) | (0.014) | (0.013) | |
| Northern Ireland | 0.010 | 0.027 | 0.013 | 0.029** |
| (0.030) | (0.022) | (0.019) | (0.015) | |
| Number of observations | 19,087 | 19,087 | 18,304 | 18,304 |
| NS-SEC Class and Age | Yes | Yes | Yes | Yes |
| All other controls | No | Yes | No | Yes |
Notes and sources: Authors’ calculations using the Labour Force Survey; Figures shown are the estimated reduction in chances of experiencing downward social mobility for each group relative to the omitted category. The first 2 columns show the raw differences and that after controlling for other characteristics listed in the table for individuals from a professional parental class background. The second set of columns shows the equivalent for those from an intermediate parental class background. Conditional estimates are estimated using a Logit model and represent marginal differences estimated at the mean value for all characteristics. *** indicates statistical significance at the 1% level, ** at the 5% level and * at the 10% level.
Table 4.3: Effect of individual characteristics on chances of experiencing downward social mobility for women aged 30 to 59 in the Labour Force Survey 2014 to 2018, before and after controlling for other characteristics
| Professional: raw | Professional: conditional | Intermediate: raw | Intermediate: conditional | |
|---|---|---|---|---|
| Educational qualifications | ||||
| Less than Level 2 | omitted | omitted | omitted | omitted |
| Level 2 (GCSEs) | -0.117*** | -0.132*** | -0.236*** | -0.135*** |
| (0.020) | (0.023) | (0.012) | (0.009) | |
| Level 3 (A-level) | -0.331*** | -0.328*** | -0.388*** | -0.272*** |
| (0.019) | (0.021) | (0.011) | (0.009) | |
| Level 4 (Degree) | -0.579*** | -0.548*** | -0.496*** | -0.425*** |
| (0.018) | (0.021) | (0.012) | (0.010) | |
| Missing /Undefined | -0.169*** | -0.207*** | -0.114*** | -0.110*** |
| (0.026) | (0.028) | (0.016) | (0.013) | |
| Ethnicity | ||||
| White British | omitted | omitted | omitted | omitted |
| White Other | -0.210*** | -0.174*** | -0.201*** | -0.184*** |
| (0.046) | (0.049) | (0.038) | (0.056) | |
| Indian | -0.040* | 0.006 | 0.010 | 0.060*** |
| (0.022) | (0.021) | (0.022) | (0.021) | |
| Pakistani | 0.082** | 0.058 | 0.071* | 0.044 |
| (0.038) | (0.036) | (0.037) | (0.034) | |
| Bangladeshi | 0.206*** | 0.170*** | 0.106* | 0.056 |
| (0.061) | (0.060) | (0.062) | (0.059) | |
| Chinese | -0.034 | -0.001 | -0.055 | -0.008 |
| (0.040) | (0.038) | (0.042) | (0.043) | |
| Other Asian | 0.046 | 0.047 | 0.135*** | 0.112*** |
| (0.031) | (0.029) | (0.027) | (0.024) | |
| Black African | 0.085*** | 0.020 | 0.137*** | 0.112*** |
| (0.026) | (0.025) | (0.025) | (0.024) | |
| Black Caribbean | -0.036 | -0.029 | -0.026 | -0.007 |
| (0.041) | (0.041) | (0.028) | (0.030) | |
| Other | 0.039 | 0.041 | 0.071*** | 0.096*** |
| (0.028) | (0.027) | (0.026) | (0.024) | |
| Mixed | -0.042** | -0.000 | 0.015 | 0.048*** |
| (0.017) | (0.016) | (0.016) | (0.016) | |
| Born Outside UK | 0.061*** | 0.067*** | 0.083*** | 0.060*** |
| (0.013) | (0.012) | (0.013) | (0.013) | |
| Number of children | ||||
| No Children | omitted | omitted | omitted | omitted |
| 1 | 0.062*** | 0.043*** | 0.015* | 0.007 |
| (0.010) | (0.009) | (0.009) | (0.008) | |
| 2 | 0.061*** | 0.070*** | 0.009 | 0.019** |
| (0.010) | (0.009) | (0.009) | (0.009) | |
| 3 | 0.142*** | 0.128*** | 0.089*** | 0.067*** |
| (0.016) | (0.015) | (0.015) | (0.014) | |
| 4+ | 0.265*** | 0.154*** | 0.180*** | 0.092*** |
| (0.035) | (0.032) | (0.026) | (0.022) | |
| Any children aged under 5 | -0.089*** | -0.060*** | -0.046*** | -0.026** |
| (0.011) | (0.010) | (0.010) | (0.010) | |
| Destination region | ||||
| North West | omitted | omitted | omitted | omitted |
| North East | -0.002 | 0.000 | 0.033* | 0.036** |
| (0.023) | (0.020) | (0.018) | (0.016) | |
| Yorkshire and Humber | -0.001 | -0.004 | 0.011 | 0.003 |
| (0.017) | (0.015) | (0.015) | (0.013) | |
| East Midlands | 0.014 | 0.004 | 0.023 | 0.002 |
| (0.017) | (0.016) | (0.015) | (0.013) | |
| West Midlands | -0.001 | -0.021 | 0.012 | -0.001 |
| (0.017) | (0.015) | (0.014) | (0.013) | |
| East of England | -0.002 | -0.017 | 0.004 | -0.012 |
| (0.015) | (0.014) | (0.013) | (0.012) | |
| London | -0.082*** | -0.058*** | -0.012 | -0.050*** |
| (0.014) | (0.014) | (0.013) | (0.014) | |
| South East | -0.020 | -0.010 | -0.025** | -0.028** |
| (0.014) | (0.013) | (0.012) | (0.012) | |
| South West | 0.003 | 0.013 | 0.004 | 0.012 |
| (0.016) | (0.014) | (0.014) | (0.013) | |
| Wales | -0.019 | -0.010 | 0.011 | 0.023 |
| (0.020) | (0.019) | (0.017) | (0.015) | |
| Scotland | -0.023 | 0.012 | -0.000 | 0.036*** |
| (0.016) | (0.015) | (0.014) | (0.013) | |
| Northern Ireland | -0.009 | 0.004 | 0.010 | 0.016 |
| (0.029) | (0.022) | (0.020) | (0.016) | |
| Number of observations | 20,545 | 20,545 | 19,246 | 19,246 |
| NS-SEC Class and Age | Yes | Yes | Yes | Yes |
| All other controls | No | Yes | No | Yes |
Notes and sources: Authors’ calculations using the Labour Force Survey; Figures shown are the estimated reduction in chances of experiencing downward social mobility for each group relative to the omitted category. The first 2 columns show the raw differences and that after controlling for other characteristics listed in the table for individuals from a professional parental class background. The second set of columns shows the equivalent for those from an intermediate parental class background. Conditional estimates are estimated using a Logit model and represent marginal differences estimated at the mean value for all characteristics. *** indicates statistical significance at the 1% level, ** at the 5% level and * at the 10% level.
Table 4.4: Effect of detailed education qualifications on chances of experiencing downward social mobility for men and women aged 30 to 59 in the Labour Force Survey 2014 to 2018, after controlling for other characteristics
| Professional: raw | Professional: conditional | Intermediate: raw | Intermediate: conditional | |
|---|---|---|---|---|
| Educational qualifications | ||||
| Less than Level 2 | omitted | omitted | omitted | omitted |
| Level 2 (GCSEs) | -0.131*** | -0.065*** | -0.132*** | -0.136*** |
| (0.017) | (0.009) | (0.023) | (0.009) | |
| A-levels | -0.286*** | -0.181*** | -0.313*** | -0.283*** |
| (0.017) | (0.010) | (0.022) | (0.011) | |
| Other Level 3 | -0.286*** | -0.184*** | -0.374*** | -0.278*** |
| (0.016) | (0.009) | (0.021) | (0.010) | |
| Degree-level | -0.379*** | -0.250*** | -0.425*** | -0.345*** |
| (0.019) | (0.022) | (0.023) | (0.019) | |
| HE Diploma | -0.220*** | -0.235*** | -0.281*** | -0.279*** |
| (0.045) | (0.065) | (0.038) | (0.038) | |
| HNC / HND | -0.231*** | -0.244*** | -0.256*** | -0.315*** |
| (0.026) | (0.029) | (0.033) | (0.032) | |
| Other HE | -0.418*** | -0.206*** | -0.525*** | -0.360*** |
| (0.023) | (0.025) | (0.025) | (0.022) | |
| Post-graduate or higher | -0.525*** | -0.388*** | -0.595*** | -0.479*** |
| (0.020) | (0.030) | (0.024) | (0.027) | |
| Missing Qualifications | -0.052** | -0.018* | -0.202*** | -0.106*** |
| (0.023) | (0.011) | (0.028) | (0.013) | |
| Degree classification | ||||
| First Class | -0.207*** | -0.402*** | -0.192*** | -0.265*** |
| (0.025) | (0.103) | (0.023) | (0.064) | |
| Upper Second | -0.197*** | -0.251*** | -0.140*** | -0.192*** |
| (0.014) | (0.032) | (0.012) | (0.024) | |
| Lower Second | -0.128*** | -0.248*** | -0.085*** | -0.133*** |
| (0.014) | (0.037) | (0.014) | (0.026) | |
| Third | -0.090*** | -0.173** | -0.096** | -0.130 |
| (0.027) | (0.067) | (0.038) | (0.080) | |
| Pass | omitted | omitted | omitted | omitted |
| Missing classification | -0.099*** | -0.069*** | -0.026* | -0.016 |
| (0.014) | (0.018) | (0.013) | (0.016) | |
| Number of observations | 19087 | 18304 | 20545 | 19246 |
| Ethnicity, region and | Yes | Yes | Yes | Yes |
| NS-SEC Class and Age | Yes | Yes | Yes | Yes |
Notes and sources: Authors’ calculations using the Labour Force Survey; Figures shown are the estimated reduction in chances of experiencing downward social mobility for each education group relative to the omitted category. Conditional estimates are estimated using a Logit model and represent marginal differences estimated at the mean value for all characteristics. *** indicates statistical significance at the 1% level, ** at the 5% level and * at the 10% level.
Table 4.5: Effect of individual characteristics on chances of experiencing downward social mobility for individuals born in and outside the UK in the Labour Force Survey 2014 to 2018, before and after controlling for other characteristics
| Professional: born in UK | Professional: born outside UK | Intermediate: born in UK | Intermediate: born outside UK | |
|---|---|---|---|---|
| Educational qualifications | ||||
| Less than Level 2 | omitted | omitted | omitted | omitted |
| Level 2 (GCSEs) | -0.114*** | -0.176*** | -0.091*** | -0.083*** |
| [0.015] | [0.045] | [0.007] | [0.022] | |
| Level 3 (A-level) | -0.276*** | -0.381*** | -0.212*** | -0.250*** |
| [0.014] | [0.038] | [0.006] | [0.018] | |
| Level 4 (Degree) | -0.507*** | -0.595*** | -0.392*** | -0.388*** |
| [0.013] | [0.036] | [0.008] | [0.017] | |
| Missing /Undefined | -0.100*** | -0.208*** | -0.043*** | -0.079*** |
| [0.023] | [0.041] | [0.010] | [0.018] | |
| Number of observations | 32,338 | 7,294 | 31,555 | 5,995 |
| Ethnicity, Region, Number of Children NS-SEC Class and Age | Yes | Yes | Yes | Yes |
Notes and sources: Authors’ calculations using the Labour Force Survey; Figures shown are the estimated reduction in chances of experiencing downward social mobility for each group relative to the omitted category. All figures control for ethnicity, region, number of children, age and NS-SEC parental occupation. Conditional estimates are estimated using a Logit model and represent marginal differences estimated at the mean value for all characteristics. *** indicates statistical significance at the 1% level, ** at the 5% level and * at the 10% level.
Table 4.6: Effect of individual characteristics on chances of experiencing downward social mobility for men from professional class backgrounds in the NCDS and BCS, before and after controlling for other characteristics and early life skills
| NCDS: raw | NCDS: conditional | NCDS: after skill controls | BCS: raw | BCS: conditional | BCS: after skill controls | |
|---|---|---|---|---|---|---|
| Educational | ||||||
| Less than Level 2 | omitted | omitted | omitted | omitted | omitted | omitted |
| Level 2 (GCSEs) | -0.102*** | -0.089*** | -0.052* | -0.082*** | -0.081*** | -0.068*** |
| (0.030) | (0.031) | (0.031) | (0.022) | (0.022) | (0.023) | |
| Level 3 (A-level) | -0.297*** | -0.283*** | -0.219*** | -0.186*** | -0.175*** | -0.152*** |
| (0.024) | (0.025) | (0.029) | (0.028) | (0.027) | (0.029) | |
| Level 4 (Degree) | -0.589*** | -0.566*** | -0.438*** | -0.288*** | -0.279*** | -0.256*** |
| (0.055) | (0.053) | (0.054) | (0.033) | (0.031) | (0.032) | |
| Children | ||||||
| No Children | omitted | omitted | omitted | omitted | omitted | omitted |
| 1 | 0.068* | 0.054 | 0.041 | 0.019 | -0.008 | -0.012 |
| (0.038) | (0.033) | (0.031) | (0.026) | (0.024) | (0.024) | |
| 2 | 0.024 | 0.002 | 0.012 | -0.038 | -0.044* | -0.036 |
| (0.033) | (0.028) | (0.027) | (0.031) | (0.027) | (0.026) | |
| 3 | 0.153*** | 0.123*** | 0.111*** | 0.020 | -0.027 | -0.016 |
| (0.045) | (0.040) | (0.040) | (0.049) | (0.043) | (0.045) | |
| 4+ | 0.208** | 0.165** | 0.119 | omitted | omitted | omitted |
| (0.087) | (0.078) | (0.080) | ||||
| Destination region | ||||||
| North West | omitted | omitted | omitted | omitted | omitted | omitted |
| North | -0.019 | -0.018 | 0.000 | -0.108 | -0.081 | -0.110 |
| (0.075) | (0.065) | (0.087) | (0.093) | (0.079) | (0.097) | |
| Yorkshire and Humber | 0.036 | 0.059 | 0.005 | -0.021 | 0.009 | -0.072 |
| (0.058) | (0.050) | (0.070) | (0.039) | (0.036) | (0.060) | |
| Midlands | -0.050 | -0.012 | -0.000 | -0.130*** | -0.095*** | -0.215*** |
| (0.050) | (0.043) | (0.058) | (0.043) | (0.036) | (0.056) | |
| East of England | -0.098* | -0.052 | -0.049 | -0.090** | -0.080** | -0.139*** |
| (0.055) | (0.046) | (0.062) | (0.043) | (0.037) | (0.051) | |
| SE and London | -0.132*** | -0.053 | -0.083 | -0.104*** | -0.055* | -0.109** |
| (0.046) | (0.040) | (0.059) | (0.035) | (0.031) | (0.046) | |
| South West | -0.006 | 0.019 | 0.029 | -0.042 | -0.020 | -0.055 |
| (0.054) | (0.047) | (0.063) | (0.042) | (0.039) | (0.050) | |
| Wales | 0.031 | 0.044 | 0.021 | -0.038 | -0.026 | -0.061 |
| (0.068) | (0.062) | (0.082) | (0.054) | (0.048) | (0.077) | |
| Scotland | -0.008 | 0.051 | 0.188* | -0.067 | -0.022 | -0.036 |
| (0.064) | (0.057) | (0.105) | (0.046) | (0.044) | (0.115) | |
| Early skills | ||||||
| General ability | 0.012 | -0.014 | ||||
| (0.023) | (0.014) | |||||
| Maths | -0.077*** | -0.027 | ||||
| (0.021) | (0.020) | |||||
| Reading | -0.012 | -0.009 | ||||
| (0.017) | (0.018) | |||||
| Internalising | -0.008 | 0.004 | ||||
| (0.013) | (0.012) | |||||
| Externalising | 0.009 | -0.008 | ||||
| (0.012) | (0.012) | |||||
| Origin region | ||||||
| North West | omitted | omitted | ||||
| North | -0.029 | 0.086 | ||||
| (0.077) | (0.069) | |||||
| Yorkshire and Humber | 0.045 | 0.114* | ||||
| (0.074) | (0.066) | |||||
| Midlands | -0.041 | 0.155*** | ||||
| (0.062) | (0.056) | |||||
| East of England | -0.049 | 0.101 | ||||
| (0.068) | (0.063) | |||||
| SE and London | 0.015 | 0.074 | ||||
| (0.061) | (0.051) | |||||
| South West | -0.036 | 0.044 | ||||
| (0.072) | (0.054) | |||||
| Wales | 0.012 | 0.082 | ||||
| (0.082) | (0.076) | |||||
| Scotland | -0.173 | 0.042 | ||||
| (0.108) | (0.117) | |||||
| Number of observations | 930 | 930 | 930 | 745 | 745 | 745 |
| NS-SEC Class and Age | Yes | Yes | Yes | Yes | Yes | Yes |
| Demographic controls | No | Yes | Yes | No | Yes | Yes |
| Early life ability | No | No | Yes | No | No | Yes |
Notes and sources: Authors’ calculations using the National Childhood Development Survey and the Birth Cohort Study; Figures shown are the estimated reduction in chances of experiencing downward social mobility for each group relative to the omitted category at age 33 in NCDS and age 34 in BCS. For each dataset, the first column shows the raw differences, the second that after controlling for other demographic characteristics listed in the table and the third after controlling for early life skills and region of origin. Early skills include measures of cognitive abilities (general abilities, maths and reading) and non-cognitive skills (Rutter scores of internalising and externalising behaviours) at age 11/10. Conditional estimates are estimated using a Logit model and represent marginal differences estimated at the mean value for all characteristics. *** indicates statistical significance at the 1% level, ** at the 5% level and * at the 10% level.
Table 4.7: Effect of individual characteristics on chances of experiencing downward social mobility for women from professional class backgrounds in the NCDS and BCS, before and after controlling for other characteristics and early life skills
| NCDS: raw | NCDS: conditional | NCDS: after skill controls | BCS: raw | BCS: conditional | BCS: after skill controls | |
|---|---|---|---|---|---|---|
| Educational | ||||||
| Less than Level 2 | omitted | omitted | omitted | omitted | omitted | omitted |
| Level 2 (GCSEs) | -0.112** | -0.113*** | -0.075* | -0.141*** | -0.131*** | -0.119*** |
| (0.044) | (0.043) | (0.044) | (0.033) | (0.032) | (0.033) | |
| Level 3 (A-level) | -0.408*** | -0.389*** | -0.328*** | -0.216*** | -0.206*** | -0.157*** |
| (0.035) | (0.035) | (0.040) | (0.031) | (0.032) | (0.034) | |
| Level 4 (Degree) | -0.634*** | -0.586*** | -0.501*** | -0.412*** | -0.374*** | -0.304*** |
| (0.045) | (0.044) | (0.053) | (0.032) | (0.032) | (0.036) | |
| Children | ||||||
| No Children | omitted | omitted | omitted | omitted | omitted | omitted |
| 1 | 0.124*** | 0.044 | 0.045 | 0.094*** | 0.069** | 0.072** |
| (0.047) | (0.040) | (0.039) | (0.036) | (0.032) | (0.031) | |
| 2 | 0.243*** | 0.144*** | 0.134*** | 0.187*** | 0.129*** | 0.128*** |
| (0.037) | (0.032) | (0.032) | (0.031) | (0.027) | (0.027) | |
| 3 | 0.361*** | 0.217*** | 0.211*** | 0.281*** | 0.200*** | 0.210*** |
| (0.044) | (0.040) | (0.040) | (0.046) | (0.043) | (0.043) | |
| 4+ | 0.434*** | 0.222*** | 0.200** | 0.198* | 0.137 | 0.178 |
| (0.092) | (0.079) | (0.078) | (0.113) | (0.110) | (0.115) | |
| Destination region | ||||||
| North West | omitted | omitted | omitted | omitted | omitted | omitted |
| North | -0.030 | 0.028 | -0.029 | 0.044 | 0.084 | 0.146 |
| (0.096) | (0.078) | (0.098) | (0.076) | (0.065) | (0.113) | |
| Yorkshire and Humber | -0.052 | 0.020 | 0.072 | 0.003 | 0.022 | 0.031 |
| (0.075) | (0.061) | (0.089) | (0.058) | (0.050) | (0.077) | |
| Midlands | -0.008 | 0.041 | 0.024 | 0.066 | 0.025 | 0.083 |
| (0.060) | (0.048) | (0.067) | (0.048) | (0.043) | (0.064) | |
| East of England | -0.109 | -0.023 | -0.052 | -0.013 | 0.003 | 0.036 |
| (0.067) | (0.054) | (0.071) | (0.054) | (0.047) | (0.066) | |
| SE and London | -0.118** | 0.006 | -0.020 | -0.051 | 0.001 | 0.059 |
| (0.052) | (0.042) | (0.059) | (0.046) | (0.041) | (0.060) | |
| South West | 0.031 | 0.038 | -0.025 | -0.002 | -0.003 | -0.009 |
| (0.066) | (0.052) | (0.067) | (0.054) | (0.047) | (0.073) | |
| Wales | -0.047 | 0.009 | -0.037 | -0.044 | -0.020 | 0.096 |
| (0.089) | (0.072) | (0.097) | (0.084) | (0.072) | (0.115) | |
| Scotland | -0.071 | 0.022 | 0.013 | -0.056 | -0.004 | 0.079 |
| (0.066) | (0.052) | (0.082) | (0.059) | (0.051) | (0.128) | |
| Early skills | ||||||
| General ability | -0.027 | -0.001 | ||||
| (0.026) | (0.019) | |||||
| Maths | -0.004 | -0.051** | ||||
| (0.024) | (0.021) | |||||
| Reading | -0.017 | -0.029 | ||||
| (0.023) | (0.020) | |||||
| Internalising | 0.002 | -0.003 | ||||
| (0.015) | (0.013) | |||||
| Externalising | 0.040** | -0.001 | ||||
| (0.016) | (0.014) | |||||
| Origin region | ||||||
| North West | omitted | omitted | ||||
| North | 0.081 | -0.087 | ||||
| (0.082) | (0.107) | |||||
| Yorkshire and Humber | -0.077 | -0.009 | ||||
| (0.100) | (0.075) | |||||
| Midlands | 0.029 | -0.086 | ||||
| (0.066) | (0.065) | |||||
| East of England | 0.063 | 0.065 | ||||
| (0.069) | (0.077) | |||||
| SE and London | 0.043 | -0.065 | ||||
| (0.060) | (0.059) | |||||
| South West | 0.170** | 0.010 | ||||
| (0.077) | (0.069) | |||||
| Wales | 0.084 | -0.160 | ||||
| (0.099) | (0.110) | |||||
| Scotland | 0.013 | -0.100 | ||||
| (0.085) | (0.126) | |||||
| Number of observations | 887 | 887 | 887 | 867 | 867 | 867 |
| NS-SEC Class and Age | Yes | Yes | Yes | Yes | Yes | Yes |
| Demographic controls | No | Yes | Yes | No | Yes | Yes |
| Early life ability | No | No | Yes | No | No | Yes |
Notes and sources: Authors’ calculations using the National Childhood Development Survey and the Birth Cohort Study; Figures shown are the estimated reduction in chances of experiencing downward social mobility for each group relative to the omitted category at age 33 in NCDS and age 34 in BCS. For each dataset, the first column shows the raw differences, the second that after controlling for other demographic characteristics listed in the table and the third after controlling for early life skills and region of origin. Early skills include measures of cognitive abilities (general abilities, maths and reading) and non-cognitive skills (Rutter scores of internalizing and externalizing behaviours) at age 11/10. Conditional estimates are estimated using a Logit model and represent marginal differences estimated at the mean value for all characteristics. *** indicates statistical significance at the 1% level, ** at the 5% level and * at the 10% level.
Table 4.8: Effect of individual characteristics on chances of experiencing downward social mobility for men from intermediate class backgrounds in the NCDS and BCS, before and after controlling for other characteristics and early life skills
| NCDS: raw | NCDS: conditional | NCDS: after skill controls | BCS: raw | BCS: conditional | BCS: after skill controls | |
|---|---|---|---|---|---|---|
| Educational | ||||||
| Less than Level 2 | omitted | omitted | omitted | omitted | omitted | omitted |
| Level 2 (GCSEs) | -0.158*** | -0.160*** | -0.110*** | -0.118*** | -0.111*** | -0.084*** |
| (0.025) | (0.024) | (0.026) | (0.025) | (0.025) | (0.027) | |
| Level 3 (A-level) | -0.335*** | -0.338*** | -0.250*** | -0.214*** | -0.202*** | -0.160*** |
| (0.024) | (0.024) | (0.028) | (0.037) | (0.037) | (0.039) | |
| Level 4 (Degree) | -0.923*** | -0.916*** | -0.751*** | -0.579*** | -0.562*** | -0.510*** |
| (0.175) | (0.173) | (0.167) | (0.128) | (0.125) | (0.122) | |
| Children | ||||||
| No Children | omitted | omitted | omitted | omitted | omitted | omitted |
| 1 | -0.009 | -0.012 | -0.023 | 0.026 | 0.014 | 0.016 |
| (0.035) | (0.032) | (0.032) | (0.032) | (0.030) | (0.030) | |
| 2 | 0.024 | 0.014 | 0.006 | -0.045 | -0.055* | -0.049 |
| (0.029) | (0.027) | (0.026) | (0.035) | (0.032) | (0.032) | |
| 3 | 0.096** | 0.078** | 0.065* | -0.004 | -0.033 | -0.032 |
| (0.041) | (0.038) | (0.038) | (0.066) | (0.062) | (0.061) | |
| 4+ | 0.046 | -0.012 | -0.055 | omitted | omitted | omitted |
| (0.082) | (0.074) | (0.074) | ||||
| Destination region | ||||||
| North West | omitted | omitted | omitted | omitted | omitted | omitted |
| North | 0.004 | 0.031 | 0.216** | 0.089 | 0.092 | 0.144 |
| (0.062) | (0.058) | (0.098) | (0.062) | (0.060) | (0.114) | |
| Yorkshire and Humber | -0.038 | -0.020 | -0.004 | 0.054 | 0.030 | 0.083 |
| (0.054) | (0.050) | (0.082) | (0.050) | (0.047) | (0.152) | |
| Midlands | -0.030 | -0.024 | 0.014 | 0.006 | 0.008 | 0.064 |
| (0.047) | (0.043) | (0.077) | (0.045) | (0.042) | (0.110) | |
| East of England | -0.076 | -0.068 | -0.013 | -0.031 | -0.012 | -0.080 |
| (0.053) | (0.049) | (0.080) | (0.053) | (0.050) | (0.113) | |
| SE and London | -0.063 | -0.038 | 0.012 | -0.081* | -0.051 | -0.107 |
| (0.045) | (0.042) | (0.072) | (0.048) | (0.045) | (0.108) | |
| South West | -0.080 | -0.050 | -0.127 | -0.072 | -0.061 | -0.074 |
| (0.053) | (0.049) | (0.082) | (0.063) | (0.059) | (0.115) | |
| Wales | -0.106 | -0.124** | -0.165 | -0.079 | -0.072 | -0.014 |
| (0.065) | (0.059) | (0.122) | (0.070) | (0.065) | (0.162) | |
| Scotland | -0.031 | 0.002 | -0.048 | -0.077 | -0.023 | -0.085 |
| (0.052) | (0.049) | (0.106) | (0.061) | (0.058) | (0.176) | |
| Early skills | ||||||
| General ability | -0.031 | -0.034 | ||||
| (0.022) | (0.021) | |||||
| Maths | -0.038* | -0.016 | ||||
| (0.022) | (0.022) | |||||
| Reading | -0.036* | -0.030 | ||||
| (0.019) | (0.021) | |||||
| Internalising | -0.003 | 0.014 | ||||
| (0.012) | (0.014) | |||||
| Externalising | 0.017 | -0.016 | ||||
| (0.012) | (0.014) | |||||
| Origin region | ||||||
| North West | omitted | omitted | ||||
| North | -0.226** | -0.073 | ||||
| (0.096) | (0.110) | |||||
| Yorkshire and Humber | -0.032 | -0.069 | ||||
| (0.086) | (0.153) | |||||
| Midlands | -0.048 | -0.082 | ||||
| (0.078) | (0.114) | |||||
| East of England | -0.089 | 0.055 | ||||
| (0.084) | (0.122) | |||||
| SE and London | -0.075 | 0.037 | ||||
| (0.073) | (0.108) | |||||
| South West | 0.088 | -0.012 | ||||
| (0.087) | (0.115) | |||||
| Wales | 0.051 | -0.072 | ||||
| (0.127) | (0.162) | |||||
| Scotland | 0.037 | 0.062 | ||||
| (0.104) | (0.177) | |||||
| Number of observations | 1,408 | 1,408 | 1,408 | 830 | 830 | 830 |
| NS-SEC Class and Age | Yes | Yes | Yes | Yes | Yes | Yes |
| Demographic controls | No | Yes | Yes | No | Yes | Yes |
| Early life ability | No | No | Yes | No | No | Yes |
Notes and sources: Authors’ calculations using the National Childhood Development Survey and the Birth Cohort Study; Figures shown are the estimated reduction in chances of experiencing downward social mobility for each group relative to the omitted category at age 33 in NCDS and age 34 in BCS. For each dataset, the first column shows the raw differences, the second that after controlling for other demographic characteristics listed in the table and the third after controlling for early life skills and region of origin. Early skills include measures of cognitive abilities (general abilities, maths and reading) and non-cognitive skills (Rutter scores of internalizing and externalizing behaviours) at age 11/10. Conditional estimates are estimated using a Logit model and represent marginal differences estimated at the mean value for all characteristics. *** indicates statistical significance at the 1% level, ** at the 5% level and * at the 10% level.
Table 4.9: Effect of individual characteristics on chances of experiencing downward social mobility for women from intermediate class backgrounds in the NCDS and BCS, before and after controlling for other characteristics and early life skills
| NCDS: raw | NCDS: conditional | NCDS: after skill controls | BCS: raw | BCS: conditional | BCS: after skill controls | |
|---|---|---|---|---|---|---|
| Educational | ||||||
| Less than Level 2 | omitted | omitted | omitted | omitted | omitted | omitted |
| Level 2 (GCSEs) | -0.230*** | -0.223*** | -0.162*** | -0.119*** | -0.115*** | -0.088*** |
| (0.025) | (0.024) | (0.027) | (0.029) | (0.029) | (0.030) | |
| Level 3 (A-level) | -0.423*** | -0.400*** | -0.315*** | -0.287*** | -0.270*** | -0.243*** |
| (0.028) | (0.029) | (0.034) | (0.036) | (0.036) | (0.037) | |
| Level 4 (Degree) | -0.704*** | -0.659*** | -0.537*** | -0.480*** | -0.436*** | -0.388*** |
| (0.082) | (0.080) | (0.083) | (0.057) | (0.056) | (0.058) | |
| Children | ||||||
| No Children | omitted | omitted | omitted | omitted | omitted | omitted |
| 1 | 0.149*** | 0.100*** | 0.097*** | 0.106*** | 0.054 | 0.058 |
| (0.039) | (0.037) | (0.036) | (0.039) | (0.037) | (0.036) | |
| 2 | 0.197*** | 0.142*** | 0.140*** | 0.189*** | 0.115*** | 0.113*** |
| (0.033) | (0.031) | (0.031) | (0.035) | (0.033) | (0.033) | |
| 3 | 0.302*** | 0.200*** | 0.195*** | 0.234*** | 0.148*** | 0.154*** |
| (0.041) | (0.039) | (0.039) | (0.048) | (0.046) | (0.046) | |
| 4+ | 0.442*** | 0.340*** | 0.349*** | 0.162 | 0.059 | 0.081 |
| (0.085) | (0.078) | (0.078) | (0.148) | (0.135) | (0.130) | |
| Destination region | ||||||
| North West | omitted | omitted | omitted | omitted | omitted | omitted |
| North | 0.071 | -0.004 | 0.024 | -0.170** | -0.148* | -0.209 |
| (0.064) | (0.058) | (0.094) | (0.086) | (0.077) | (0.128) | |
| Yorkshire and Humber | 0.047 | 0.044 | 0.041 | -0.012 | -0.028 | -0.151 |
| (0.058) | (0.053) | (0.080) | (0.054) | (0.050) | (0.106) | |
| Midlands | 0.111** | 0.112** | 0.044 | -0.047 | -0.070 | -0.199** |
| (0.049) | (0.045) | (0.073) | (0.049) | (0.046) | (0.099) | |
| East of England | -0.002 | 0.009 | -0.059 | -0.024 | -0.047 | -0.254** |
| (0.056) | (0.052) | (0.076) | (0.058) | (0.054) | (0.115) | |
| SE and London | -0.037 | 0.008 | -0.024 | -0.143*** | -0.110** | -0.252** |
| (0.047) | (0.043) | (0.067) | (0.049) | (0.045) | (0.103) | |
| South West | 0.017 | 0.015 | 0.011 | 0.036 | 0.018 | -0.034 |
| (0.055) | (0.050) | (0.078) | (0.055) | (0.051) | (0.119) | |
| Wales | 0.105 | 0.083 | -0.042 | -0.076 | -0.066 | -0.266* |
| (0.065) | (0.058) | (0.109) | (0.070) | (0.065) | (0.147) | |
| Scotland | 0.060 | 0.121** | 0.071 | -0.080 | 0.000 | -0.147 |
| (0.054) | (0.049) | (0.100) | (0.061) | (0.057) | (0.132) | |
| Early skills | ||||||
| General ability | -0.037 | 0.019 | ||||
| (0.023) | (0.025) | |||||
| Maths | -0.044* | -0.063*** | ||||
| (0.023) | (0.025) | |||||
| Reading | 0.001 | -0.030 | ||||
| (0.022) | (0.025) | |||||
| Internalising | -0.011 | 0.003 | ||||
| (0.013) | (0.014) | |||||
| Externalising | 0.017 | -0.021 | ||||
| (0.015) | (0.015) | |||||
| Origin region | ||||||
| North West | omitted | omitted | ||||
| North | -0.037 | 0.067 | ||||
| (0.092) | (0.117) | |||||
| Yorkshire and Humber | -0.020 | 0.141 | ||||
| (0.082) | (0.110) | |||||
| Midlands | 0.070 | 0.135 | ||||
| (0.071) | (0.103) | |||||
| East of England | 0.072 | 0.268** | ||||
| (0.078) | (0.124) | |||||
| SE and London | 0.026 | 0.148 | ||||
| (0.067) | (0.108) | |||||
| South West | -0.029 | 0.037 | ||||
| (0.084) | (0.124) | |||||
| Wales | 0.150 | 0.226 | ||||
| (0.108) | (0.146) | |||||
| Scotland | 0.039 | 0.160 | ||||
| (0.101) | (0.131) | |||||
| Number of observations | 1,452 | 1,452 | 1,452 | 916 | 916 | 916 |
| NS-SEC Class and Age | Yes | Yes | Yes | Yes | Yes | Yes |
| Demographic controls | No | Yes | Yes | No | Yes | Yes |
| Early life ability | No | No | Yes | No | No | Yes |
Notes and sources: Authors’ calculations using the National Childhood Development Survey and the Birth Cohort Study; Figures shown are the estimated reduction in chances of experiencing downward social mobility for each group relative to the omitted category at age 33 in NCDS and age 34 in BCS. For each dataset, the first column shows the raw differences, the second that after controlling for other demographic characteristics listed in the table and the third after controlling for early life skills and region of origin. Early skills include measures of cognitive abilities (general abilities, maths and reading) and non-cognitive skills (Rutter scores of internalizing and externalizing behaviours) at age 11/10. Conditional estimates are estimated using a Logit model and represent marginal differences estimated at the mean value for all characteristics. *** indicates statistical significance at the 1% level, ** at the 5% level and * at the 10% level.
6. Longitudinal analysis
In this section, we extend our analysis to consider whether downward mobility is sustained over time and the impact on individual earnings. To do so, we make use of an additional dataset, Understanding Society. This is a panel of about 40,000 households who have been followed over time, which allows us to track patterns of downward mobility for the same individuals over time and estimate the impact on wages over time.
We start by documenting levels of downward mobility in Understanding Society (US) and how this compares with other datasets we make use of (NCDS, BCS and LFS). We then examine longitudinal patterns in downward mobility using US, before estimating the impact on individual earnings using US and the cohort studies.
6.1 Downward mobility in Understanding Society
To ensure consistency with the age ranges in our other analysis, we focus on individuals aged 30 to 49 who answered Wave 2 of Understanding Society as an individual respondent. We focus on Wave 2 as this was the first wave that also included the remaining sample from the British Household Panel Survey (BHPS) in addition to new Understanding Society entrants. We focus on this age range to ensure individuals have settled into particular occupations after age 30 and ensure comparability with the NCDS (33,42), BCS(34,42) and LFS (30 to 59). We narrow the age range relative to the LFS to ensure that when we look 5 years after Wave 2, individuals are still of working-age.
We define parental occupation on the basis of the highest reported NS-SEC category of their mother or father when the individual was age 14. This is identical to the approach taken in the cohort studies, but differs from the LFS (which relates to the “main earner”). We take this information from a range of sources in US and the BHPS. First, we use the derived cross-wave information as our initial measure. Second, we take the highest recorded mother and father NS- SEC category recorded across any wave of the BHPS for those who participated (most individuals just have one entry for this question, but where there are different values across multiple entries, we take the highest category for each respective parent). If this is missing, we use the highest category recorded across any wave of US.
The overall motivation for this approach is that we want to maximise the number of cases with non-missing data and it is possible to use all available waves as this should data should be constant across waves. Despite this approach, about 10% of individuals age 30 to 49 have missing parental occupation information. This is higher than the 5% of cases in the LFS.
We define own occupation based on current or last reported occupation in US. We only fill in missing information from one previous wave if this is missing. We do not fill in information from future waves as this could represent a genuine change in circumstances. Own occupation is missing for 4% of men and 8% of women.
We then focus our analysis on individuals with non-missing parental and own occupation in order to create a 3x3 transition matrix of parental and own occupation. This is for individuals aged 30 to 49 who answered as a main respondent. We weight the data by the appropriate cross-sectional weight for wave 2. Using the longitudinal weight instead makes little difference to the overall patterns or figures.
Tables 5.1 gives the 3x3 transition matrices for men and women in Understanding Society. The distribution by parental class is slightly different to that implied by the LFS. The share of individuals with a professional background is similar at around 40% across both US and the LFS, but lower than the BCS (at about 45%) However, the share from an intermediate occupation is lower in the LFS (34%) than in US (37% to 39%), with the share from a working class background correspondingly different too.
Table 5.1: Understanding Society 3x3 transition matrix, % of individuals aged 30 to 49
| Men | 1. NSSEC 1 and 2 | 2. NSSEC 3 to 5 | 3. NSSEC 6 and 7 | Total |
|---|---|---|---|---|
| 1. NSSEC 1 and 2 | 24.1 | 11.3 | 5.2 | 40.6 |
| 2. NSSEC 3 to 5 | 15.0 | 14.7 | 9.2 | 38.9 |
| 3. NSSEC 6 and 7 | 6.0 | 7.6 | 6.9 | 20.5 |
| Total | 45.1 | 33.6 | 21.3 | 100 |
| Women | 1. NSSEC 1 and 2 | 2. NSSEC 3 to 5 | 3. NSSEC 6 and 7 | Total |
|---|---|---|---|---|
| 1. NSSEC 1 and 2 | 22.3 | 10.8 | 7.3 | 40.5 |
| 2. NSSEC 3 to 5 | 14.8 | 11.0 | 11.6 | 37.3 |
| 3. NSSEC 6 and 7 | 6.4 | 6.1 | 9.7 | 22.2 |
| Total | 43.5 | 27.9 | 28.6 | 100 |
Notes and sources: Authors’ calculations using men and women aged 30 to 49 in Understanding Society.
Figure 5.1 below give the overall level of downward mobility recorded across all datasets used in the analysis, including the BCS, NCDS, LFS and US. There are slightly different age ranges used in all cases. However, given the relatively flat age profile in downward mobility after age 30, this is unlikely to be a major source of bias.
The level of downward mobility observed in Understanding Society (at Wave 2) is about 30% for women. This is similar to that observed in the BCS (ages 34 and 42) and the NCS (age 42), but below the 35% level observed in the NCDS (age 33) and well above the 23% to 24% level observed in the LFS. This suggests that we should not put too much weight on the lower level of downward mobility in the LFS for women as compared with earlier cohorts. Given that US shows the same picture as the BCS for a similar cohort, the lower level in the LFS could be an artefact of the way questions are asked.
For men, the BCS (ages 34 and 42), NCDS (age 42) and the LFS all suggest a downward mobility rate of about 20% to 22%. It is higher in the NCDS (age 33) and in US (both about 26% to 27%). This makes it even harder to reach judgements on changes over time in downward mobility as now we see US giving a different picture to the BCS, and the LFS showing a similar picture to the BCS.
Figure 5.1 – Levels of downward mobility for men and women by dataset
| Data and age | Percentage experiencing downward mobility: Men | Percentage experiencing downward mobility: Women |
|---|---|---|
| NCDS (age 33) | 27% | 35% |
| NCDS (age 42) | 22% | 29% |
| BCS (age 34) | 21% | 27% |
| BCS (age 42) | 22% | 30% |
| LFS (age 40 to 49) | 20% | 23% |
| LFS (age 30 to 59) | 21% | 24% |
| US (W2) (age 30 to 49) | 26% | 30% |
Notes and sources: Authors’ calculations using the Labour Force Survey, National Childhood Development Survey, Birth Cohort Study and Understanding Society.
6.2 Is downward mobility sustained over time?
Figure 5.2 shows how downward mobility changes over time for the Understanding Society cohort aged 30 to 49 in wave 2. We start by showing the level of downward mobility at wave 2 (around 2011) and at the end show the level of downward mobility at wave 7 (around 2016) for the same cohort of individuals. To be included, individuals must be observable in the data at both waves, hence the slight difference in levels of downward mobility as compared with Figure 5.1.
For both men and women, there is a slight decrease in the proportion observed as downwardly mobile, with a slightly larger fall for men. These changes can be explained by slightly higher levels of bounce back (individuals ceasing to be downwardly mobile) than new downward mobility by wave 7. However, these longitudinal changes are relatively small, with around 6 to 7 percentage points of bounce back and 4 to 6 percentage points of new downward mobility.
Around 20% of men and women are downwardly mobile at both waves 2 and 7, suggesting that around 80% of downward mobility represents permanent downward mobility.
Figure 5.2 – Longitudinal changes in downward mobility between waves 2 and 7 of Understanding Society

Sources and notes: Authors’ calculations using Understanding Society. Individuals must be observable with non-missing occupational data at both waves.
6.3 What are the earnings consequences?
The final stage of the longitudinal analysis is to analyse the earnings consequences of downward mobility. In Tables 5.2 and 5.3 we estimate the difference in wages between individuals across all possible origin-destination combinations through waves 2 to 7 of Understanding Society for men (5.2) and women (5.3). These are all estimated relative to individuals who stayed in the professional occupations and are all estimated conditional on age, educational qualifications, ethnicity, current region and number of children. This matches the main specification used in our earlier analysis.
Amongst men, individuals in working class occupations earn about 40% to 45% less than those who stayed in the professional classes. This is true irrespective of individuals’ origin, such that there is no earnings advantage to coming from a higher occupational class. For those in intermediate class occupations, earnings are also significantly lower, but there is also no difference in earnings by individuals’ origin. They earn similar amounts irrespective of whether they move down, stayed or moved up to intermediate class occupations.
Where there is a difference is for the professional classes. Individuals who moved up to the professional classes earn about 5% to 10% less than those whose parents worked in professional occupations, though there are differences depending on which wave of data we use.
For women, we see a similar pattern, earnings are similar amongst women in intermediate and working-class occupations, irrespective of origin. However, earnings are about 5% to 10% lower amongst women who moved up to professional occupations from intermediate class backgrounds, and 10% to 15% lower if they moved up from working class occupations.
Table 5.4 and 5.5 show the equivalent earnings for the NCDS and BCS, respectively. Here we estimate the difference in wages at age 42 between individuals across all possible origin- destination combinations from childhood to age 33/34, relative to those who stay in professional classes. Here, we start by showing the raw differences, then accounting for our main specification of control variables, and finally we account for early life factors.
Amongst men, there is a very similar pattern in the cohort studies, with individuals who end up in working class occupations earning around 35% less in the NCDS, and about 40% to 45% less in the BCS than those who stayed in the professional classes. This is again true irrespective of individuals’ origin, suggesting that there is no earnings advantage or ‘glass floor’ to coming from a higher occupational class, in terms of earnings outcomes. For those in intermediate class occupations, earnings are also significantly lower than those who stay in professional occupations (27% to 30% NCDS, 27% to 33% BCS), and there is also no difference in earnings by individuals origin for this group. They face a similar penalty, irrespective of whether they experience downward, or downward mobility, or stay in the intermediate class.
In contrast, tor those who enter professional occupations from lower class origins, there is a penalty of 6% to 12% in the NCDS and 12% to 26% in the BCS, highlighting that the ‘class pay gap’ has worsened over time between the 2 birth cohort studies.[footnote 5]
For women, we see a similar pattern, earnings are similar amongst women in intermediate occupations, irrespective of origin (23% to 25% in the NCDS, and 31% to 35% in the BCS). There is a slight suggestion of women from professional backgrounds facing a smaller penalty in working class occupations (30%) than women from working class backgrounds (40%), relative to those who stay in professional occupations in the NCDS. But this difference is minimal in the later BCS cohort (43% to 46%). Interestingly for women, this pattern also broadly holds for women who end up in professional occupations, with those from working and intermediate class backgrounds earning similarly to those from professional backgrounds in the NCDS. In the BCS there is a ‘class pay gap’ penalty to intermediate women moving into professional occupations of around 10%, although there is no observable penalty for women from working class backgrounds.
These findings echo previous work on the class-wage gap (Friedman, Laurison and Macmillan, 2017; Friedman and Laurison, 2019). This uses the LFS to show that individuals from working- class backgrounds who end up in professional occupations earn around 17% less than those from professional backgrounds in raw terms. This reduces by one third to just over 10% once one controls for education and human capital, largely matching our figures in Understanding Society for a similar specification and our figures for men and women in the NCDS. However, our figures for the BCS remain notably higher (12% to 26%). Friedman, Laurison and Macmillan (2017) further show that accounting for industry, specific occupation and work context reduce the class-wage gap to around 7%.
Our contribution here is to show that this class-wage gap in professional occupations can be observed across a range of datasets, though it can vary from around 5% to 15% depending on the precise dataset used. The higher level of the class-wage gap in the BCS suggests it may have risen over time.
Table 5.2: Differences in earnings from class moves for men in Understanding Society
| Wave 2 | Wave 3 | Wave 4 | Wave 5 | Wave 6 | Wave 7 | |
|---|---|---|---|---|---|---|
| Stay: Professional to professional | Omitted | Omitted | Omitted | Omitted | Omitted | Omitted |
| Down: Professional to middle | -0.389*** | -0.252*** | -0.251*** | -0.424*** | -0.308*** | -0.306*** |
| (0.039) | (0.049) | (0.049) | (0.035) | (0.042) | (0.042) | |
| Down: Professional to working | -0.472*** | -0.302*** | -0.297*** | -0.602*** | -0.471*** | -0.464*** |
| (0.038) | (0.053) | (0.053) | (0.030) | (0.040) | (0.041) | |
| Up: Middle to professional | -0.054 | 0.029 | 0.039 | -0.140*** | -0.094** | -0.086* |
| (0.061) | (0.066) | (0.068) | (0.044) | (0.044) | (0.046) | |
| Stay: Middle to middle | -0.417*** | -0.253*** | -0.247*** | -0.467*** | -0.313*** | -0.308*** |
| (0.034) | (0.048) | (0.048) | (0.031) | (0.041) | (0.042) | |
| Down: Middle to Working | -0.569*** | -0.405*** | -0.397*** | -0.624*** | -0.465*** | -0.454*** |
| (0.025) | (0.039) | (0.040) | (0.025) | (0.038) | (0.039) | |
| Up: Working to Professional | -0.003 | 0.085 | 0.100 | -0.070 | 0.010 | 0.014 |
| (0.079) | (0.086) | (0.088) | (0.073) | (0.078) | (0.078) | |
| Up: Working to Middle | -0.402*** | -0.232*** | -0.230*** | -0.532*** | -0.366*** | -0.346*** |
| (0.043) | (0.058) | (0.058) | (0.043) | (0.058) | (0.061) | |
| Stay: Working to Working | -0.565*** | -0.383*** | -0.371*** | -0.595*** | -0.440*** | -0.432*** |
| (0.027) | (0.043) | (0.045) | (0.033) | (0.047) | (0.048) | |
| Number of observations | 2,261 | 2,261 | 2,261 | 1,562 | 1,562 | 1,562 |
| Demographic Controls | Yes | Yes | Yes | Yes | Yes | Yes |
Notes and sources: Authors’ calculations using Understanding Society; Figures shown are the estimated percentage difference in average earnings of those for each group relative to the omitted category at each wave. All estimates are from an OLS regression of log wages on class moves and exponentially transformed to show percentage differences. *** indicates statistical significance at the 1% level, ** at the 5% level and * at the 10% level.
Table 5.3: Differences in earnings from class moves for women in Understanding Society
| Wave 2 | Wave 3 | Wave 4 | Wave 5 | Wave 6 | Wave 7 | |
|---|---|---|---|---|---|---|
| Stay: Professional to professional | Omitted | Omitted | Omitted | Omitted | Omitted | Omitted |
| Down: Professional to middle | -0.445*** | -0.509*** | -0.514*** | -0.486*** | -0.459*** | -0.479*** |
| (0.023) | (0.027) | (0.030) | (0.027) | (0.035) | (0.040) | |
| Down: Professional to working | -0.546*** | -0.559*** | -0.581*** | -0.576*** | -0.533*** | -0.572*** |
| (0.019) | (0.020) | (0.020) | (0.024) | (0.024) | (0.027) | |
| Up: Middle to professional | -0.064** | -0.098*** | -0.101*** | -0.109*** | -0.058 | -0.073* |
| (0.028) | (0.032) | (0.031) | (0.037) | (0.036) | (0.039) | |
| Stay: Middle to middle | -0.475*** | -0.472*** | -0.492*** | -0.492*** | -0.474*** | -0.463*** |
| (0.023) | (0.023) | (0.023) | (0.031) | (0.031) | (0.033) | |
| Down: Middle to Working | -0.587*** | -0.604*** | -0.608*** | -0.604*** | -0.572*** | -0.576*** |
| (0.017) | (0.017) | (0.017) | (0.020) | (0.021) | (0.024) | |
| Up: Working to Professional | -0.129*** | -0.152*** | -0.131*** | -0.098** | -0.031 | -0.116* |
| (0.036) | (0.039) | (0.038) | (0.047) | (0.054) | (0.068) | |
| Up: Working to Middle | -0.435*** | -0.416*** | -0.416*** | -0.459*** | -0.418*** | -0.395*** |
| (0.030) | (0.037) | (0.030) | (0.037) | (0.041) | (0.042) | |
| Stay: Working to Working | -0.582*** | -0.605*** | -0.589*** | -0.590*** | -0.572*** | -0.591*** |
| (0.018) | (0.017) | (0.018) | (0.023) | (0.023) | (0.025) | |
| Number of observations | 5166 | 4506 | 4199 | 3870 | 3377 | 3106 |
| Demographic Controls | Yes | Yes | Yes | Yes | Yes | Yes |
Notes and sources: Authors’ calculations using Understanding Society; Figures shown are the estimated percentage difference in average earnings of those for each group relative to the omitted category at each wave. All estimates are from an OLS regression of log wages on class moves and exponentially transformed to show percentage differences. *** indicates statistical significance at the 1% level, ** at the 5% level and * at the 10% level.
Table 5.4: Differences in earnings from class moves for men in the NCDS and BCS, before and after controlling for other characteristics and early life skills
| NCDS: raw | NCDS: conditional | NCDS: after skill controls | BCS: raw | BCS: conditional | BCS: after skill controls | |
|---|---|---|---|---|---|---|
| Stay: Professional to professional | Omitted | Omitted | Omitted | Omitted | Omitted | Omitted |
| Down: Professional to middle | -0.348*** | -0.276*** | -0.267*** | -0.429*** | -0.322*** | -0.313*** |
| (0.030) | (0.034) | (0.034) | (0.034) | (0.040) | (0.041) | |
| Down: Professional to working | -0.474*** | -0.370*** | -0.355*** | -0.568*** | -0.447*** | -0.438*** |
| (0.032) | (0.039) | (0.041) | (0.037) | (0.046) | (0.048) | |
| Up: Middle to professional | -0.104*** | -0.065* | -0.062 | -0.197*** | -0.126*** | -0.124*** |
| (0.037) | (0.037) | (0.038) | (0.035) | (0.038) | (0.038) | |
| Stay: Middle to middle | -0.369*** | -0.281*** | -0.264*** | -0.430*** | -0.281*** | -0.273*** |
| (0.027) | (0.032) | (0.032) | (0.031) | (0.041) | (0.041) | |
| Down: Middle to Working | -0.492*** | -0.396*** | -0.373*** | -0.565*** | -0.420*** | -0.409*** |
| (0.023) | (0.030) | (0.031) | (0.030) | (0.042) | (0.043) | |
| Up: Working to Professional | -0.190*** | -0.142*** | -0.126*** | -0.361*** | -0.268*** | -0.263*** |
| (0.044) | (0.045) | (0.047) | (0.043) | (0.048) | (0.049) | |
| Up: Working to Middle | -0.414*** | -0.318*** | -0.300*** | -0.488*** | -0.338*** | -0.330*** |
| (0.028) | (0.033) | (0.034) | (0.037) | (0.048) | (0.050) | |
| Stay: Working to Working | -0.491*** | -0.362*** | -0.336*** | -0.574*** | -0.427*** | -0.417*** |
| (0.024) | (0.033) | (0.035) | (0.037) | (0.050) | (0.052) | |
| Number of observations | 2,266 | 2,266 | 2,266 | 1,359 | 1,359 | 1,359 |
| Demographic controls | No | Yes | Yes | No | Yes | Yes |
| Early life ability | No | No | Yes | No | No | Yes |
Notes and sources: Authors’ calculations using the National Childhood Development Survey and the Birth Cohort Study; Figures shown are the estimated percentage difference in average earnings of those for each group relative to the omitted category at age 42 in NCDS and age 42 in BCS. For each dataset, the first column shows the raw differences, the second that after controlling for other demographic characteristics listed in the table and the third after controlling for early life skills and region of origin.
Early skills include measures of cognitive abilities (general abilities, maths and reading) and non-cognitive skills (Rutter scores of internalizing and externalizing behaviours) at age 11/10. All estimates are from an OLS regression of log wages on class moves and exponentially transformed to show percentage differences. *** indicates statistical significance at the 1% level, ** at the 5% level and * at the 10% level.
Table 5.5: Differences in earnings from class moves for women in the NCDS and BCS, before and after controlling for other characteristics and early life skills
| NCDS: raw | NCDS: conditional | NCDS: after skill controls | BCS: raw | BCS: conditional | BCS: after skill controls | |
|---|---|---|---|---|---|---|
| Stay: Professional to professional | Omitted | Omitted | Omitted | Omitted | Omitted | Omitted |
| Down: Professional to middle | -0.389*** | -0.252*** | -0.251*** | -0.424*** | -0.308*** | -0.306*** |
| (0.039) | (0.049) | (0.049) | (0.035) | (0.042) | (0.042) | |
| Down: Professional to working | -0.472*** | -0.302*** | -0.297*** | -0.602*** | -0.471*** | -0.464*** |
| (0.038) | (0.053) | (0.053) | (0.030) | (0.040) | (0.041) | |
| Up: Middle to professional | -0.054 | 0.029 | 0.039 | -0.140*** | -0.094** | -0.086* |
| (0.061) | (0.066) | (0.068) | (0.044) | (0.044) | (0.046) | |
| Stay: Middle to middle | -0.417*** | -0.253*** | -0.247*** | -0.467*** | -0.313*** | -0.308*** |
| (0.034) | (0.048) | (0.048) | (0.031) | (0.041) | (0.042) | |
| Down: Middle to Working | -0.569*** | -0.405*** | -0.397*** | -0.624*** | -0.465*** | -0.454*** |
| (0.025) | (0.039) | (0.040) | (0.025) | (0.038) | (0.039) | |
| Up: Working to Professional | -0.003 | 0.085 | 0.100 | -0.070 | 0.010 | 0.014 |
| (0.079) | (0.086) | (0.088) | (0.073) | (0.078) | (0.078) | |
| Up: Working to Middle | -0.402*** | -0.232*** | -0.230*** | -0.532*** | -0.366*** | -0.346*** |
| (0.043) | (0.058) | (0.058) | (0.043) | (0.058) | (0.061) | |
| Stay: Working to Working | -0.565*** | -0.383*** | -0.371*** | -0.595*** | -0.440*** | -0.432*** |
| (0.027) | (0.043) | (0.045) | (0.033) | (0.047) | (0.048) | |
| Number of observations | 2,261 | 2,261 | 2,261 | 1,562 | 1,562 | 1,562 |
| Demographic controls | No | Yes | Yes | No | Yes | Yes |
| Early life ability | No | No | Yes | No | No | Yes |
Notes and sources: Authors’ calculations using the National Childhood Development Survey and the Birth Cohort Study; Figures shown are the estimated percentage difference in average earnings of those for each group relative to the omitted category at age 42 in NCDS and age 42 in BCS. For each dataset, the first column shows the raw differences, the second that after controlling for other demographic characteristics listed in the table and the third after controlling for early life skills and region of origin. Early skills include measures of cognitive abilities (general abilities, maths and reading) and non- cognitive skills (Rutter scores of internalizing and externalizing behaviours) at age 11/10. All estimates are from an OLS regression of log wages on class moves and exponentially transformed to show percentage differences. *** indicates statistical significance at the 1% level, ** at the 5% level and * at the 10% level.
7. Conclusion
Discussions of social mobility often ignore the fact that relative mobility is a zero sum game – if the goal is for individuals from deprived backgrounds to be able to experience upward mobility, this needs to be accompanied by an equal amount of downward mobility for those from more affluent backgrounds. While recent work has highlighted a growing trend in downward mobility (Bukodi and others, 2015), there has been less detailed analysis into the nature, drivers and consequences of this type of experience. In this report, we combine empirical evidence from 4 large scale national data sources, the Labour Force Survey (LFS), the 2 mature British birth cohort studies, the National Child Development Study (NCDS) and the British Cohort Study (BCS), and the recent UK Household Longitudinal Study, Understanding Society to explore this for the first time.
We show that around a quarter of the adult population experience downward mobility, and that this is slightly more prominent for women than men. There are a number of important drivers of this process. Education plays a key role, with those with degree-level qualifications 50 to 60 percentage points less likely to experience downward mobility than those with lower level or no qualifications. This broadly holds true even after accounting for early measures of cognitive and non-cognitive skills, indicating that it is the qualifications as much as the underlying skills that are driving this. There are some significant differences in the chances of experiencing downward mobility across ethnic groups too, with men and women from Black African, Bangladeshi, and Other Asian backgrounds experiencing higher rates of downward mobility than men and women from white backgrounds. Downward mobility rates are more prominent among women with more children. This effect appears to have declined over time, capturing recent trends in labour market patterns of mothers, but the effects remain substantial demonstrating that women continue to disproportionately carry the ‘parent penalty’.
In terms of the longer term consequences, such moves appear to be a persistent state, with 80% of those who experience downward class moves, remaining downwardly mobile up to 5 years later. But unlike in previous findings of upward mobility there is no associated penalty (or advantage) from moving down from different classes (Friedman and Laurison, 2019). Those who move down to intermediate or working-class occupations have very similar pay to those who started from these positions, regardless of their class origin, indicating no persistent advantage or ‘glass-floor’ effects. In sharp contrast, upwardly mobile men and women from lower occupational classes face a pay penalty, and we show for the first time that this has increased over time for those born in 1970 compared to 1958.
This work suggests a number of key priorities for policymakers and future research. First, any attempts to change social mobility patterns must recognise the central role currently played by formal educational qualifications. Higher education qualifications are associated with significantly reduced chances of downward mobility, even after controlling for class origins, ethnicity and other aspects of family background. Second, it is not clear why certain ethnic minority groups experience higher levels of downward mobility, even after accounting for their educational backgrounds. Understanding why this is the case is important to ensure equality of opportunity by ethnicity. Third, the existence of a wage penalty for individuals moving upwards is already known to exist. While separate to downward mobility, further research is clearly needed to understand this in more detail.
8. References
Blanden, J. Goodman, A. Gregg, P. and Machin, S. (2004) ‘Changes in intergenerational mobility in Britain’, in (M. Corak, ed.), Generational Income Mobility in North America and Europe, 122–46, Cambridge: Cambridge University Press.
Blanden, J., Gregg, P. and Macmillan, L. (2013) “Intergenerational Persistence in Income and Social Class: The Impact of Within-Group Inequality” Journal of the Royal Statistical Society: Volume A Vol. 176(2) pp. 541-563.
Blanden, J., Gregg, P. and Macmillan, L. (2007) “Accounting for intergenerational Income Persistence: Non-cognitive Skills, Ability and Education” The Economic Journal Vol. 117 (519) pp. C43-C60
Blanden, J., Machin, S and Rahman, S. (2019) “Falling absolute mobility”, mimeo
Bukodi, E., Goldthorpe, J. H., Waller., L and Kuha, J. (2015) ‘The mobility problem in Britain: new findings from the analysis of birth cohort data’ The British Journal of Sociology Vol 66(1)., pp.93-116
Bukodi, E., and Goldthorpe, J. H. (2019) Social Mobility and Education in Britain: Research, Politics and Policy, Cambridge, Cambridge University Press.
Bukodi, E., Paskov, M., and Nolan, B. (2017) ‘Intergenerational Class Mobility in Europe: A New Account and an Old Story’ INET Oxford Working Paper no. 2017-03.
Breen, R. (2004) Social Mobility in Europe Oxford: Oxford University Press
Breen, R., Mood, C., and Jonsson, J. (2016) ‘How Much Scope for a Mobility Paradox? The Relationship between Social and Income Mobility in Sweden’ Sociological Science http://dx.doi.org/10.15195/v3.a3
Chowdry, H.; Crawford, C.; Dearden, L.; Goodman, A. and Vignoles, A. 2013. Widening participation in higher education: analysis using linked administrative data. Journal of the Royal Statistical Society Series A, Vol. 176, pp. 431-457.
Corak, M. (2013) ‘Income equality, equality of opportunity, and intergenerational mobility.’
Journal of Economic Perspectives, Vol. 27(3), pp. 79 – 102.
Corak, M., Lindquist, M., and Mazumder, B. (2014) ‘A comparison of upward and downward intergenerational mobility in Canada, Sweden and the United States’ Labour Economics Vol. 30, pp. 185-200
Crawford, C., Gregg, P., Macmillan, L., Vignoles, A., and Wyness, G. (2016) “Higher Education, Career Opportunities and Intergenerational Inequality” Oxford Review of Economic Policy Vol. 32 (4), pp. 553-575 doi: 10.1093/oxrep/grw030
Cribb, J., Disney, R. and Sibieta, L. (2014), “The public sector workforce: past, present and future,” IFS Briefing Note 145, (https://www.ifs.org.uk/publications/7113).
Erikson R. and Goldthorpe, J. (1992) The Constant Flux. A study of class mobility in industrial societies Oxford: Clarendon Press.
Erikson R. and Goldthorpe, J. (2010) ‘Has social mobility in Britain decreased? Reconciling divergent findings on income and class mobility’ British Journal of Sociology, Vol. 61, pp. 211- 230.
Friedman, S. and Macmillan, L. (2017) “Is London Really the Engine-Room? Migration, Opportunity Hoarding and Regional Social Mobility in the UK” National Institute Economic Review Vol. 240, pp R58-R72
Friedman, S., and Laurison, D. (2019) The Class Ceiling: Why it Pays to be Privileged Bristol: Policy Press.
Friedman, S., Laurison, D. and Macmillan, L. (2017) “Social Mobility, the Class Pay Gap and Intergenerational Worklessness: New Insights from the UK Labour Force Survey” Social Mobility Commission
Goldthorpe, J. H. (2013) Understanding – and Misunderstanding – Social Mobility in Britain: The Entry of Economists, the Confusion of Politicians and the Limits of Educational Policy. Journal of Social Policy, 42 (3), 431-450.
Goldthorpe, J. H. and M. Jackson (2007) ‘Intergenerational Class Mobility in Contemporary Britain: Political Concerns and Empirical Findings’ British Journal of Sociology, 58, pp. 525-546.
Goldthorpe, J. H. and Mills, C. (2008), ‘Trends in intergenerational class mobility in modern Britain: evidence from national surveys, 1972–2005’, National Institute Economic Review, Vol. 205, pp. 83–100.
Gregg, P., Macmillan, L. and Vittori, C. (2018) “Intergenerational income mobility: Access to top jobs, the low-pay no-pay cycle, and the role of education in a common framework” Journal of Population Economics, 32, pp. 501-528.
Gregg, P., Macmillan, L. and Vittori, C. (2017) “Moving Towards Estimating Lifetime Intergenerational Economic Mobility” Oxford Bulletin of Economics and Statistics, Vol. 79 (1),
pp. 79-100, DOI: 10.1111/obes.12146
Hertel, F., and Groh-Samberg, O. (2019) ‘The Relation between Inequality and Intergenerational Class Mobility’ in 39 Countries’ American Sociological Review, https://doi.org/10.1177/0003122419885094
Jerrim, J and Macmillan, L. (2015) “Income Inequality, Intergenerational Mobility and the Great Gatsby Curve: Is Education the Key?” Social Forces Vol. 94 (2). pp. 505-533
Laurison, D and Friedman, S (2016) ‘The Class Pay Gap in Higher Professional and Managerial Occupations’ American Sociological Review, Vol. 84 (4), pp. 668-695.
McKnight, A. (2015) ‘Downward mobility, opportunity hoarding and the ‘glass floor’’ Social Mobility Commission report
Macmillan, L., Tyler, C. and Vignoles, A. (2015) “Who gets the top jobs? The role of family background and networks in recent graduates’ access to high status professions” Journal of Social Policy Vol. 44(3) pp.487-515
OECD (2018) ‘A Broken Social Elevator? How to Promote Social Mobility’ OECD report
Reeves, R., and Howard, K. (2013) ‘The Glass Floor: Education, Downward Mobility, and Opportunity Hoarding’ Brookings paper
Winsor, T (2011), “Independent Review of Police Officer and Staff Remuneration and Conditions,” (https://assets.publishing.service.gov.uk/government/uploads/system/uploads/attachment_data/ file/229006/8024.pdf).
9. About the Commission
The Social Mobility Commission is an independent advisory non-departmental public body established under the Life Chances Act 2010 as modified by the Welfare Reform and Work Act 2016. It has a duty to assess progress in improving social mobility in the UK and to promote social mobility in England.
The Commission board comprises:
- Sandra Wallace, Joint Managing Director Europe at DLA Piper (interim Co-Chair)
- Steven Cooper, Chief Executive Officer C. Hoare and Co (interim Co-Chair)
- Alastair da Costa, Chair of Capital City College Group
- Farrah Storr, Editor-in-chief, Elle
- Harvey Matthewson, Aviation Activity Officer at Aerobility
- Jessica Oghenegweke, Presenter, BBC Earth Kids
- Jody Walker, Senior Vice President at TJX Europe (TK Maxx and Home Sense in the UK)
- Liz Williams, Chief Executive Officer of Futuredotnow
- Pippa Dunn, Founder of Broody, helping entrepreneurs and start-ups
- Saeed Atcha, Chief Executive Officer of Youth Leads UK
- Sam Friedman, Associate Professor in Sociology at London School of Economics
- Sammy Wright, Vice Principal of Southmoor Academy, Sunderland
Professor. Lindsey Macmillan (CEPEO, UCL Institute of Education and Institute for Fiscal Studies)
Luke Sibieta (Sibieta Economics of Education, Institute for Fiscal Studies and Education Policy Institute)
-
The National Statistics Socio-economic classification (NS-SEC rebased on SOC2010) ↩
-
Note that this approach gives different patterns of origin class distributions (and of downward mobility) to that of previous analysis, such as Bukodi and others (2015) who measure origin class based on father’s occupations at age 10 (and 16 where missing) for comparability across their data sources. Using this alternative definition, we find very similar patterns of downward mobility to those reported in their paper – results available from the authors on request. ↩
-
Their finding of increasing downward mobility was for a cohort born later, in the early 1980s. ↩
-
For example, Cribb and others (2014) show that the share of nurses with higher education qualifications rose from 10% in 1997 to about 40% by 2010 and Winsor (2011) shows that the share of police officers with higher education qualifications rose from close to zero in 1979 to about 27% by 2010. ↩
-
Note this is consistent with the literature on intergenerational income mobility worsening over time for these cohorts, even when using social class as the origin measure. This supports the notion that broad measures of class mobility are not capturing changes in income inequality within class groupings across cohorts (see Blanden, Gregg and Macmillan, 2013). ↩