Benefits of Rural Mobile Coverage
Published 17 October 2022

© Crown copyright 2022
This publication is licensed under the terms of the Open Government Licence v3.0 except where otherwise stated. To view this licence, visit nationalarchives.gov.uk/doc/open-government-licence/version/3 or write to the Information Policy Team, The National Archives, Kew, London TW9 4DU, or email: psi@nationalarchives.gov.uk.
Where we have identified any third party copyright information you will need to obtain permission from the copyright holders concerned.
This publication is available at https://www.gov.uk/government/publications/benefits-of-rural-mobile-coverage/benefits-of-rural-mobile-coverage
Executive Summary
Objectives and approach
Mobile coverage is an important part of people’s daily lives. Although many parts of the UK are well served, a considerable percentage of total not-spots (areas with no mobile coverage) and partial not-spots (areas covered by some but not all four mobile network operators) remain. In particular rural areas are often under-served.
Building Digital UK (BDUK), a part of the Department for Digital, Culture, Media and Sport (DCMS), and the four mobile network operators aim to reduce this gap through the Shared Rural Network (SRN) programme. The SRN will deliver 4G mobile coverage to 95% of the UK.
It is clear that improved mobile coverage can have positive impacts on businesses and people’s lives. This survey and research therefore is intended to explore rural residents’ experiences with mobile coverage to gain a better understanding of where and how potential benefits will be realised. As the SRN programme is still in its infancy, the survey results demonstrate the benefits of improved mobile connectivity in rural areas more generally, not necessarily the benefits that will come directly from the SRN programme. However, we can draw useful conclusions from the survey results about the future benefits that may be realised as a direct result of the SRN programme. Future studies planned within BDUK will further investigate the benefits and any potential disbenefits that accrue from improved connectivity within SRN areas in particular.
The research study used a mixed-methods approach, combining quantitative survey responses about people’s usage of mobile coverage with qualitative free response questions and semi-structured interviews. The main objective of this research was to identify broader areas where mobile coverage can have a positive impact on people’s lives and work, and cement these with people’s lived experiences. In particular, we hoped to create a dataset on which BDUK can draw upon in the future to identify areas of interest for the SRN evaluation and any related mobile connectivity programmes.
Overview of key findings
We identified several broad areas that benefit from improved mobile coverage and collected a host of examples within each. The first broad theme related to increased productivity, where respondents cited increased mobile coverage as beneficial for being able to work whilst on the move, as well as using new technologies in certain sectors, such as precision agriculture. A further important theme was around safety concerns. Examples from survey respondents included lone workers in agricultural and forestry sectors, and people out on lone leisure activities, relying on mobile coverage during emergencies. The final broad theme related to a reduction in the digital divide and an improvement of people’s quality of life. Within this report we have included a number of examples for each theme, supported by quotes, which clearly illustrate the issues around mobile connectivity.
1. Background
Mobile connectivity has become an integral part of society with extensive economic and social benefits.[footnote 1] The advantages of mobile coverage have recently come to the forefront as a result of the Covid-19 pandemic highlighting our reliance and need for digital connectivity. However a lack of mobile coverage, particularly in rural areas, has long been known to increase the digital divide and hinder rural development.[footnote 2]
In March 2020, the UK Government announced it had agreed a £1 billion deal with EE, O2, Three and Vodafone, the four Mobile Network Operators (MNOs), to deliver the SRN programme.[footnote 3] The programme aims to increase mobile coverage to 95% of the UK. The programme will be delivered in two phases. The first phase will see the four network operators collectively invest over £530 million in a shared network of new and existing phone masts. This will help tackle partial not spots (PNS) - areas where there is currently coverage from at least one, but not all operators. The second phase involves £500 million of investment by the UK Government to go even further to significantly reduce total not-spots (TNS) - those hard-to-reach areas where there is currently no coverage from any operator. This second phase also includes direct funding from DCMS to the Home Office and to mobile network operators to upgrade Extended Area Service (EAS) masts being built as part of the Emergency Services Network (ESN), to make them usable by the four mobile network operators to further help eliminate total not-spots.
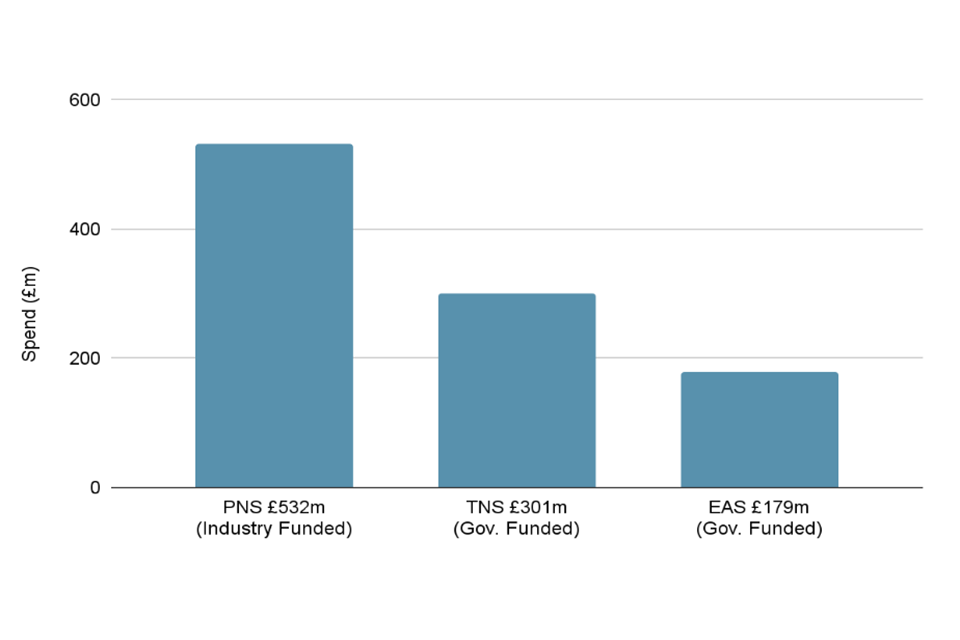
Shared Rural Network Total Programme Spend
Due to the importance of mobile connectivity and the SRN programme, this research carried out by DCMS aims to increase the evidence base and awareness of the benefits of rural mobile coverage. Specifically this report aims to build a more detailed understanding of the benefits of mobile coverage to individuals across these rural areas in both a work and home context. To achieve this, results are based on data from 981 survey responses and five individual interviews.
2. Research Objectives
The primary research objectives included:
- Gain an understanding of the anticipated benefits, in particular social benefits, that individuals can obtain from improved mobile coverage.
- Identify which specific uses of mobile devices are hindered by poor mobile coverage in rural areas.
- Identify the overall views of people living in rural areas with regards to mobile coverage.
In addition, the survey collected participants’ demographic information and queried their use of mobile coverage during Covid-19. With this data we aimed to get a more granular understanding of how mobile coverage affects individuals and whether this differs across demographics.
3. Methods
The project included two phases. The first phase consisted of a 10-minute survey hosted on an online survey tool, Qualtrics. The survey focused on participants’ usage of mobile coverage and how it is affected by lack of coverage. In the second phase, a small subset of participants from phase one met the lead interviewer for individual interviews. The aim of these interviews was to gain a deeper understanding of the issues identified in the survey phase (phase 1) of the project. Outlined below are the specific research methods used in each phase.
Phase 1 - Survey
Approach
The survey was based on a mixed method approach, incorporating both quantitative
as well as open-response, qualitative questions see Appendix A. The combination allowed for a measure of objectivity in evaluating the impact of mobile coverage while also giving valuable insight into the broad range of benefits that can arise from improved mobile coverage. The research was inherently cross-sectional, giving a snapshot of people’s relationship with mobile connectivity. However, the open response questions allowed participants to comment on the perceived long-term impact of poor mobile coverage.
We analysed the answers to open-response questions thematically using the method as described by Braun and Clarke,[footnote 4] and Kiger and Varpio.[footnote 5] This approach consists of six analysis steps and is, notably, recursive such that the researcher may move back and forth between steps in light of newly emerging themes or insights. Specifically, we placed the analysis within the BDUK benefits framework.
Recruitment
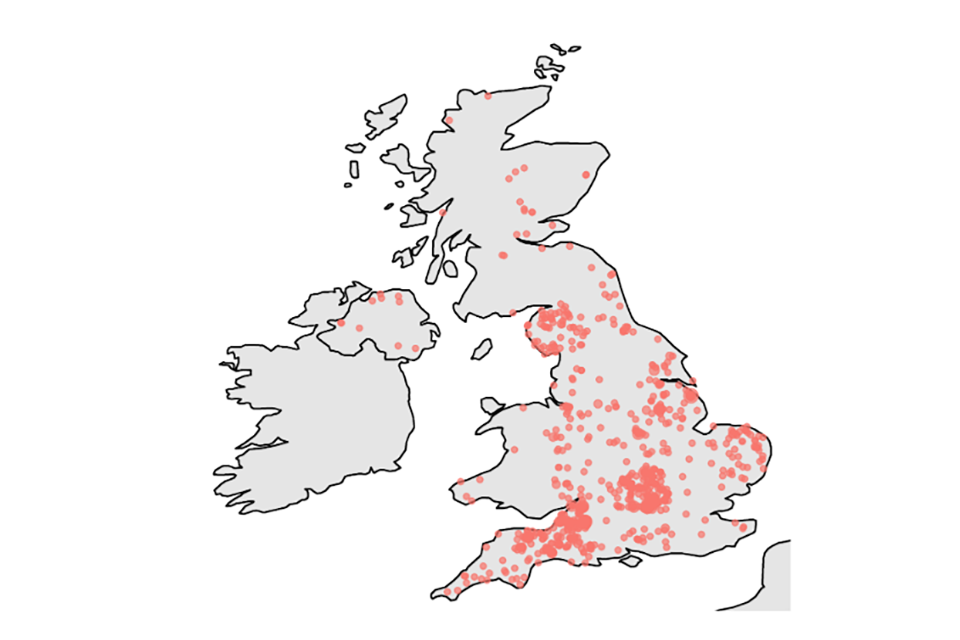
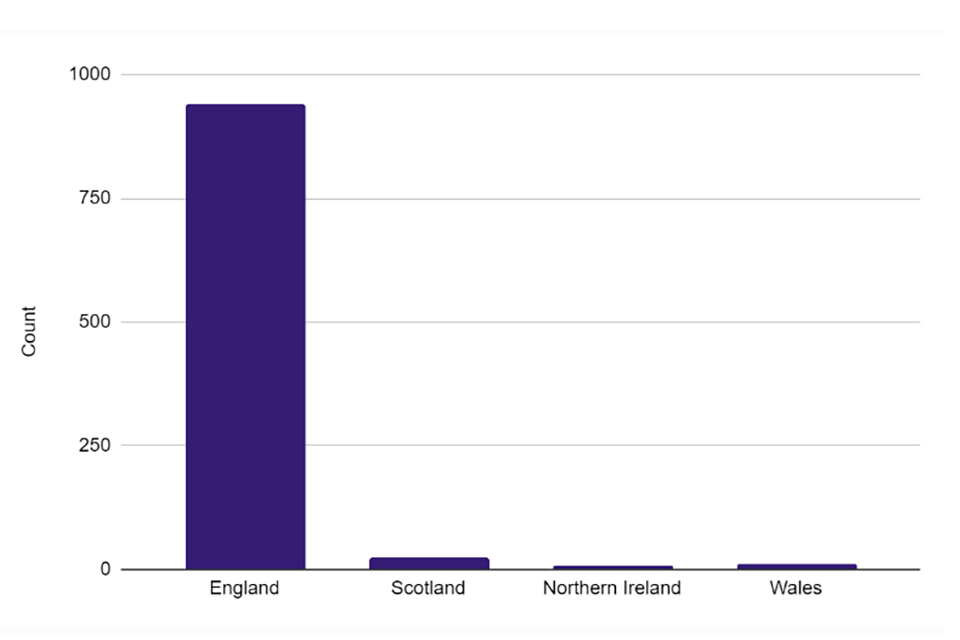
To recruit a wide range of participants, we relied on snowball sampling. We distributed the participant invitation email see Appendix B, the study poster advert see Appendix C which included a QR code, and the study participation link on its own through the following channels: First, Building Digital UK (BDUK) employees forwarded the invitation email widely to friends and family and volunteered to put up posters in villages and towns across the UK. This generated a large number of responses with larger clusters in specific geographical regions of England (e.g., Oxfordshire) as shown in Figure 1. To further boost responses in regions with smaller response numbers, in particular the devolved nations, we also posted the study invitation on social media portals including Facebook, Twitter, LinkedIn, and Shetlink - a classifieds site for the Shetland Islands. Finally, we reached out specifically to individuals in areas with low response rates including Scotland, Wales, Northern Ireland, and Yorkshire. This recruitment campaign resulted in a limited increase in the number of respondents from these areas but, as Figure 2 illustrates, the vast majority of respondents came from South England.
Fig. 1. Map of survey response locations
Map of survey response locations
Fig. 2. Response count per nation
Response count per nation
Participants
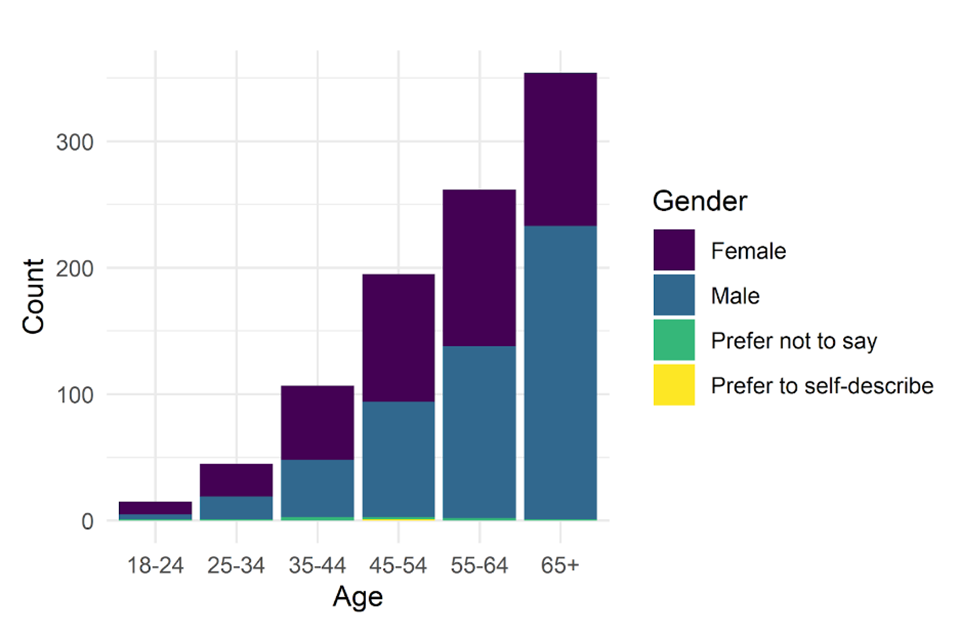
A total of 1,314 people living and/or working in rural areas across the UK responded to the survey. Of these responses, 333 had to be excluded for a number of reasons including failing the test question, unfinished responses, spam answers, and clicking ‘I do not consent’. The final set of participants included 981 male and female respondents aged 18-65+ with a majority of older participants (see Figure 3). Such an age pattern is not unexpected as rural areas tend to have older populations compared to urban areas.[footnote 6] When accounting for the exclusion of 0-18 year olds (i.e., respondents had to be 18 to participate), the age distribution of respondents therefore mirrors that of rural UK generally.
Fig. 3. Distribution of respondents’ age and gender
Distribution of respondents’ age and gender
Participants came from a broad employment background, including a number who were self-employed (see Figure 4). However, only a small number of respondents indicated that they did not work. Respondents who indicated that they worked - either as paid employees or self-employed - reported a wide range of professions, including in the service sector, construction, agriculture, healthcare, and education.
Fig. 4. Participants’ employment - general
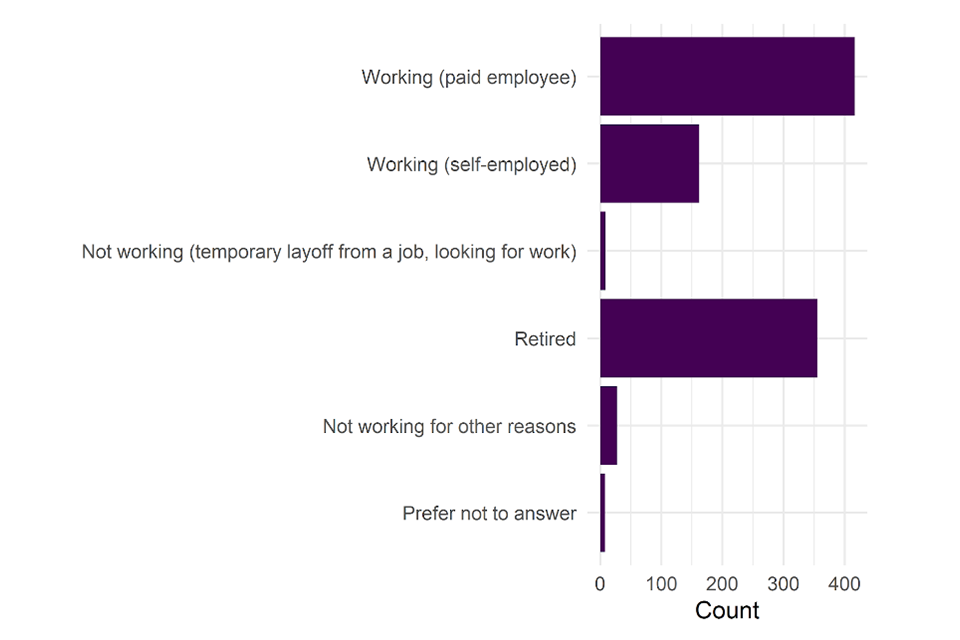
Participants’ employment - general
Phase 2 - Interviews
Approach
In the interview-phase, we focused on a small subset of participants to form a clearer, more in-depth understanding of the importance of rural mobile coverage. Specifically, we used semi-structured interviews to probe participants further on responses given during the survey. All interviews were conducted remotely via video conferencing and typically lasted 15-45 minutes. As video conferencing created some distance between the participants and the interviewer, we encouraged participants to take and share photos of situations in which they felt the impact of mobile coverage in the week prior to the interview.
Recruitment
The participant pool consisted of survey respondents who had indicated that they would be open to further contributing to the research. From these respondents, we chose a subset designed to give a broad overview of experiences. Thus, we ensured that this subset varied in age, job, and nation.
Participants
The final set of interviewees consisted of five participants of which two identified as female and three as male. Of these participants, three lived and worked in England, one in Scotland, and one in Wales. No participants from Northern Ireland responded to the request for an interview. The respondents’ ages ranged from 45-65+ and included one retiree, a photographer, farm owner, manager, and a Scottish Future Trust (i.e., a government agency) employee.
4. Findings
Below are the findings of both the survey and the interviews combined. No major new themes emerged in the interviews but rather they cemented themes that derived in the survey thematic analyses and thus they are discussed jointly here.
1. Driving growth in the economy
Productivity growth
One major theme that emerged was the potential for productivity growth in rural areas. A large number of respondents noted an impact of poor mobile connectivity on their work. Notably, this did affect people in their homes, where we know the SRN programme may not have a large impact, but it also had a wider impact on professions that involve travelling and working outdoors. In both cases, participants reported having lost out on work due to poor mobile connectivity leading to disrupted phone calls, missed messages, and miscommunications. Many participants working from home reported relying on mobile coverage when broadband failed or vice versa, indicating a general need for internet coverage. Yet, when several people worked from home, such arrangements often became unworkable meaning that work progressed at slower speeds. In contrast, certain professions in the service, healthcare, and entertainment industry (e.g., domiciliary care, photography, delivery drivers) and particularly in the forestry and agriculture sectors rely heavily on mobile coverage throughout several aspects of their work. Improvements that these professions could derive from improved mobile coverage include:
Reduced time loss
Improved mobile coverage along train routes and roads will not only enable workers to stay productive on trains (e.g., during commutes) and while driving (hands free phone calls) but can also improve services which rely on, for example, mobile navigation. For instance, a number of respondents noted delivery drivers getting lost and being unable to find their address due to poor mobile signals or being unable to contact customers of delayed arrivals. Similarly, domiciliary care workers may miss important calls for assistance through poor mobile connectivity. Here, improved mobile coverage can have a positive knock-on effect whereby service workers, such as delivery drivers, can provide their services more reliably, increasing productivity. In turn, this improves the quality of life for rural residents who rely on such services, in particular the elderly.
New technologies
Many new technologies, in particular in the agricultural sector, rely on mobile connectivity. Examples range from remote-controlled greenhouse windows to Precision Agriculture technologies. Precision Agriculture, also known as site specific crop management, maximises yields by precisely adjusting all aspects of crop production based on measuring variability of crops between fields. Such technologies have economic impacts, decreasing farmers’ usage of water, fertiliser, and pesticides which subsequently lead to positive environmental outcomes.[footnote 7] Precision Agriculture is therefore an important part of sustainable agriculture but through its frequent reliance on mobile signals, may not be accessible to the entire sector.
Increased competitiveness
In turn, mobile coverage, which can enable developments such as Precision Agriculture, can give businesses a competitive advantage. Other examples raised by respondents included being able to close competitive contracts and keeping in touch with clients.
Many of these themes are encompassed by this statement one respondent gave:
As the manager of a rural estate I am frequently unable to make or receive calls from employees or contractors who require my input or advice on a given matter.
2. Work safety and satisfaction
A second major theme within the survey emerged around work safety and satisfaction. The primary sectors to benefit from improved mobile coverage with regards to work safety are the agricultural and forestry sectors. The fatal injury rate in agriculture is 20 times higher than in all industries[footnote 8] and survey respondents cited a frequent lack of mobile coverage as a major factor exacerbating poor outcomes from agricultural injuries. One interviewee noted that farming is moving towards an industry of ‘lone workers’, i.e. workers operating heavy machinery without colleagues nearby. This can result in serious incidents which are then not immediately noticed by other workers while leaving the injured party potentially unable to call for help if they are in a not-spot. One respondent recalled:
[…] an explosion followed by a serious fire threatened to spread from a farm field to ignite the moorland surrounding the village […]. An injured farm worker had to struggle into the village [….] to call the emergency services. The injured man could not use a mobile phone as there is no signal.
Indeed, a survey by the National Farmers Union revealed that 93% of farmers who reported having a mobile phone, indicated that reliable mobile signal is important for their business.[footnote 9] In contrast, only 15% reported having reliable signal on outdoor farmland. In addition to the safety of farmworkers, such lack of mobile signal can also pose risks to livestock. For example, respondents recounted incidents of having to leave wounded animals in order to find a reliable signal for calling a vet.
While the greatest safety impact of mobile coverage may be within agriculture, other job sectors can also markedly benefit. In particular professions with an outdoor or travel element can see increased safety and job satisfaction. Safety here can be safety for oneself (e.g., lone workers), others (e.g., duty of care), and animals (e.g., veterinarians). The diversity of positive safety and satisfaction outcomes is illustrated by the following two quotes:
Mobile coverage was frequently a problem when I was supervising DofE [Duke of Edinburgh] expeditions as we were frequently unable to contact students […]
I’m a professional dog walker & send sms or whatsapp messages to let all my customers know all ok or not.
Improved outdoor mobile coverage can also enable workers to spend more time outdoors, consequently improving flexibility, work and life satisfaction, and potentially even mental and physical health through spending time outdoors and away from screens. For example, one respondent noted that having to be reachable during international office hours for work:
Means I have to stay home during international working hours to make sure good service for important calls.
Participants frequently described such limits to their freedom to move around as highly frustrating. Unsurprisingly then, being able to take work calls while on the move was a common use of mobile signal participants wished to be possible.
General benefits
Generally, it is clear that some professions will benefit more than others. Yet, even in professions where mobile connectivity is non-essential, loss of connectivity can have social implications with participants noting that they seemed ‘unprofessional’ when missing calls or being cut-off.
As a veterinary surgeon I couldn’t meet people and couldn’t find the location of my home visits.
Visiting a nearby farm and couldn’t send a message to colleagues to say I would be late for a meeting.
3. Reducing the digital divide & providing public value
Perhaps the largest number of comments from both the survey and the interviews pertained to general quality of life and frustration at being less able than ones’ urban counterparts to use digital services.
a. Reducing digital divide
Respondents frequently expressed frustration and anger at feeling ‘left behind’ and excluded from activities and services that are commonplace for urban residents. Examples included looking up public transport times, booking and travelling on public transport and using maps for navigation. However, many respondents also voiced a general frustration at the lack of services:
I would like to be able to have the same services that people who live in more urban areas take for granted.
There are so many benefits offered by my mobile provider and I cannot take advantage of them.
Modern life is passing us by.
Beyond the feeling of frustration, reduced access to mobile connectivity can also have more serious consequences. For example, one respondent reported not having a smartphone due to lack of coverage and in turn not having the Covid-19 NHS track and trace app. Lack of mobile coverage appears to be a general risk to personal safety as several respondents cited examples of not receiving important calls or texts from their GP or hospital:
The GP recently tried to call when my child was unwell but was unable to get through.
Equally, respondents noted feeling unsafe when moving around outside as they cannot call for help in an emergency. Women in particular frequently reported feelings of unease at being unable to contact their partner or emergency services, indicating a potential gender difference in the types of consequences felt. However, male participants also frequently cited fears of emergencies as reasons for worrying about poor mobile signal. There were a wide number of examples where such fears had become reality. For example, several respondents reported horse riding accidents during which they could not call for help due to lack of signal:
I have fallen off my horse and had my phone, but due to poor coverage haven’t been able to alert anybody.
Such accidents can be particularly severe, rendering the ability to call for help crucial. However, there are also many less severe examples of rural residents being unable to rely on services such as the breakdown of cars or bicycles in areas without coverage. Not only do these events lead to stress and frustration for the people involved but they frequently also result in loss of time (e.g., having to walk several miles to find help). Reducing the digital divide through increased mobile coverage can therefore have a wide range of benefits, including, but not limited to, improved personal safety and a reduction in resources spent during emergencies.
b. Improved quality of life
Many of the examples and benefits listed above will have a positive impact on rural residents’ quality of life. Additionally, many respondents noted that improved mobile coverage can be important for social interactions and connectedness. Social connectedness, in turn, positively contributes to people’s mental health[footnote 10] and[footnote 11] is therefore far from an unimportant advantage of improved mobile coverage. Such beneficial social interactions include keeping in touch with family and friends, which mobile coverage can make possible through a variety of ways. The most obvious examples include texting and phone calls. However, participants also reported the importance of sharing media, arranging meetings, and the potential for increased freedom of movement. For example, several parents, such as the one quoted below, reported being unwilling to allow their children to meet others and play outside out of fear of being unable to contact them:
I’ll be reluctant to allow my children out to play with friends as there is no way to contact them.
These benefits were neatly summed up by one respondent who simply stated:
Every aspect of my life would be easier.
c. Consumer savings
Increased mobile coverage holds the potential for consumer savings in a variety of ways. The primary example is rural residents paying for services that they cannot use due to lack of coverage:
We want a reliable service that covers rural areas, as we pay the same as customers in other areas.
In a home setting, many respondents also reported owning and paying for a landline for the sole reason that they do not receive reliable mobile signal in and around their home.
Similarly, some participants reported feeling that a lack of mobile signal had negatively affected house prices upon sale. Some respondents also recounted having to drive several miles to reach an area with reliable signal to carry out important tasks. This results in increased cost in terms of petrol consumed and wear and tear.
Beyond consumer savings, there is also a risk of increased public spending as a result of poor mobile coverage. For example, in some areas defibrillators had to be placed in open cases, risking theft and vandalism, as reaching 999 in a case of emergency could not be ensured:
[…] placed public access defibrillators […] and they all have to be in unlocked cases (making them vulnerable to theft or vandalism) because we cannot guarantee that callers would be able to get a signal to get the key code from a 999 operator.
5. Conclusions
In this primarily qualitative pilot work, we surveyed over 1,000 rural residents and conducted in-depth interviews with five respondents to derive a holistic picture of the types of benefits mobile coverage can bring in rural areas. This resulted in a rich and varied dataset which can support and guide the planning of any future, more comprehensive evaluations of the SRN programme. The work also demonstrated that increased mobile coverage in rural areas can have a myriad of benefits. When considering such benefits it is particularly important to pay attention to the social benefits as these are varied and often come with positive knock-on effects.
6. Caveats
The main objective of the study is to develop an understanding of the benefits of improved mobile connectivity in rural areas more generally. Although we can draw inferences about the benefits of the SRN programme, there are a number of limitations to the conclusions we can draw about the direct benefits of the programme, including:
Timing
The main limitation is the fact that the Shared Rural Network programme was in its infancy at the time of data collection. The Government (DCMS) funded element of the SRN continues to progress through procurement and although the operators had begun the industry-led aspect of the SRN programme, we probably wouldn’t be able to see any real improvements in 4G coverage until many of the upgrades had been completed and when new masts would start to be built. As a result, the research focused on respondents in rural UK areas in general rather than specifically on areas with newly improved coverage. Consequently, the current data cannot give reliable evidence for the actual impact of improved mobile coverage specifically as a result of the SRN programme. Instead, we can only evidence which problems may potentially be alleviated through the SRN programme, depending upon location. Additionally, this also led to a strong focus on the negative sides of mobile coverage. For example, there may be unforeseen advantages to improved mobile coverage which people affected cannot assess until they actually experience them. The current research has no way of accessing such information.
Survey responses
The majority of the responses to the survey were from areas in England where Government spend will be limited to EAS and the majority of coverage improvements will come from the industry as most of the country already has some 4G coverage. The SRN programme delivers substantial UK-wide benefits, especially in Scotland and Wales, largely through substantial Government funding. Future studies will look to establish the direct benefits that come from improved mobile connectivity in these Government-funded areas. There are several other areas which we will look to improve, in order to allow a deeper understanding of the benefits that improved mobile connectivity can bring, to those who have benefitted from the SRN programme.
Sampling
The cross-sectional nature of the current research inherently means that we cannot assess what specific changes, i.e., from good to bad or vice versa, improved mobile coverage brings. Further, while the final set of respondents was relatively large, it lacked diversity in terms of ethnicity, and socioeconomic status. We also cannot comment on the impact of mobile coverage on respondents from lower socioeconomic and minority backgrounds. This may be a particular issue as both of these groups tend to rely more heavily on smartphones than computers.[footnote 12]
Time-constraints
The research was conducted under strict time constraints with three important consequences:
Firstly, to ensure survey completion and data that could be interpreted within the given time-frame, the survey consisted of a limited number of questions. Not only did this lead to a lack of data about, e.g., ethnicity, but it also left little room to explore the impact of mobile data more fully in terms of the factors that lead to people being impacted.
Secondly, the survey was only live for a short period of time - approximately five weeks. This did not allow for extensive targeting of demographics which were underrepresented in the data. These groups may be harder to reach, requiring more time and effort to recruit.
Lastly, the interviews were conducted after survey completion. This left little time for the interviewees and interviewers to become acquainted. This can be problematic as interviews rely on openness and honesty. With such short periods to get acquainted, interviewees may be more hesitant to share details about their personal experiences.
7. Recommendations
••Future research••
The most obvious avenue for future research are new and emergent uses of mobile coverage that may become available to rural residents through improved coverage in areas that have benefitted specifically from the SRN programme . The current survey made apparent that when considering improved mobile coverage, many respondents first and foremost thought of their most fundamental coverage needs such as safety concerns and convenience aspects (e.g., maps and train times). Yet, once mobile coverage enables these functionalities, they may have positive, and potentially unforseen knock-on effects in rural areas as exemplified by Precision Agriculture. These findings from the survey have already allowed us to create a framework of benefits that may occur as a result of better mobile connectivity and increased 4G coverage. Figure 6 shows a vast range of potential benefits of 4G coverage, grouped into five main themes. Future research, conducted after coverage has increased, may be best placed to investigate these expected benefits further, as well as identify any unintended impacts.
Fig. 6. Mobile Connectivity Benefits Framework
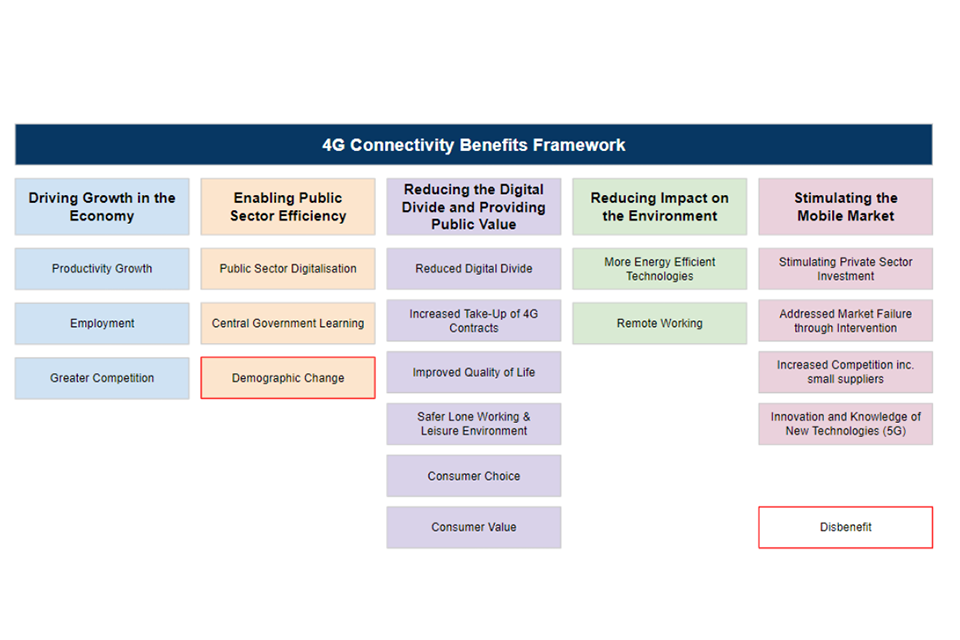
Mobile Connectivity Benefits Framework
A further crucial aspect to be explored are the benefits to marginalised groups and communities of low socioeconomic status. The current survey did not succeed in reaching such groups although they may potentially benefit the most from improved mobile coverage. As such groups rely particularly heavily on smartphones, improved coverage may benefit them in ways that go above and beyond the themes that emerged from the current work.
Participant recruitment
The current work relied heavily on opportunity sampling. This method generated a large amount of responses despite not being incentivised. In many cases, the responses formed tight geographical clusters where a small number of well-connected individuals had widely shared the survey thereby starting a cascade effect. Looking at the number of respondents recruited through personally forwarded emails, social media, and other methods (Figure 6), emails far outstripped other recruitment methods in their effectiveness. It may therefore be only necessary to reach a small number of influential individuals within a community to generate a large number of survey responses. However, while this method was effective, it also had a number of important drawbacks. Most importantly, respondents in the devolved nations appeared to be more hesitant in forwarding the survey. In those areas, a more targeted recruitment approach to establish the direct benefits brought by SRN is therefore necessary. In addition, the method also did not allow for the exclusion of areas that might not be of primary interest to the research. This latter caveat may however be partially alleviated by either including target postcode information in the beginning of the survey, or only letting participants who input ‘valid’ postcodes (valid in the sense that they are of interest to the research) complete the form.
Fig. 7. Effectiveness of recruitment methods
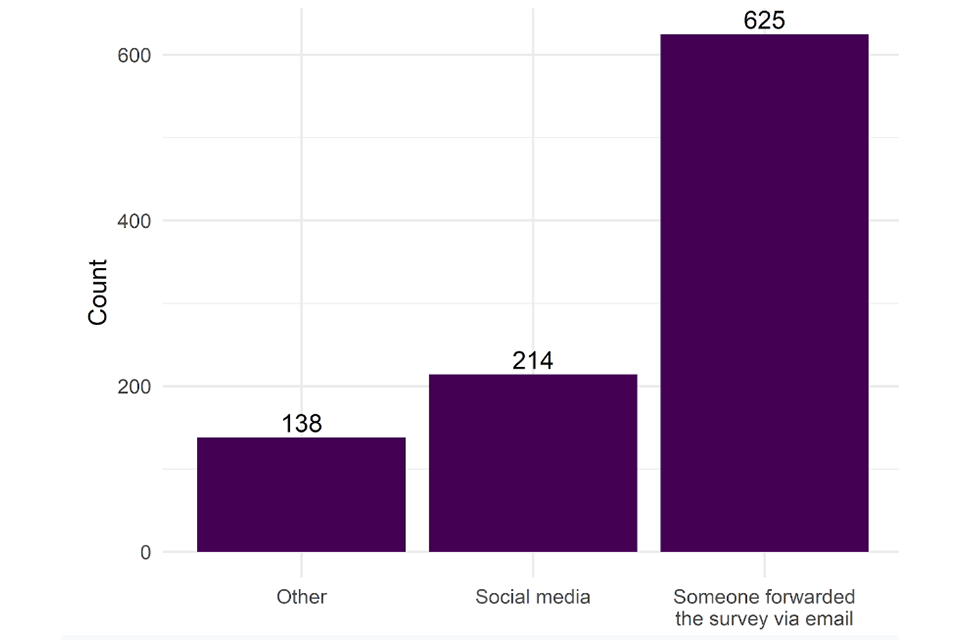
Effectiveness of recruitment methods
Appendix
Acknowledges
The research reported here was carried out by the Building Digital UK (BDUK) Benefits Realisation & Evaluation Team (Supply Side), with special thanks to Laura Hensel, Sophie Coulman, Tom Olley and Jamie Juniper.
We are grateful to all respondents of the survey that participated in this research, including those that took part in the follow-up interviews. Thanks also to all BDUK colleagues and members of the public that shared the survey with peers.
A. Survey
Qualtrics Surveys Question Demo
What is the research about?
The research is about the Shared Rural Networks (SRN) programme. SRN aims to increase mobile network coverage in rural areas to 95%, thereby helping to reduce the digital divide. The programme has been developed by the four mobile operators and the Department for Digital, Culture, Media and Sport (DCMS). More information about the programme can be found here.
DCMS is interested to find out what social impact the programme may provide in the future. Therefore, your responses may help inform government policy!
Who can take part?
We are inviting people who live or work in the UK to take part in this survey. We particularly want to hear from people in rural areas.
How can I take part?
You can take part by completing the survey online (just keep going through this survey) or you can provide us with your email-address or phone number so we can get in touch with you directly. For this, either contact us directly at Laura.Hensel@dcms.gov.uk or click ‘I consent but I would like to answer the questions over the phone/email’ on the next page.
What is involved?
If you consent to take part, we will ask you to answer a number of questions about your mobile coverage usage and satisfaction. The survey should take around 10 minutes to complete. You can also opt-in to be contacted for a follow-up interview at the end of the survey. Participation is entirely voluntary. Once you have started the survey, you are free to answer all, some or none of the questions as you see fit. You can stop the survey at any time.
After taking part in the survey, if you no longer want to be included in the evaluation, you can let us know using the contact details at the end of this page and we will delete any data we hold. You should also use the contact details if: you want access to any data we hold; you want us to not process the data we hold; or you would like to request any changes to the data we hold.
How will the information be used?
The information you provide will be valuable in helping us understand more about what impact SRN has and how the programme could be developed in the future. You will be asked to provide some personal data as part of this study, including your email address, occupation, and postcode. This will be used to help us understand the types of people who are impacted by improved mobile coverage. It will not be used to identify anyone personally. You will be free to not answer these or any other questions.
Any contact details you provide during this study will not be shared with anyone else, and will be securely destroyed at the end of the evaluation (October 2021).
Is it private?
Yes, the research is confidential. We will use everyone’s feedback to help write a report for the Government (Department for Digital, Culture, Media and Sport) and the organisation (Digital Mobile Spectrum Limited) which are delivering SRN. This report may be published.
Final datasets may be used for future research, but any analyses and publications will be entirely anonymous. Your personal data (occupation, postcode, age, gender, potentially contact details) that are linked with your survey responses will be securely destroyed by DCMS by the end of October 2021. DCMS will not share this data with any third parties.
The only time we would have to tell someone what you have said is if we were concerned that you or somebody else was at risk of harm. We would have a duty to report this.
Are there any risks to taking part?
The survey questions are not intended to cover sensitive subject areas or otherwise cause discomfort.
YOUR DATA PROTECTION RIGHTS
How we collect and use your personal information
DCMS is the data controller for the personal information you give in this study. The legal basis for processing your personal data is the public task we are undertaking in assessing SRN benefits.
Responses will remain completely confidential and anonymous information will be used in any reporting. The results of the evaluation will be shared through internal reports as well as possibly through national reports, via social media and other publicity channels. You will not be identifiable in this information.
Your data protection rights and how we protect your personal information Your rights are set out in the Data Protection Act 2018 (DPA) and GDPR, which is designed to protect and support the personal data rights for all in the UK. These include:
-
the right to be informed about who is collecting and processing your data, we set this out above;
-
the right of access, to understand what information about you is being used and how; and
-
the right to withdraw consent, at any time you can ask us to delete your personal information and no longer be included in the survey or interview.
Consent data and evaluation data will be stored on internal servers managed by DCMS – this will include the information provided in the course of the survey, which will include personal information (occupation, postcode, gender, age). Only a small number of people at DCMS will have access to consent data.
We will not move or share information about you and all data will be held securely at all times. If there are any problems with our handling of your data we will notify you and the organisation that is responsible for regulating this where we are legally required to do so.
There are other rights not listed here and exemptions may apply. For more details see here: or contact the DCMS Data Protection Officer using the contact details below.
How to contact us
If you have any concerns or questions about the study please contact: Lead researcher: Laura Hensel at Laura.Hensel@dcms.gov.uk
Data Protection Officer: dcmsdataprotection@dcms.gov.uk
I have read and understand the study information about the Shared Rural Network (SRN) Evaluation Survey. I understand that participation is voluntary and I can withdraw at any time without giving a reason. I give my consent to take part in the research, specifically a 10 minute survey, for the evaluation of the Shared Rural Network programme (please select the relevant option below).
- I consent
- I do not consent
- I consent but I would like to answer the questions over the phone/email (please provide your email address or phone number below)
Please tell us a little bit more about you.
How old are you?
- Under 18
- 18-24 years old
- 25-34 years old
- 35-44 years old
- 45-54 years old
- 55-64 years old
- 65+ years old
How do you describe yourself?
- Male
- Female
- Non-binary / third gender
- Prefer to self-describe
- Prefer not to say
Which statement best describes your current employment status?
- Working (paid employee)
- Working (self-employed)
- Not working (temporary layoff from a job, looking for work)
- Retired
- Not working for other reasons
- Prefer not to answer
Which of the following industries most closely matches the one in which you are employed?
- Accommodation or food services
- Admin, support, waste management or remediation services
- Arts, entertainment or recreation
- Construction
- Educational services
- Finance or insurance
- Forestry, fishing, hunting or agriculture support
- Health care or social assistance
- Information
- Management of companies or enterprises
- Manufacturing
- N/A/ No response
- Other services (except public administration)
- Professional, scientific or technical services
- Real estate or rental and leasing
- Retail trade
- Transportation or warehousing
- Unclassified establishments
- Utilities
- Wholesale trade
What is your home postcode?
We will now ask you a few questions about when and how you use 4G mobile coverage and how the availability of mobile coverage impacts you in your daily life. By mobile coverage, we mean using the mobile network, rather than WiFi, to make calls, send messages or access online tools and services.
How would you rate the local mobile coverage within your home?
- Very Good
- Good
- Acceptable
- Poor
- Very Poor
- Don’t know/I use broadband at home
How would you rate the mobile coverage in your surrounding area i.e., within 2-3 miles from your house?
- Very Good
- Good
- Acceptable
- Poor
- Very Poor
- Don’t know
How often do you notice the impact of mobile coverage? By impact we mean when do you notice the availability of mobile coverage while trying to use your phone.
- Almost never
- Once or twice a week
- More than twice per week
- Once or twice per day
- More than twice per day
What are you usually doing in situations when you notice the impact of mobile coverage? Select as many options as apply.
- Working
- Travelling by car
- Travelling by public transport
- At home/relaxing
- Outdoor leisure/fitness activity (for example, walking, running, cycling)
- Other (Please specify)
How frequently do you think each of the activities below are negatively impacted by poor mobile coverage?
- Talking to Family/ Friends
- Talking to work colleagues
- Talking to clients
- Recreational Uses
- Travelling
- Carrying out work-related tasks
- Carrying out essential household tasks
- Almost never
- Once or twice a week
- More than twice per week
- Once or twice per day
- More than twice per day
In this section, we are interested to find out how lack of mobile coverage impacts your life and how improved mobile coverage may help.
Can you describe a specific situation in which you were negatively impacted by poor mobile coverage in the UK?
You can describe several examples if you wish.
For example, you might have been on a hike and not been able to reach anyone in an emergency or you needed to contact your manager but couldn’t reach them from the motorway. We are interested in your personal experiences (at home, on holiday, or at work).
Has your usage of mobile coverage changed as a result of Covid-19 restrictions?
- Yes, I use it more (to work from home)
- Yes, I use it more (to keep in touch with family)
- Yes (other reasons, please specify)
- No, it’s stayed the same
- No, I use it less
What would you want to use improved coverage for, or, if you have recently received improved mobile coverage, what can you do now that you couldn’t before?
Are there any downsides that you see to improved mobile coverage?
This section includes two short questions about your broadband connection.
Do you have a broadband internet connection at home?
- Yes
- No
- Prefer not to say
How satisfied are you with your broadband connection at home?
- Extremely satisfied
- Somewhat satisfied
- Neither satisfied nor dissatisfied
- Somewhat dissatisfied
- Extremely dissatisfied
Would you be willing to be contacted for a follow-up interview?
- Yes
- No
For us to contact you about a follow-up interview, please provide your email address and/or phone number below.
- Phone
One last question: How did you find out about this survey?
- Social media (twitter, LinkedIn, Facebook)
- Someone forwarded the survey via email
- Poster (QR code)
- Other
B. Recruitment email
Hello,
Would you like to contribute to government policy? We, the Department for Digital, Culture, Media and Sport (DCMS), are currently researching the impact of mobile coverage in rural areas. This is part of our Shared Rural Network programme which aims to increase mobile network coverage across the UK to 95%. Now, we want to find out how this programme can help you in your daily life.
We particularly want to hear from you if you live or work in rural UK! You can participate via this link:
https://dcms.eu.qualtrics.com/jfe/form/SV_7QWTy9OUU4PNnmK
Or email Laura.Hensel@dcms.gov.uk to request to complete the survey over the telephone.
You can also contact Laura Hensel at the email address above if you have any questions about this research.
We hope to hear from you!
Building Digital UK (DCMS)
C. Recruitment poster
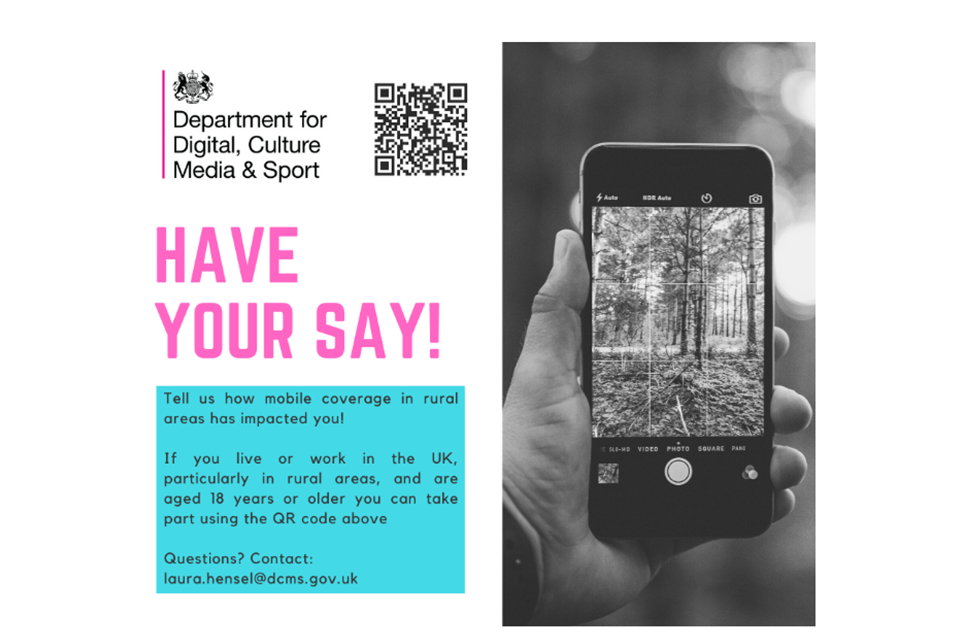
Recruitment poster 'Have your say' with photo of QR code to scan to get involved.
D. Responses
From the total of 1,314 responses, 333 were excluded for the following reasons: failing the test question (therefore could not be sure if the response was from a ‘real’ person), unfinished responses, spam answers, and clicking ‘I do not consent’.
The following tables summarise the profile and responses of those that took part in the survey. Not all questions had an obligatory answer, and therefore some were left blank and have not been included below.
Table 1. Responses by country
| Country | Number of Responses |
|---|---|
| England | 940 |
| Scotland | 24 |
| Wales | 7 |
| NI | 10 |
| Total | 981 |
Table 2. Responses by age
| Age | Number of Responses |
|---|---|
| 18-24 | 15 |
| 25-34 | 45 |
| 35-44 | 107 |
| 45-54 | 197 |
| 55-64 | 262 |
| 65+ | 355 |
| Total | 981 |
Table 3. Responses by gender
| Gender | Number of Responses |
|---|---|
| Female | 441 |
| Male | 528 |
| Prefer not to say | 11 |
| Prefer to self describe 1 | |
| Total | 981 |
Table 4. Responses by employment
| Employment | Number of Responses |
| Working (paid employee) | 417 |
| Working (self-employed) | 163 |
| Not working | 9 |
| Retired | 356 |
| Not working for other reason | 28 |
| Prefer not to say | 8 |
| Total | 981 |
Table 5. Responses by industry/ sector
| Industry/ Sector | Number of Responses |
|---|---|
| Accommodation or food services | 11 |
| Admin, support, waste management or remediation services | 27 |
| Arts, entertainment or recreation | 21 |
| Construction | 13 |
| Educational services | 51 |
| Finance or insurance | 22 |
| Forestry, fishing, hunting or agriculture support | 46 |
| Health care or social assistance | 39 |
| Information | 23 |
| Management of companies or enterprises | 29 |
| Manufacturing | 22 |
| N/A/ No response | 433 |
| Other services (except public administration) | 65 |
| Professional, scientific or technical services | 103 |
| Real estate or rental and leasing | 13 |
| Retail trade | 21 |
| Transportation or warehousing | 10 |
| Unclassified establishments | 16 |
| Utilities | 11 |
| Wholesale trade | 5 |
| Total | 981 |
Table 6. Responses to question: ‘How would you rate the local mobile coverage within your home?’
| Response | Number of Responses |
|---|---|
| Very good | 37 |
| Good | 73 |
| Acceptable | 130 |
| Poor | 233 |
| Very poor | 499 |
| Don’t know | 8 |
| Did not answer | 1 |
| Total | 981 |
Table 7. Responses to question: ‘How would you rate the local mobile coverage within your surrounding area?’
| Response | Number of Responses |
|---|---|
| Very good | 25 |
| Good | 107 |
| Acceptable | 219 |
| Poor | 392 |
| Very poor | 226 |
| Don’t know | 11 |
| Did not answer | 1 |
| Total | 981 |
Table 8. ‘How often do you notice the impact of mobile coverage?’
| Response | Number of Responses |
|---|---|
| Almost never | 58 |
| Once or twice a week | 132 |
| More than twice a week | 186 |
| Once or twice a day | 187 |
| More than twice a day | 422 |
| Did not answer | 5 |
| Total | 981 |
Table 9. ‘What are you usually doing in situations when you notice the impact of mobile coverage?’
| Response | Number of Responses |
|---|---|
| Working | 480 |
| Travelling by car | 377 |
| Travelling by public transport | 56 |
| At home/ relaxing | 628 |
| Outdoor leisure/ Fitness activity | 424 |
| Other | 108 |
| Total | 981 |
*Note respondents could choose multiple answers that were applicable for this question.
Table 10.a ‘How frequently do you think each of the activities below are negatively impacted by poor mobile coverage?’ Talking to Family/ Friends
| Response | Number of Responses |
|---|---|
| Almost never | 91 |
| Less than twice per week | 165 |
| 2-3 times per week | 256 |
| 4-7 times per week | 158 |
| Several times per day | 183 |
| I don’t use mobile coverage for this | 113 |
| Did not answer | 15 |
| Total | 981 |
Table 10.b ‘How frequently do you think each of the activities below are negatively impacted by poor mobile coverage?’ Talking to work colleagues
| Response | Number of Responses |
|---|---|
| Almost never | 85 |
| Less than twice per week | 103 |
| 2-3 times per week | 147 |
| 4-7 times per week | 103 |
| Several times per day | 188 |
| I don’t use mobile coverage for this | 292 |
| Did not answer | 63 |
| Total | 981 |
Table 10.c ‘How frequently do you think each of the activities below are negatively impacted by poor mobile coverage?’ Talking to clients
| Response | Number of Responses |
|---|---|
| Almost never | 104 |
| Less than twice per week | 85 |
| 2-3 times per week | 109 |
| 4-7 times per week | 64 |
| Several times per day | 160 |
| I don’t use mobile coverage for this | 382 |
| Did not answer | 77 |
| Total | 981 |
Table 10.d ‘How frequently do you think each of the activities below are negatively impacted by poor mobile coverage?’ Recreational Uses
| Response | Number of Responses |
|---|---|
| Almost never | 114 |
| Less than twice per week | 114 |
| 2-3 times per week | 167 |
| 4-7 times per week | 97 |
| Several times per day | 190 |
| I don’t use mobile coverage for this | 250 |
| Did not answer | 49 |
| Total | 981 |
Table 10.e ‘How frequently do you think each of the activities below are negatively impacted by poor mobile coverage?’ Travelling
| Response | Number of Responses |
|---|---|
| Almost never | 155 |
| Less than twice per week | 227 |
| 2-3 times per week | 158 |
| 4-7 times per week | 67 |
| Several times per day | 95 |
| I don’t use mobile coverage for this | 229 |
| Did not answer | 50 |
| Total | 981 |
Table 10.f ‘How frequently do you think each of the activities below are negatively impacted by poor mobile coverage?’ Carrying out work-related tasks
| Response | Number of Responses |
|---|---|
| Almost never | 99 |
| Less than twice per week | 127 |
| 2-3 times per week | 153 |
| 4-7 times per week | 115 |
| Several times per day | 190 |
| I don’t use mobile coverage for this | 241 |
| Did not answer | 56 |
| Total | 981 |
Table 10.g ‘How frequently do you think each of the activities below are negatively impacted by poor mobile coverage?’ Carrying out essential household tasks
| Response | Number of Responses |
|---|---|
| Almost never | 131 |
| Less than twice per week | 199 |
| 2-3 times per week | 188 |
| 4-7 times per week | 95 |
| Several times per day | 113 |
| I don’t use mobile coverage for this | 223 |
| Did not answer | 32 |
| Total | 981 |
Table 11. ‘Has your usage of mobile coverage changed as a result of Covid-19 restrictions?’
| Response | Number of Responses |
|---|---|
| Yes, I use it more (to work from home) | 262 |
| Yes, I use it more (keep in touch with family) | 201 |
| Yes, other reasons | 55 |
| No, it has stayed the same | 433 |
| No, I use it less | 24 |
| Did not answer | 6 |
| Total | 981 |
Table 12. ‘Do you have a broadband internet connection at home?’
| Response | Number of Responses |
|---|---|
| Yes | 948 |
| No | 30 |
| Prefer not to say | 1 |
| Did not answer | 2 |
| Total | 981 |
Table 13. ‘How satisfied are you with your broadband connection at home?’
| Response | Number of Responses |
|---|---|
| Extremely satisfied | 231 |
| Somewhat satisfied | 363 |
| Neither satisfied or dissatisfied | 76 |
| Somewhat dissatisfied | 161 |
| Extremely dissatisfied | 117 |
| Did not answer | 28 |
| Total | 981 |
Table 14. Free response questions looking at current experiences of mobile coverage, as well as opportunities with improved coverage, were broken down into the below 10 broad themes.
| Theme | Description |
|---|---|
| Convenience | Mobile coverage helping with daily (non-essential) tasks |
| DigitalDivide | Feeling left behind compared to those with better coverage |
| Productivity | Impact on people’s work and/or other types of productivity (taking longer to get somewhere etc.) |
| Cost | Anything that may increase consumer cost (or public) |
| Home | At home impacts or office (i.e., any indoor space) |
| Safety | Personal and work safety |
| Mast | Negative mast impacts |
| Negative | Negative impacts of increased from mobile coverage in general |
| Social | Improved quality of life |
| Tourism | Impact on tourism in the area |
Table 15. The following table shows how many times the above themes were mentioned as a % when respondents answered about experiences of poor mobile coverage and potential opportunities or impacts should mobile coverage be improved.
| Theme | Theme emerged in free response answers |
|---|---|
| Convenience | 10% |
| DigitalDivide | 1.6% |
| Productivity | 12.3% |
| Cost | 3% |
| Home | 37.6% |
| Safety | 17.3% |
| Mast | 3% |
| Negative | 0.6% |
| Social | 6.6% |
| Tourism | 4% |
-
Bhavnani, A., Chiu, R.W.W., Janakiram, S., Silarszky, P. and Bhatia, D., 2008. The role of mobile phones in sustainable rural poverty reduction. retrieved November, 22, p.200. ↩
-
Esteban-Navarro, M.Á., García-Madurga, M.Á., Morte-Nadal, T. and Nogales-Bocio, A.I., 2020, December. The Rural Digital Divide in the Face of the COVID-19 Pandemic in Europe—Recommendations from a Scoping Review. In Informatics (Vol. 7, No. 4, p. 54). Multidisciplinary Digital Publishing Institute. ↩
-
SRN 2020 About the Shared Rural Network, Shared Rural Network. <https://srn.org.uk/about/> ↩
-
Braun V, Clarke V. 2006. Using thematic analysis in psychology. Qual Res Psychol. 3(2):77–101. ↩
-
Kiger, M.E. and Varpio, L., 2020. Thematic analysis of qualitative data: AMEE Guide No. 131. Medical teacher, 42(8), pp.846-854. ↩
-
Defra analysis of ONS data. Rural population and migration, viewed 17 August 2021, <https://assets.publishing.service.gov.uk/government/uploads/system/uploads/attachment_data/file/912408/Rural_population__August_2020.pdf> ↩
-
Bramley, R.G., 2009. Lessons from nearly 20 years of Precision Agriculture research, development, and adoption as a guide to its appropriate application. Crop and Pasture Science, 60(3), pp.197-217. ↩
-
Health and Safety Executive, 2021. Fatal Injuries in Agriculture, Forestry and Fishing in Great Britain 2020/21. Retrieved from <https://www.hse.gov.uk/agriculture/pdf/agriculture-fatal-injuries-2021.pdf>. ↩
-
National Farmers Union, 2018. NFU Consultation Response: The Future Telecoms Infrastructure Review Call for Evidence. Retrieved from <https://assets.publishing.service.gov.uk/government/uploads/system/uploads/attachment_data/file/727865/NFU.pdf>. ↩
-
Saeri, A.K., Cruwys, T., Barlow, F.K., Stronge, S. and Sibley, C.G., 2018. Social connectedness improves public mental health: Investigating bidirectional relationships in the New Zealand attitudes and values survey. Australian & New Zealand Journal of Psychiatry, 52(4), pp.365-374. ↩
-
Stafford, M., von Wagner, C., Perman, S., Taylor, J., Kuh, D. and Sheringham, J., 2018. Social connectedness and engagement in preventive health services: an analysis of data from a prospective cohort study. The Lancet Public Health, 3(9), pp.e438-e446. ↩
-
Marler, W., 2018. Mobile phones and inequality: Findings, trends, and future directions. New Media & Society, 20(9), pp.3498-3520. ↩