
Annual qualifying defence contract statistics: 2019/20
Updated 18 August 2020

© Crown copyright 2020
This publication is licensed under the terms of the Open Government Licence v3.0 except where otherwise stated. To view this licence, visit nationalarchives.gov.uk/doc/open-government-licence/version/3 or write to the Information Policy Team, The National Archives, Kew, London TW9 4DU, or email: psi@nationalarchives.gov.uk.
Where we have identified any third party copyright information you will need to obtain permission from the copyright holders concerned.
This publication is available at https://www.gov.uk/government/publications/annual-qualifying-defence-contract-statistics-201920/annual-qualifying-defence-contract-statistics-201920
This annual bulletin presents key statistics relating to contracts that became qualifying defence contracts (QDCs) and qualifying sub-contracts (QSCs) between 1 April 2019 and 31 March 2020. This data is reported by defence contractors to the SSRO through contract reports, as required by Part 5 of the Single Source Contract Regulations 2014. Data is also presented since 1 April 2015, the start of the financial year in which contract reports were first submitted.
The SSRO was notified of 296 contracts that became QDCs/QSCs between 1 April 2015 and 31 March 2020. Contractors have one month after the date the contract becomes a QDC to submit reports, and as of 30 April 2020 the SSRO had received contract reports for 278 contracts that became QDCs/QSCs by 31 March 2020, which the following analysis is based on.
All data is based on the latest submitted report for each QDC/QSC as of 30 April 2020, to reflect the most recently reported contract data. Where any figures have been revised from those previously published, this is denoted by an r.
The bulletin contains statistics under the following sections:
- Number, duration and SME involvement
- Price and pricing methods
- Profit
- Sub-contracts
Summary
In the financial year between 1 April 2019 and 31 March 2020:
- 70 contracts became QDCs/QSCs (62 QDCs, and 8 QSCs)
- The total estimated price of these QDCs/QSCs was £8.9 billion (£8.0 billion of estimated Allowable Costs and £0.9 billion of estimated profit).
- The mean estimated contract profit rate was 9.00 per cent, an increase of 0.69 percentage points from 2018/19.
- The most commonly reported regulated pricing method (by number of QDCs/QSCs) was firm pricing, with 47 QDCs/QSCs using this method in at least a proportion of the contract.
Between 1 April 2015 and 31 March 2020:
- 278 contracts became QDCs/QSCs (236 QDCs and 42 QSCs).
- The total estimated contract price of these QDCs/QSCs was £40.8 billion (£37.1 billion of estimated Allowable Costs, £3.7 billion of estimated profit).
- The mean estimated contract profit rate for these QDCs/QSCs was 9.43 per cent.
- The most commonly reported regulated pricing method (by number of QDCs/QSCs) was firm pricing with 201 QDCs/QSCs using this method in at least a proportion of the contract. By total contract price, the most common was target pricing, with 34 per cent of contract price attributed to this pricing method.
- Of the 278 contracts that became QDCs/QSCs in this period, 13 contracts have now completed.
Number, duration and SME involvement
The number and average duration of QDCs/QSCs as well as the number of QDCs/QSCs with SMEs.
In 2019/20, the SSRO received initial contract reports for 70 QDCs/QSCs (62 QDCs and 8 QSCs).
- Since 1 April 2015, the SSRO had received reports for 278 QDCs/QSCs (236 QDCs and 42 QSCs).
- Of these 278 QDCs/QSCs, 13 QDCs/QSCs have since completed.
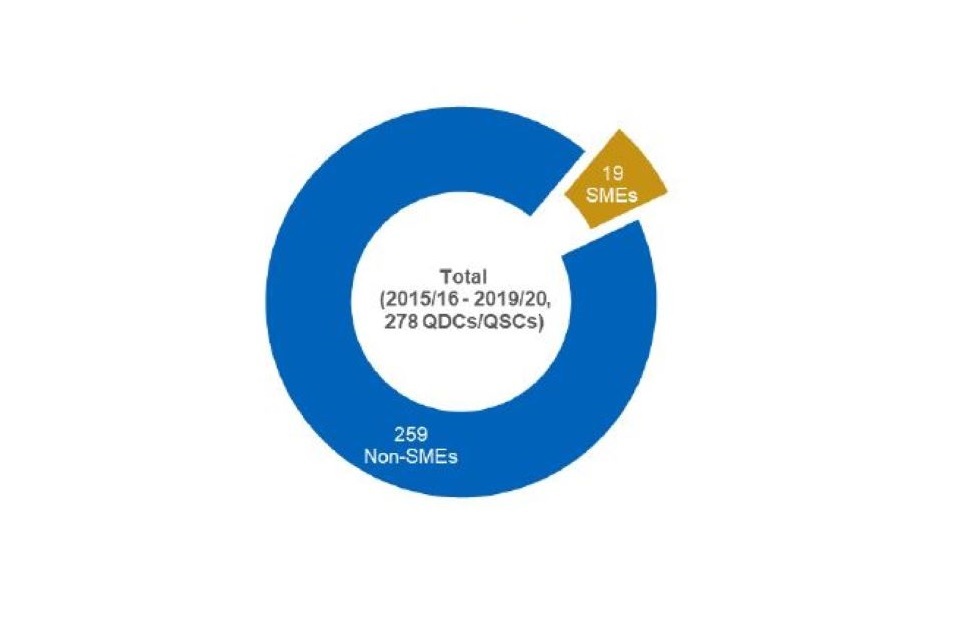
- 19 of these 278 QDCs/QSCs were with contracting companies that identified as a small or medium enterprise (SME).
- The average (mean) estimated contract duration was 4.4 years across all QDCs/QSCs.
Figure 1: Number of QDCs/QSCs by financial quarter in which contract became QDC/QSC
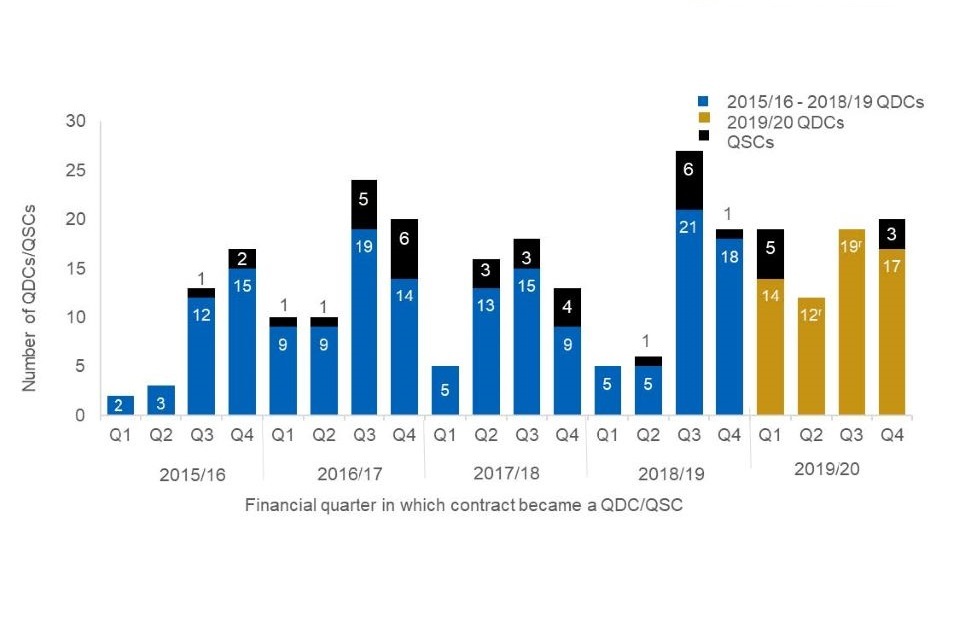
Column chart graphic. For a full breakdown of the numbers displayed in this chart please refer to the accompanying data book, tab '1. Number and duration'.
As shown in Figure 1 above, the SSRO had received reports for a total of 278 QDCs/QSCs as of 30 April 2020 (236 QDCs and 42 QSCs). There were 62 QDCs and 8 QSCs in 2019/20, compared to 49 QDCs and 8 QSCs in 2018/19. These 278 contracts were awarded to 120 different contracting companies.
Figure 2 below shows the number of contracts which became QDCs/QSCs in each year, and of these how many have completed or are still active. A completed contract is defined as a contract for which we have received a Contract Completion Report, due six months after contract completion. If we have not received this report, then the contract is defined as ‘active’. This is a new statistic in this year’s bulletin; please refer to the Data and Methodology section for further details on how this is defined. There have been 13 QDCs/QSCs that have completed since the start of 2015/16. This statistical bulletin reports on the latest agreed position for a QDC/QSC and so these statistics on completed contracts provide an indication of how ‘final’ the data reported for each year is. When a contract is completed, it is likely that no further contract update reports will be received[footnote 1] and the contract data submitted through statutory reports will remain relatively unchanged. The majority of QDCs/QSCs are still active, and so may provide further contract update reports with revised data which will be reflected in future statistics.
Figure 2: Stock of active and completed QDCs/QSCs, by financial year in which the contract became a QDC/QSC
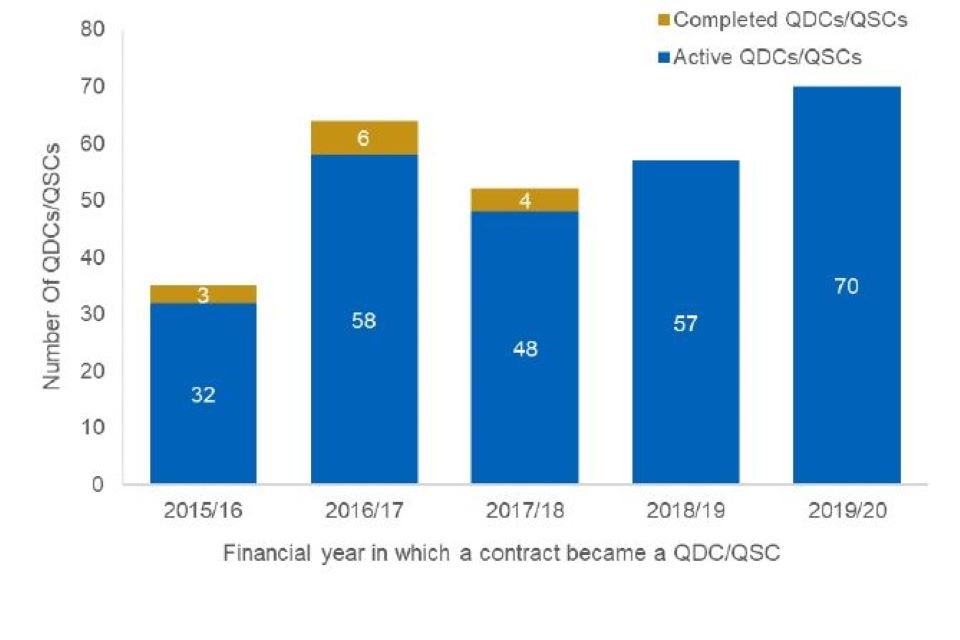
Column chart graphic. For a full breakdown of the numbers displayed in this chart please refer to the accompanying data book, tab '1. Number and duration'.
Figure 3 shows the cumulative flow of contracts becoming QDCs/QSCs, and those completing in each year, with active contracts shown as the net of these. This is also a new statistic in this year’s bulletin, and highlights the total number of contracts that became QDCs/QSCs or completed over time, in order to understand the number of active contracts subject to the regime. Currently, of the 278 contracts which became QDCs/QSCs, 265 are considered active.
Figure 3: Cumulative flow of contracts which became QDCs/ QSCs and completed and stock of active contracts
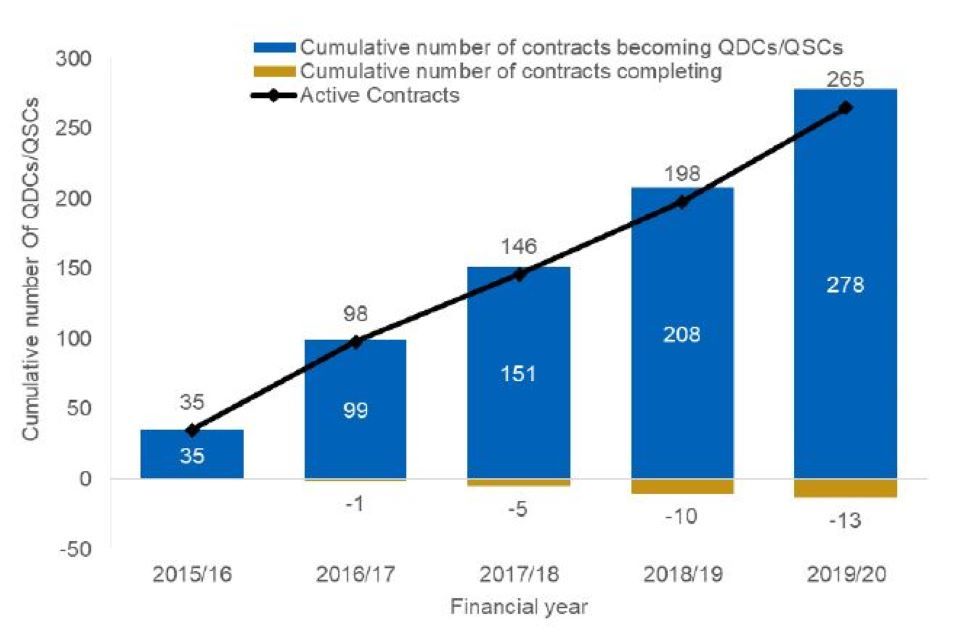
Column and line chart graphic. For a full breakdown of the numbers displayed in this chart please refer to the accompanying data book, tab '1. Number and duration'.
Duration
The average (mean) estimated duration of the 70 contracts which became QDCs/QSCs in 2019/20 was 3.9 years (see Table 1). The average estimated duration across all QDCs/QSCs was 4.4 years.
Table 1: Average (mean) estimated contract duration of QDCs/QSCs by financial year in which contract became a QDC/QSC
| Financial year in which contract became a QDC/QSC | Average duration (years) |
|---|---|
| 2015/16 | 5.0 |
| 2016/17 | 5.0 |
| 2017/18 | 4.1 |
| 2018/19 | 4.5 |
| 2019/20 | 3.9 |
| Overall | 4.4 |
The majority of all 278 QDCs/QSCs have an estimated duration of over two years to six years, as can be seen in Figure 4. Please see the accompanying databook for a breakdown by financial year in which the contract became a QDC/QSC. As contracts mature, they can be amended and extended, so the estimated duration of older contracts tends to be longer than newer contracts. For example, 80 per cent of contracts which became QDCs/QSCs in 2015/16 are now estimated to have a duration of over four years, compared with 41 per cent for 2019/20 QDCs/QSCs. The estimated duration of a contract can continue to change throughout the contract’s life; the actual duration will be reported when the contract is complete.
Figure 4: Number of QDCs/QSCs by estimated duration for all QDCs/QSCs
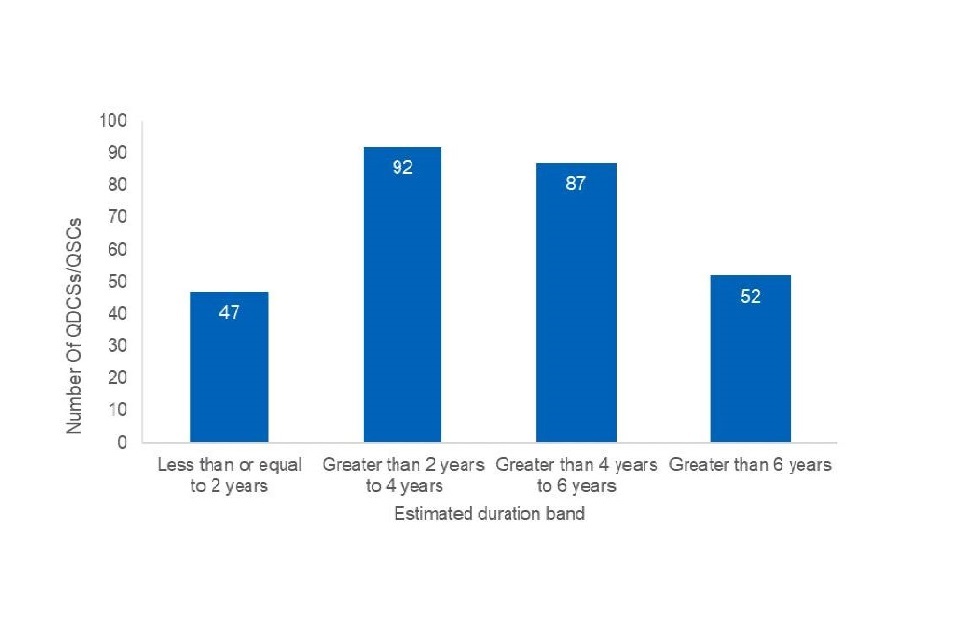
Column chart graphic. For a full breakdown of the numbers displayed in this chart please refer to the accompanying data book, tab '1. Number and duration'.
Small and Medium Enterprises (SMEs)
Figure 5 shows 7 per cent of all the 278 QDCs/QSCs were contracted with small or medium enterprises (SMEs), as reported by contractors. In 2019/20, 10 per cent of QDCs/QSCs were with an SME, compared to 5 per cent in 2018/19. Please see the accompanying databook for a breakdown by financial year in which the contract became a QDC/QSC. Additionally, Figure 15 within the accompanying databook provides an annual breakdown of the number of sub-contracts that are with SMEs.
Figure 5: Number of QDCs/QSCs that are contracted to SMEs, for all QDCs/QSCs
Doughnut chart graphic. For a full breakdown of the numbers displayed in this chart please refer to the accompanying data book, tab '1. Number and duration'.
Price and pricing methods
The total estimated contract price of QDCs/QSCs, split by Allowable Costs and profit, and the contract pricing methods employed.
Summary
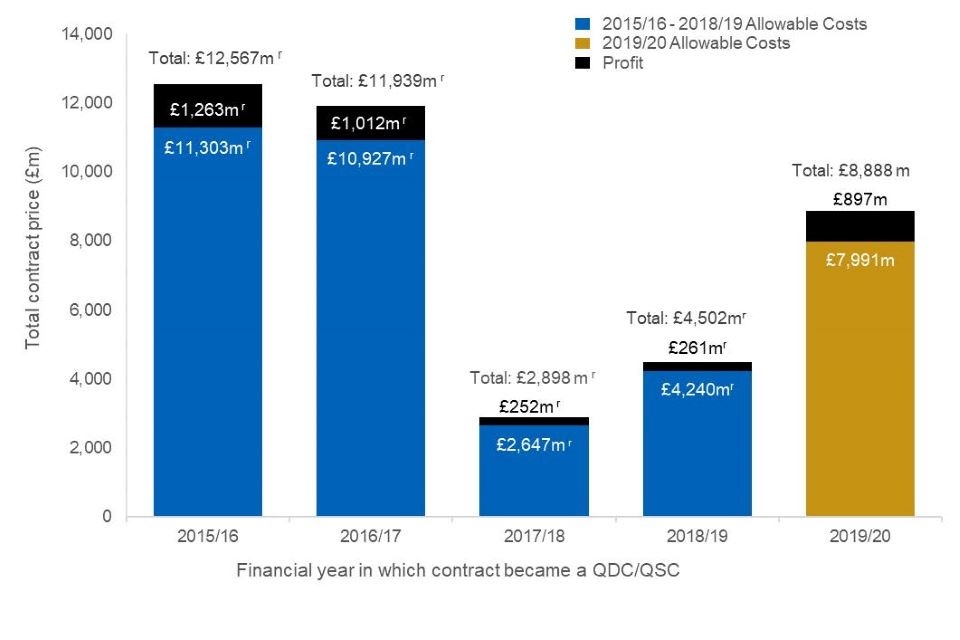
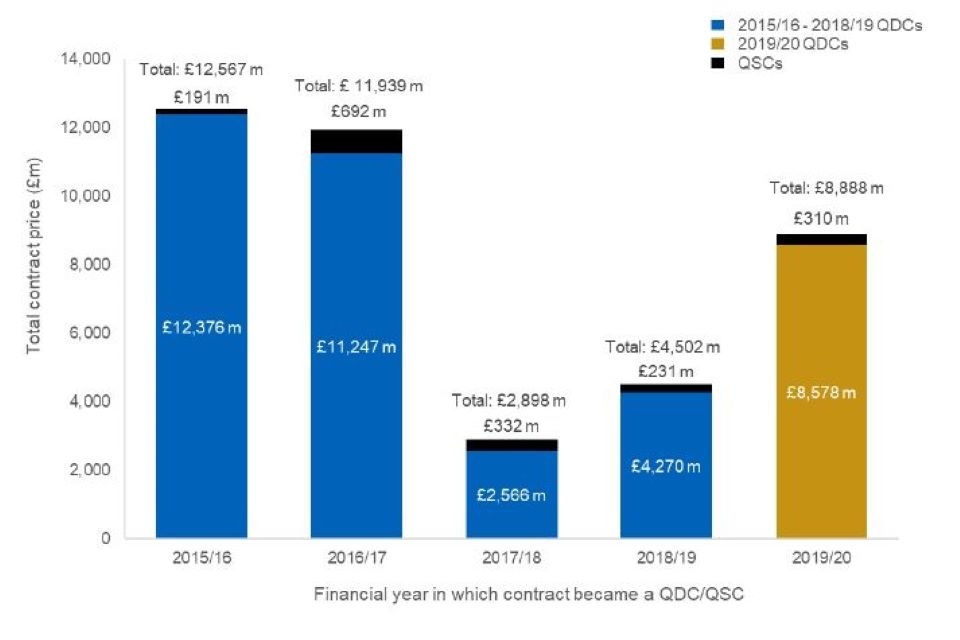
- The total estimated price of contracts which became QDCs/QSCs in 2019/20 was £8.9 billion (£8.0 billion of Allowable Costs, £0.9 billion of profit). Within this, QSCs had an estimated price of £0.3 billion, and QDCs £8.6 billion.
- Since 1 April 2015, the total price of all QDCs/QSCs was £40.8 billion (£37.1 billion of Allowable Costs, and £3.7 billion of profit). Within this, QSCs had an estimated price of £1.8 billion and QDCs £39.0 billion.
- Across all years, the majority (201) of the 270[footnote 2] QDCs/QSCs that submitted pricing method data used firm pricing as a regulated pricing method in at least a proportion of the contract. In terms of the contract price associated with each pricing method, target pricing was the method with the highest value associated with it, with 34 per cent of contract price attributed to this pricing method, closely followed by firm pricing at 31 per cent.
Figure 6: Stock of estimated total contract price of QDCs/QSCs by financial year in which contract became a QDC/QSC, split by estimated cost and profit
Column chart graphic. For a full breakdown of the numbers displayed in this chart please refer to the accompanying data book, tab '2. Price and pricing method'.
Figure 6 shows the stock of the total estimated contract price by financial year in which a contract became a QDC/QSC, split by cost and profit. The total estimated contract price for contracts that became QDCs/QSCs in 2019/20 was higher than in the previous year, at £8.9 billion in 2019/20, compared to £4.5 billion in 2018/19. Variation in the total estimated contract price can be influenced by a small number of large contracts within a given year. Please note that the total contract price may sometimes include costs incurred before a contract became a QDC/QSC (‘sunk costs’). The estimated contract price of QDCs reported throughout this section will also include the estimated contract price of the QSC.
Figure 7: Stock of estimated total contract price of QDCs/QSCs by financial year in which contract became a QDC/QSC, split by contract type
Column chart graphic. For a full breakdown of the numbers displayed in this chart please refer to the accompanying data book, tab '2. Price and pricing method'.
Figure 7 shows the stock of the total estimated contract price by financial year in which a contract became a QDC/QSC, split by contract type (whether the contract is a QDC or a QSC). This is a new presentation of the estimated contract price statistics this year. Across all QDCs/QSCs in all financial years, the vast majority (£39.0 billion; 96 per cent) of the total estimated contract price is associated with QDCs, with approximately four per cent (£1.8 billion) of the estimated contract price from QSCs.
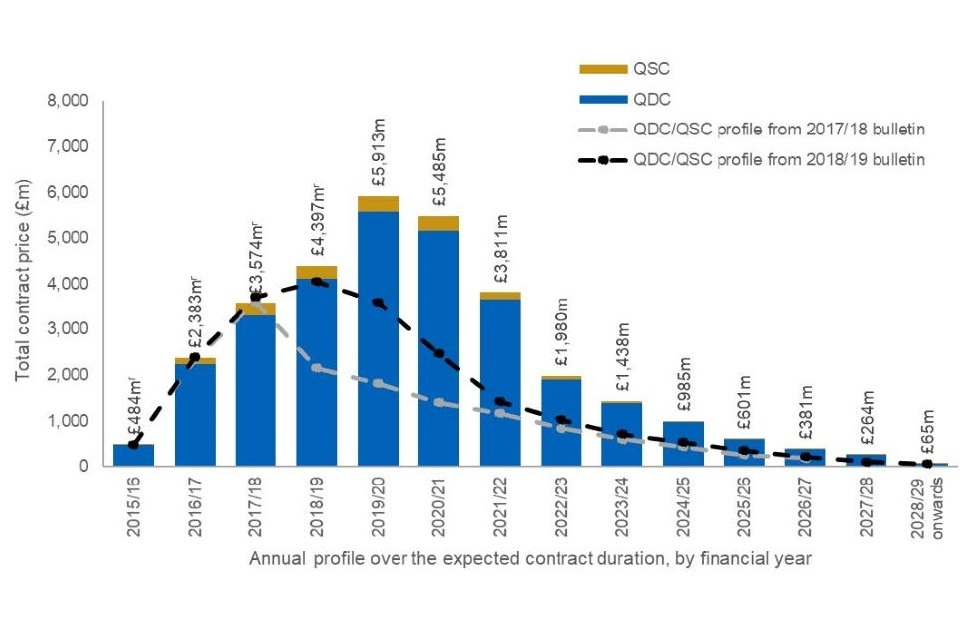
Figure 8: Flow of the estimated total contract price of all QDCs/QSCs, annual profile over the expected contract duration (excluding unprofiled amounts), by financial year
Combo column and line chart graphic. For a full breakdown of the numbers displayed in this chart please refer to the accompanying data book, tab '2. Price and pricing method'.
Note: Financial years from 2028/29 onwards have been combined due to low numbers of QDCs/QSCs reporting in these years. In some cases, the total contract price broken down by annual profile did not equal the total contract price reported elsewhere in the contract reports. The ‘profile from [year] bulletin’ series is as reported in the relevant previous annual bulletin, and so has not been updated for any corrections or any late submissions made within the last year.
Figure 8 shows the flow of estimated total contract price for all QDCs/QSCs, which breaks down the total estimated contract price for all the 278 QDCs/QSCs into an annual profile over the expected contract duration. As per the profiles from the previous two bulletins, there was a peak in the total estimated price in the current year, as this is the latest year in which new contracts have entered the regime and many QDCs/QSCs from previous years are ongoing (the average duration of QDCs/QSCs in these years is over four years). The annual total estimated price begins to decrease in future financial years, as contracts are expected to complete. Only 52 of the total 278 QDCs/QSCs have an estimated duration of over six years, which may explain the lower total estimated prices expected in later years. As new contracts become QDCs/QSCs, the values in future financial years are expected to increase, as evidenced by the profiles from the previous two bulletins. The figure includes reported pricing data profiled for 2015/16 onwards, but contractors may not profile the price, or may not profile it in the standard fields of the contract reports used in this analysis, for example where there are sunk costs. The data above accounts for £31.8 billion of the £40.8 billion total estimated contract price reported to date across all financial years.
Figure 9: Number of QDCs/QSCs by estimated contract price for all QDCs/QSCs
Column chart graphic. For a full breakdown of the numbers displayed in this chart please refer to the accompanying data book, tab '2. Price and pricing method'.
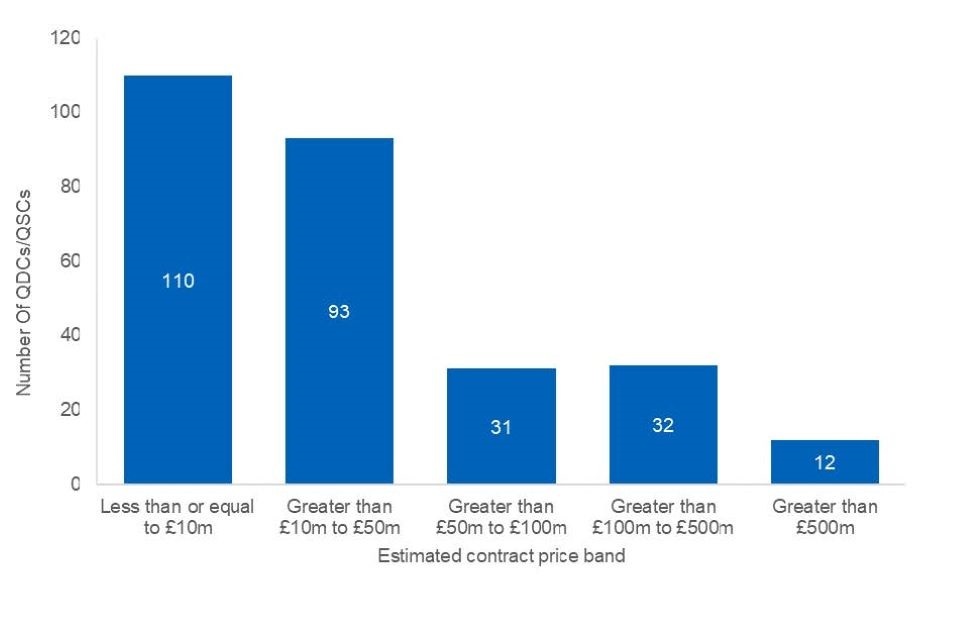
Figure 9 shows the number of QDCs/QSCs by price band for all QDCs/QSCs. Please see the accompanying databook for a breakdown by financial year in which the contract became a QDC/QSC. The values reported are the estimated prices at the time of agreement and may not necessarily reflect the outturn price at contract completion. In all years, the lower price bands of ‘less than or equal to £10m’ and ‘greater than £10m to £50m’ were the two most common price bands. In 2019/20, there are eight QDCs/QSCs with an estimated contract price of greater than £100m (11 per cent of 2019/20 QDCs/QSCs, compared to 16 per cent overall).
As contracts mature they can be amended and extended so there may be a greater proportion of contracts with a higher estimated price amongst older contracts. For example, 26 per cent (9 out of 35) of the contracts which became QDCs/QSCs in 2015/16 had an estimated price of over £100m, compared to 11 per cent for 2019/20 QDCs/QSCs (8 out of 70 contracts). A similar pattern can be seen in the contract duration statistics, where older contracts tend to have a higher proportion of QDCs/QSCs with a longer contract duration. Regulated pricing methods
The Single Source Contract Regulations 2014 (Regulation 10) specifies six regulated pricing methods that can be used to determine the price payable for a QSC/QSC. The method used to price a QDC/QSC can influence the final price and profit payable, and the incentive to control costs. The six pricing methods are as follows:
- Firm pricing;
- Fixed pricing;
- Cost-plus pricing;
- Estimate-based fee pricing;
- Volume-driven pricing; and
- Target pricing.
For a complete description of each of the six regulated pricing methods, please refer to the SSRO’s Cost risk and incentives in qualifying defence contracts recommendations discussion paper.
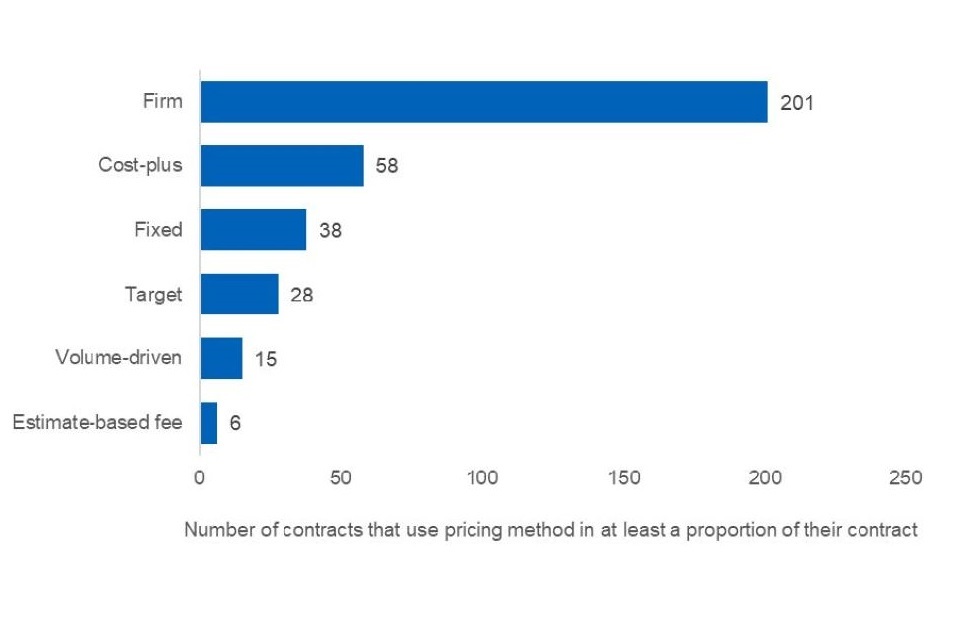
Contracts may employ multiple pricing methods for different elements of a QDC/QSC, and contractors provide a breakdown of the total contract price attributable to each of the six pricing methods in their contract reports. Contractors have not provided the required pricing method data for eight contracts, and so have been excluded from analysis in this section. Figure 10 presents the number of QDCs/QSCs that used each of the six pricing methods in at least a proportion of the contract. The single most reported pricing method across all QDCs/QSCs was firm pricing, with 201 out of 270 QDCs/QSCs (74 per cent) utilising this method as a pricing method within the contract (sometimes in combination with other pricing methods). This has been true for each individual financial year since 2015/16 too; firm pricing has always been the most utilised method. Please see the accompanying databook for a breakdown by financial year in which the contract became a QDC/QSC, which is being presented for the first time in this edition. For further detail on the top 10 combinations of pricing methods used, please see Figure 10a in the accompanying data book.
Of the 270 QDCs/QSCs where pricing method data was provided, the majority (206 QDCs/QSCs; 76 per cent) reported only using one regulated pricing method in the pricing of the contract, whilst 54 QDCs/QSCs reported using two pricing methods (20 per cent). There were 10 QDCs/QSCs that reported using three or more different pricing methods (4 per cent).
Figure 10: Number of QDCs/QSCs that use each pricing method in a proportion of the contract, for all QDCs/QSCs
Bar chart graphic. For a full breakdown of the numbers displayed in this chart please refer to the accompanying data book, tab '2. Price and pricing method'.
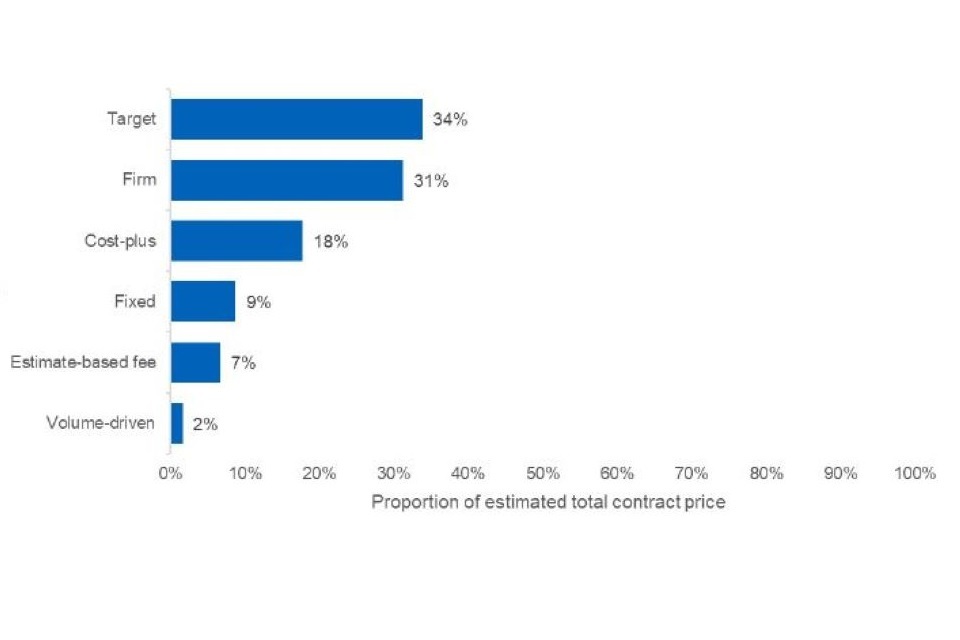
Figure 11 presents the proportion of the contract price attributed to each of the pricing methods across the 270 QDCs/QSCs that provided this data. Please see the accompanying databook for a breakdown by financial year in which the contract became a QDC/QSC. It shows that, across the five years, target pricing was the pricing method with the highest contract price associated with it (34 per cent), closely followed by firm pricing, at 31 per cent. Volume-driven pricing was the least utilised pricing method overall, with 2 per cent of the total contract price associated with this method. In 2019/20, target pricing made up only seven per cent of the total contract price, with firm pricing making up 60 per cent. To see the use of pricing methods by financial year, please refer to the accompanying databook.
Figure 11: Proportion of total estimated price of QDCs/QSCs, by regulated pricing method, for all QDCs/QSCs
Bar chart graphic. For a full breakdown of the numbers displayed in this chart please refer to the accompanying data book, tab '2. Price and pricing method'.
Profit
Estimated contract profit rates, including the adjustments made to the baseline profit rate, and the variation seen across QDCs/QSCs.
Summary
- In the 2019/20 financial year (between 1 April 2019 and 31 March 2020), the average (mean) contract profit rate was 9.00 per cent, compared to 8.31 per cent in 2018/19 QDCs/QSCs, an average increase of 0.69 percentage points.
- Aside from the baseline profit rate, the adjustment with the most impact on the overall average (mean) contract profit rate was the capital servicing adjustment in all financial years. The average (mean) capital servicing adjustment was 1.15 per cent in 2019/20 QDCs/QSCs.
- Of the 277[footnote 3] QDCs/QSCs that submitted profit information across all financial years, 28 (10 per cent) had reported a profit-on-cost-once (POCO) adjustment, whilst 55 (20 per cent) had reported an incentive adjustment.
The Defence Reform Act 2014 and the Single Source Contract Regulations 2014 together prescribe a six-step process which must be used to determine the contract profit rate for a QSC/QSC. For more information on these six steps, please refer to the SSRO’s Guidance on the baseline profit rate and its adjustment [footnote 4]. The data presented in this section is based on estimated profit rates at the time of agreement and does not necessarily represent the profit that will be achieved once the contract is complete. One contractor did not provide the required profit rate step data for their contract, and so it has been excluded from the analysis in this section. All analysis is therefore based on 277 QDCs/QSCs.
Figure 12 and Figure 13 below show the average (mean) adjustments made to the baseline profit rate for each profit rate step, for the contracts that became QDCs/QSCs in 2018/19 and 2019/20 respectively.
Figure 12: Average (mean) profit rate steps agreed at date contract became a QDC/QSC, for 2018/19 QDCs
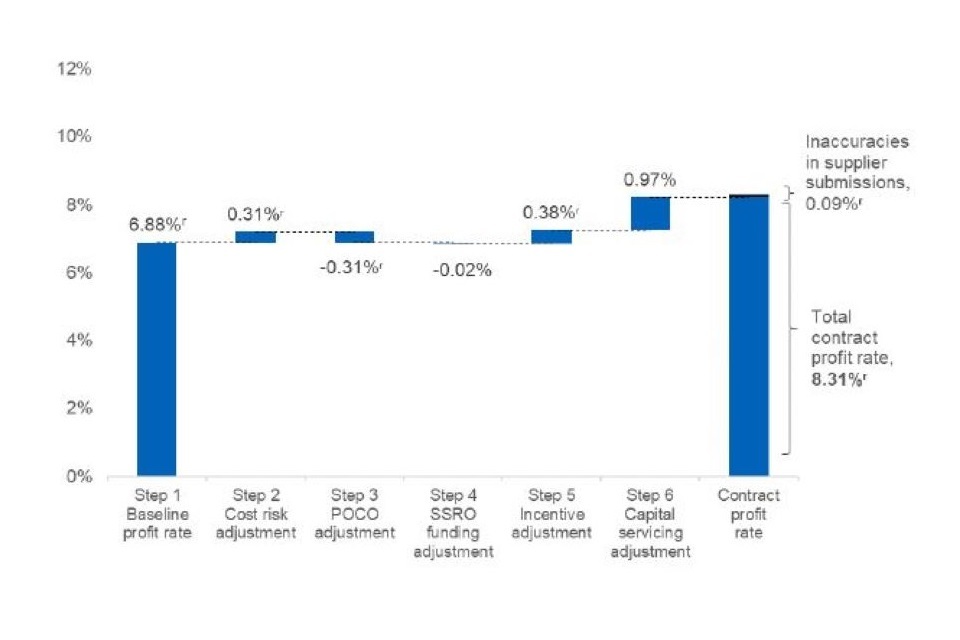
Waterfall chart graphic. For a full breakdown of the numbers displayed in this chart please refer to the accompanying data book, tab '3. Profit'.
Figure 13: Average (mean) profit rate steps agreed at date contract became a QDC/QSC, for 2019/20 QDCs[footnote 5]
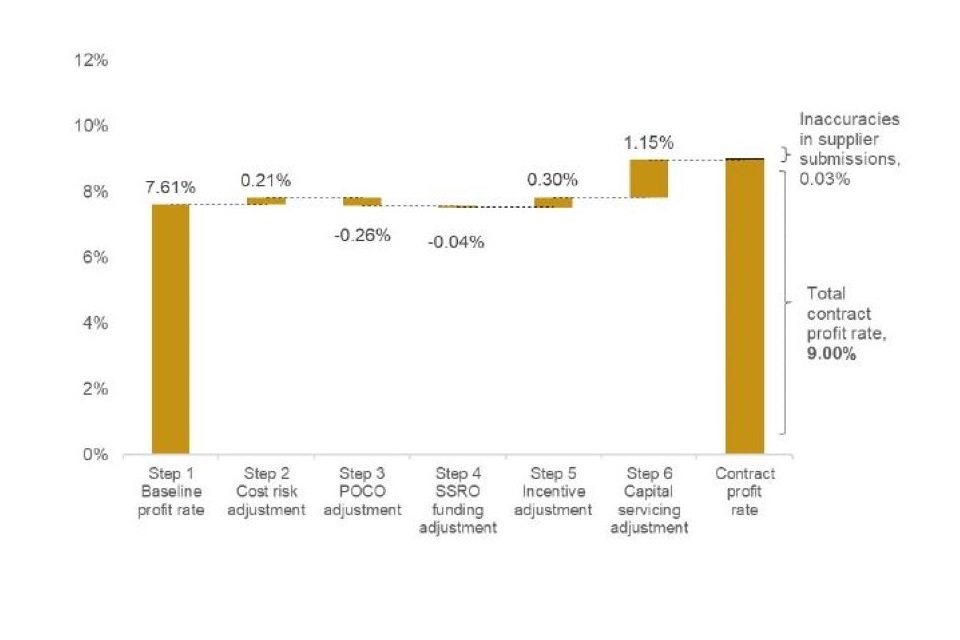
Waterfall chart graphic. For a full breakdown of the numbers displayed in this chart please refer to the accompanying data book, tab '3. Profit'.
The overall average contract profit rate was higher in 2019/20, by 0.69 percentage points compared to 2018/19 QDCs/QSCs. During the same period the baseline profit rate set by the Secretary of State increased by 0.82 percentage points from 6.81 per cent to 7.63 per cent. Whilst the baseline profit rate is a fixed rate set by the Secretary of State each year, some QDCs/QSCs had reported a different rate to this, sometimes as the result of reporting an average of two or more rates. Because of this, the difference in the average reported baseline profit rate between 2019/20 contracts and 2018/19 contracts was 0.73 percentage points.
The average capital servicing adjustment (which aims to ensure that the primary contractor receives an appropriate and reasonable return on the fixed and working capital they employ in contract delivery) changed from 0.97 per cent for 2018/19 QDCs/QSCs to 1.15 per cent in 2019/20 QDCs/QSCs, an increase of 0.18 percentage points.
The average cost risk adjustment decreased by 0.10 percentage points to 0.21 per cent for 2019/20 QDCs/QSCs, from 0.31 in 2018/19 QDCs/QSCs (the cost risk adjustment may range between +/- 25 per cent of the baseline profit rate).
The average SSRO funding adjustment changed from -0.02 per cent to -0.04 per cent during the same period, in line with the fixed rate set by the Secretary of State in each year.
The mean contract profit rate across all 277 QDCs/QSCs in all financial years was 9.43 per cent.
The step with the largest contribution towards the overall average (mean) contract profit rate each year was the baseline profit rate, contributing on average between 83 per cent to 90 per cent of the contract profit rate between 2015/16 and 2019/20, as evidenced in Table 2 below. The step with the second largest contribution was the capital servicing adjustment, which increased this year to comprise 13 per cent of the contract profit rate in 2019/20 QDCs/QSCs.
Of all 277 contracts, 81 per cent of QDCs/QSCs have agreed a contract profit rate above the baseline profit rate, due to the other steps involved in agreeing a contract profit rate shown below. For the annual figures showing how many contracts have agreed a profit rate above/below the baseline profit rate, refer to the accompanying data book.
Table 2: The contribution of each profit rate step towards the average contract profit rate, by financial year in which the contract became a QDC/QSC[footnote 6]
| Profit rate step (%) | 2015/16 (%) | 2016/17 (%) | 2017/18 (%) | 2018/2019 (%) | 2019/20 (%) |
|---|---|---|---|---|---|
| Baseline profit rate | 90 r | 83 | 87 r | 83 r | 85 |
| Cost-risk adjustment | 2 | 3 | 5 | 4 | 2 |
| Profit-on-cost-once adjustment | -2 | 0 | - 4 r | -4 r | -3 |
| SSRO funding adjustment | 0 | 0 | 0 | 0 | 0 |
| Incentive adjustment | 2 | 3 | 4 | 5 | 3 |
| Capital servicing adjustment | 10 r | 11 | 10 r | 12 r | 13 |
| Other (reporting issues) | -1 r | 0 | 0 | 1 r | 0 |
| Contract Profit Rate | 100 | 100 | 100 | 100 | 100 |
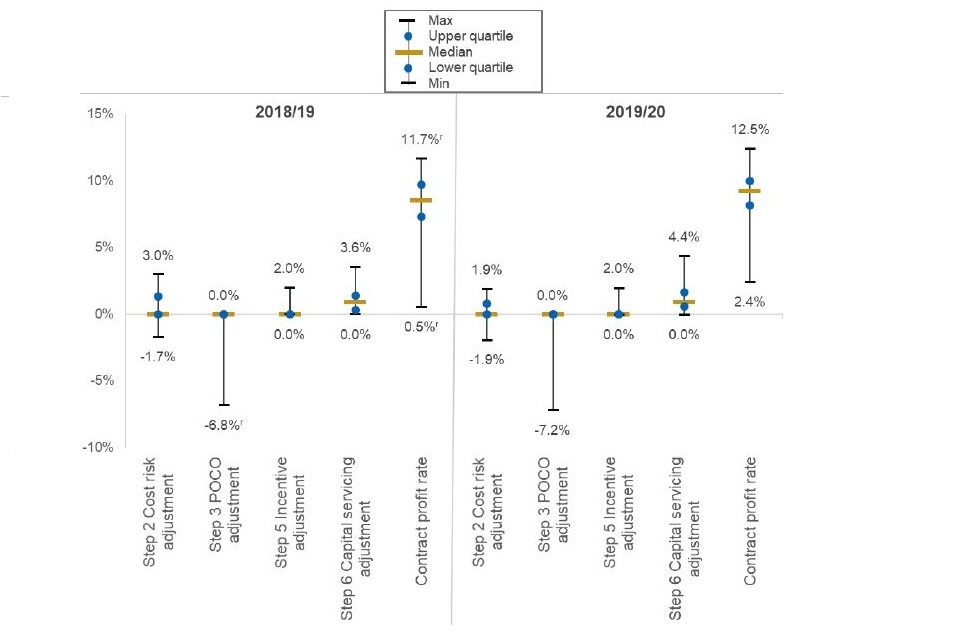
Figure 14 below shows the maximum, minimum, median and interquartile values reported for each of the profit rate adjustments (excluding the baseline profit rate and SSRO funding adjustment, which are fixed values), and the contract profit rate, for 2019/20 and 2018/19 QDCs/QSCs. The profit rate data is as reported by contractors, with no adjustments made for known data errors.
Some of the maximum and minimum points may be considered outliers, and so the interquartile range has been introduced in this year’s bulletin to provide more information on the distribution of data points for each step, specifically the spread of values within the central 50 per cent of the data. The interquartile range of all profit steps has remained relatively consistent for both 2018/19 and 2019/20 QDCs/QSCs. The interquartile range of the contract profit rate narrowed slightly within 2019/20 QDCs/QSCs; the central 50 per cent of contracts in 2019/20 had a contract profit rate between 8.2 per cent and 10 per cent, compared to between 7.3 percent and 9.7 per cent in 2018/19 QDCs.
The contract profit rate of QDCs/QSCs in 2019/20 ranged from 2.4% to 12.5%. In 2019/20 QDCs/QSCs, the profit step with the widest range was the POCO adjustment (between zero percentage points and -7.2 percentage points). This was the also the case in 2018/19 (between zero and -6.8 percentage points). The interquartile range of the POCO adjustment was zero however, indicating the small number of contracts that report a POCO adjustment (see Table 3). The use of a POCO adjustment would only be in contracts where there is group sub-contracting.
Figure 14: Maximum, minimum, median and interquartile range of profit rate steps reported in individual QDCs/QSCs, for 2018/19 and 2019/20 QDCs/QSCs
Box and whiskers graphic. For a full breakdown of the numbers displayed in this chart please refer to the accompanying data book, tab '3. Profit'.
Not all contracts receive an adjustment for each of the profit rate steps. Most contracts did not report a POCO adjustment (this adjustment may not be applicable, for example), or an incentive adjustment. Table 3 below shows the number of QDCs/QSCs that reported a POCO and/or incentive adjustment. Of the 277 QDCs/QSCs that submitted profit information across all financial years, 28 (10 per cent) had reported a profit-on-cost-once (POCO) adjustment, whilst 55 (20 per cent) had reported an incentive adjustment. In 2019/20 the proportion of QDCs/QSCs reporting an incentive adjustment has decreased slightly; this was 20 per cent in 2019/20, compared to 25 per cent in 2018/19.
Table 3: Number of QDCs/QSCs that have reported POCO and/or incentive adjustments, by financial year in which the contract became a QDC/QSC
| Total number of QDCs/QSCs | Number of QDCs/QSCs with a non-zero POCO adjustment | Number of QDCs/QSCs with a non-zero incentive adjustment | |||
|---|---|---|---|---|---|
| Number | % | Number | % | ||
| 2015/16 | 35 | 1 r | 3 r | 4 | 11 |
| 2016/17 | 64 | 6 | 9 | 14 | 22 |
| 2017/18 | 51 | 6 r | 12 r | 9 | 18 |
| 2018/19 | 57 r | 6 r | 11 r | 14 r | 25 |
| 2019/20 | 70 | 9 | 13 | 14 | 20 |
| Overall | 277 | 28 | 10 | 55 | 20 |
Sub-contracts
The number and estimated price of the sub-contracts that assist in the delivery of the QDCs/QSCs. Data is presented for the top 20 sub-contracts for each QDC/QSC with a price of greater than £1 million.
Summary
- The number of reported sub-contracts (the 20 highest value priced at greater than £1 million in each QDC/QSC) increased in 2019/20 QDCs/QSCs to 127, from 110 sub-contracts in 2018/19 QDCs/QSCs.
- The total price of reported sub-contracts in 2019/20 QDCs/QSCs decreased to £1.1 billion, from £2.3 billion in 2018/19 QDCs/QSCs, despite an increase in the total QDC/QSC price in this time period.
- The number of reported sub-contracts with SMEs as a proportion of total sub-contracts decreased (26 per cent in 2018/19 QDCs/QSCs, and 18 per cent in 2019/20 QDCs/QSCs).
- Across all years, the average price of a sub-contract with an SME was £5.8 million, compared to an average for sub-contracts with non-SMEs of £15.6 million.
The SSRO receives partial data on the details of the supply chain involved in QDCs/QSCs, for the 20 highest value sub-contracts priced at £1 million or more in each QDC/QSC. The following analysis is based on this data, and as such does not represent the entirety of sub-contracts that are involved in the delivery of QDCs/QSCs. In September 2019, the Single Source Contract Regulations 2014 were amended to require contractors to submit data on all subcontracts with a value of at least £1 million, rather than just the top 20. As this was introduced half way through the 2019/20 financial year, the analysis focuses on the top 20 subcontracts to ensure consistency with historic data. We will reconsider how best to present this data in the 2020/21 statistics bulletin.
In this section, QSCs are themselves counted as sub-contracts to the QDCs, and so are included in this analysis.
Please note that some sub-contracts may contribute to more than one contract, and as such, the sub-contract price is not necessarily fully attributable to the QDC/QSC it has been reported against. The total sub-contract prices below may therefore overestimate the amount of sub-contracting occurring in some QDCs/QSCs.
There were 605 sub-contracts with a value greater than £1 million reported to the SSRO since the start of 2015/16: 127 of these were with 2019/20 QDCs/QSCs. The proportion of all sub-contracts since the start of 2015/16 that were with SMEs was 16 per cent. For 2019/20 sub-contracts, this was 18 per cent, a decrease from 26 per cent for 2018/19 sub-contracts. Figure 15 within the accompanying databook provides a breakdown of the number of sub-contracts that are with SMEs, by financial year.
Figure 15 below shows the total reported price of all reported sub-contracts, by financial year in which the parent contract became a QDC/QSC. The total value of sub-contracts for 2019/20 QDCs/QSCs was lower than that seen for 2018/19 QDCs/QSCs. The price of sub-contracts for 2018/19 QDCs/QSCs has been revised since last year’s bulletin, increasing by £1.7 billion; this is partly because of an increase in the reported number of contracts which became QDCs/QSCs in 2018/19, which the SSRO received reports for during 2019/20.
Figure 15: Total price of top 20 reported sub-contracts above £1 million, by financial year in which contract became a QDC/QSC
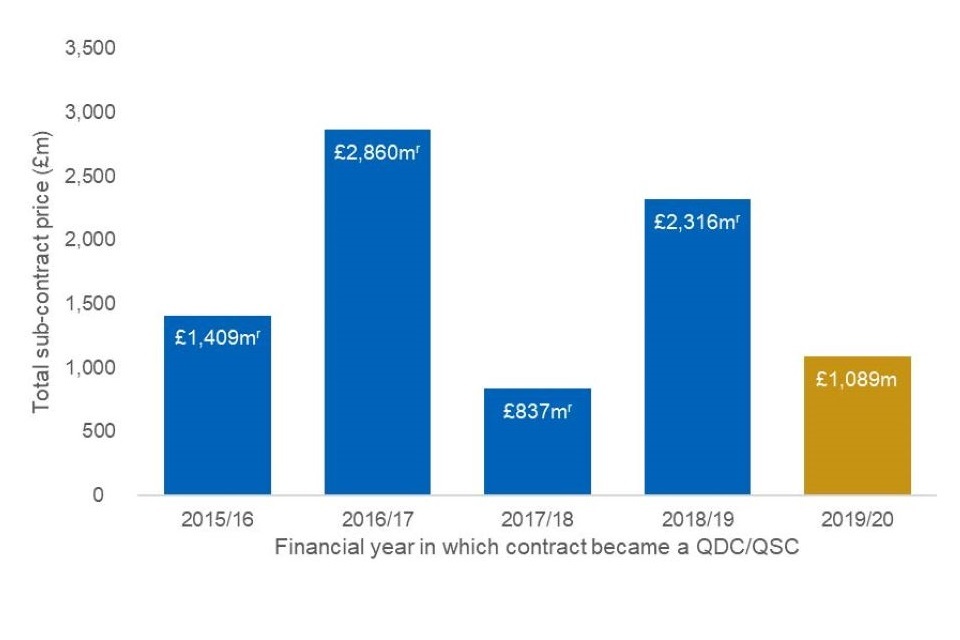
Column chart graphic. For a full breakdown of the numbers displayed in this chart please refer to the accompanying data book, tab '4. Sub-contracts'.
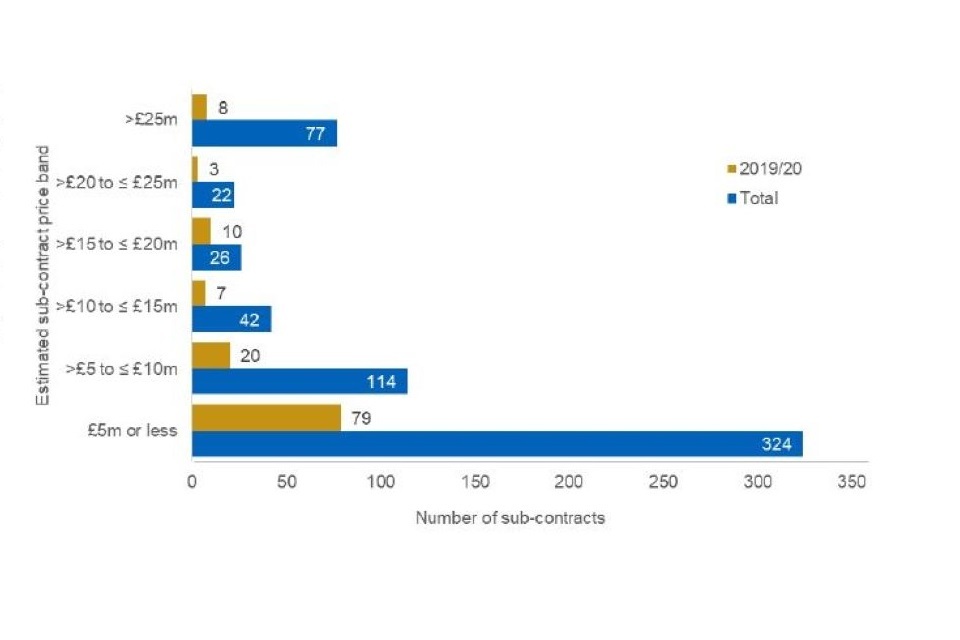
Figure 16 and Figure 17 show the number and price of reported sub-contracts split by price bands, for 2019/20 QDCs/QSCs and overall. The majority of reported sub-contracts tended to be lower value (62 per cent of 2019/20 sub-contracts were £5 million or under, whilst 53 per cent of all sub-contracts were £5 million or under), but a small number of large value sub-contracts comprised most of the total reported sub-contract price; sub-contracts priced at £25 million or greater represented 12 per cent of the number of reported sub-contracts, but 65 per cent of the total sub-contract price. For 2019/20 QDCs/QSCs, the mean reported sub-contract price was £8.6 million, down from 2018/19 where the average was £21.1 million.
Figure 16: Number of top 20 reported sub-contracts above £1 million, by price band and financial year in which contract became a QDC/QSC, for all QDCs/QSCs and 2019/20 QDCs/QSCs
Bar chart graphic. For a full breakdown of the numbers displayed in this chart please refer to the accompanying data book, tab '4. Sub-contracts'.
Figure 17: Total estimated price of top 20 reported sub-contracts above £1 million, by price band and financial year in which contract became a QDC/QSC, for all QDCs/QSCs and 2019/20 QDCs/QSCs
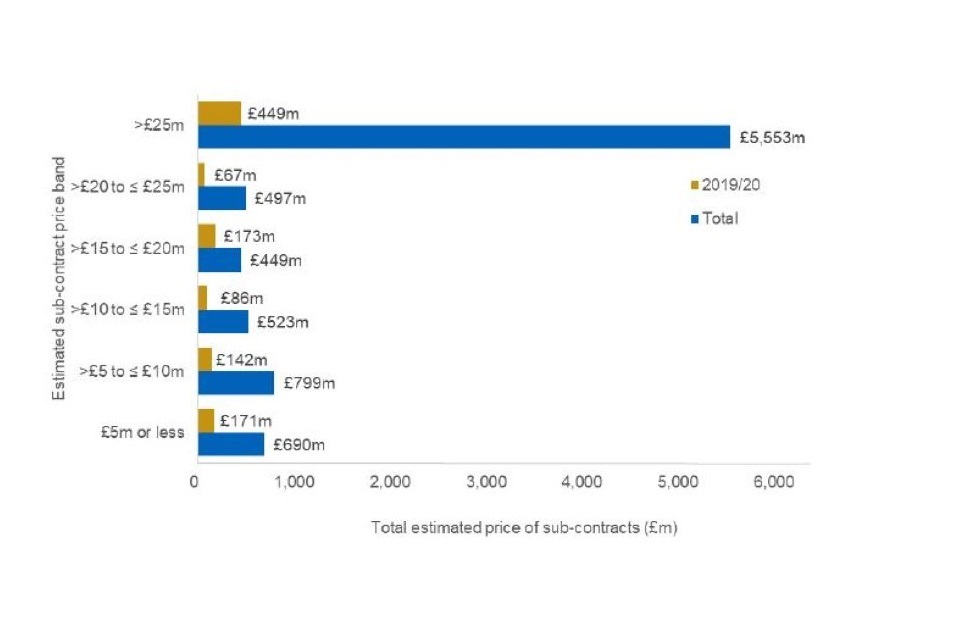
Bar chart graphic. For a full breakdown of the numbers displayed in this chart please refer to the accompanying data book, tab '4. Sub-contracts'.
Data Sources and Methodology
Data sources
The data in this report is sourced from a number of different contract reports submitted to the SSRO by contractors:
- The contract pricing and duration data in this report is sourced from the latest of the Contract Pricing Statement, Contract Notification Report, Quarterly Contract Report, Interim Contract Report or Contract Completion Report.
- The sub-contract data is sourced from the latest of the Contract Notification Report, Quarterly Contract Report, Interim Contract Report or Contract Completion Report.
- The contract profit rate data is sourced from the latest available Contract Pricing Statement only.
Because the data is sourced from a number of different reports, the contract profit rate statistics reflect the agreed position at the date the contract became a QDC/QSC, unless an updated figure has been provided in a new Contract Pricing Statement. The contract price and sub-contracts statistics reflect the latest agreed position (when the contract was either entered into or amended), and the contract duration figures reflect the latest reported contract duration. The reporting guidance for these reports is available on the SSRO’s website. Data from these reports are collated in the Defence Contract Analysis and Reporting System (DefCARS).
All time-series data apart from Figures 3 and 8 is reported using the date a contract became a QDC/QSC (the initial reporting date[footnote 7]) and defence contractors are required to submit their initial contract reports within a month of this date. Only contracts which became QDCs/QSCs on or before 31 March 2020 have been included in this release and relates to data submitted or notified to the SSRO by 30 April 2020.
Contracts that have submitted a Contract Completion Report, indicating that the contract has now completed, are still included in the analysis. New statistics showing the number of contracts that have now completed or remain active are included for the first time in this release; please see the Definitions and Clarifications section for more information.
Data revisions
The contract prices, costs, duration, sub-contracts and profit rates reported are those used for contract pricing purposes and may not reflect the final value or profit rate of the contract once it is completed. Where a contract has submitted a Contract Completion Report, the price, cost and profit rate reported in this analysis are still the estimates as at the latest time of agreement, rather than the actual values achieved. All figures are provisional and may be updated in future planned statistical releases. Data may also be revised for previous periods where report submissions which were not received by the reporting cut-off date are later received, or where suppliers have provided corrected or updated reports with new data. Where data is revised from a previously published statistic, the figure will be indicated with an ‘r’.
Where errors are found in the statistics, or where there are significant changes to published data that might affect the utility of the statistics, the SSRO may correct these by reissuing the publication, outside of the scheduled statistical release programme. Where this happens, the reason and impact of the revision will be given.
Update (18 August 2020): Updated the titles of Figure 6 and Figure 7 to align with the titles in the accompanying databook.
Adjustments to data
All data is as reported by defence contractors, except in circumstances where there are known, and significant, data quality issues. Where there are issues, the data has been amended to ensure the statistics are not misleading. In summary, the following adjustments were made in a small number of cases:
- some dates the contract became a QDC/QSC were amended, if the reported date fell within a different financial year to the known date the contract became a QDC/QSC;
- some contract/sub-contract prices were amended, for example where these were reported in different units or currency; and
- where the latest contract report did not provide the required data, a previous contract report was used if that did contain the relevant data.
Where contractors have entered monetary values in currencies other than pounds sterling, values are converted using the exchange rates published by the Bank of England as of the first day of the month in which the contract became a QDC/QSC.
Under Section 36(2) of the Single Source Contract Regulations, the SSRO monitors the extent to which report submissions comply with the reporting requirements. The SSRO Annual Compliance Report 2019 provides details on the data quality of report submissions with respect to the extent they comply with the reporting requirements. The SSRO’s compliance review function does not involve providing assurance that individual contracts have been priced in accordance with statutory requirements, nor is it an audit of individual submissions.
Definitions and clarifications
A QDC is a non-competitively procured defence contract with a value of £5 million or more. If a sub-contract of a QDC is also awarded without competition, and has a value of more than £25 million, it becomes a QSC. Although the price of a QSC is included within the ‘parent’ QDC price, for the purposes of this analysis the total price of all contracts is the total of all QDCs and QSCs (see Figure 18 for an overview of how QSCs are treated in this analysis). QSCs are included within the sub-contracting figures in this analysis. It is also possible for a sub-contract to a QSC to also become a QSC, and this would be included in both the total price of all contracts, as well as the sub-contracting figures.
Totals are calculated on unrounded figures, before being rounded for presentational purposes. The total contract price may sometimes include costs incurred before the contract became a QDC/QSC (‘sunk costs’).
The estimated contract duration is the difference between the date the contract became a QDC/QSC (either the date the contract was entered into, or if it is a QDC/QSC by amendment, the date of the amendment), and the estimated, or actual where available, contract completion date.
The ‘time of agreement’ is either the date in which a QDC/QSC is entered into, the date of an amendment it if is a QDC/QSC by amendment, or if the price payable is re-determined, the date of that redetermination.
A contract is defined as ‘completed’ where the contractor has submitted a Contract Completion Report (CCR). This is required six months after the contract completion date and is the first point at which a statutory report submission confirms that a contract has completed. The submission of this report is considered as a more robust method of establishing when a contract completes compared to using the estimated contract completion dates submitted in each report, which may change during the life of the contract. However, there may be a lag of up to six months (or more if the report submission is late) before a contract is classified as complete, and the latest financial year presented in the statistics may not reflect all contracts that have actually completed in that period.
Whilst the CCR is used as the indicator for when a contract has completed, the financial year in which the contract completed reported in this analysis is sourced from the contract completion date in the CCR. When a contract is completed, it is likely that no further contract update reports will be received and the contract data submitted through statutory reports will remain relatively unchanged. A Contract Cost Statement is received 12 months after contract completion, but this is an unstructured report and so will not be used for statistical purposes. Contracts that have not submitted a CCR are defined as ‘active’. This may include some contracts which have completed but have not yet submitted a CCR.
The SME status of a contractor or sub-contractor uses data as submitted by the contractors themselves; no verification on whether these align to the definition of an SME as required by the Single Source Contract Regulations 2014 has taken place for the purposes of this analysis.
The Defence Reform Act 2014 (the Act) requires that the price payable under a QDC/QSC must be determined in accordance with the formula: price = (CPR x AC) + AC. CPR is the contract profit rate for the contract and AC is the Allowable Costs under the contract. When agreeing the contract profit rate, contractors and the MOD must follow a six-step process set out in section 17(2) of the Act and Regulation 11 of the Single Source Contract Regulations 2014.
The average contract profit rates are an arithmetic mean of the reported contract profit rates reported by QDCs/QSCs within that financial year. Where an adjustment does not apply (as is the case with the POCO adjustment for many QDC/QSCs), this is treated as a zero in the calculations. Average contract duration is an arithmetic mean of all QDCs/QSCs within that financial year.
Contractors are required to submit the expected value of the sub-contract agreed for pricing purposes, including any options or incentive payments, which may not reflect the actual value at the end of the contract. Until September 2019, only the highest value 20 sub-contracts with a value over £1 million need to be reported to the SSRO. Since September 2019, the restriction for the top 20 sub-contracts has been removed, so all sub-contracts over £1 million must be reported (currently, only the top 20 are used in the sub-contracts analysis in this bulletin). However, some contractors provide details of sub-contracts below £1 million.
Figure 18: Diagram showing how QDC, QSC and sub-contracts have been treated in the analysis
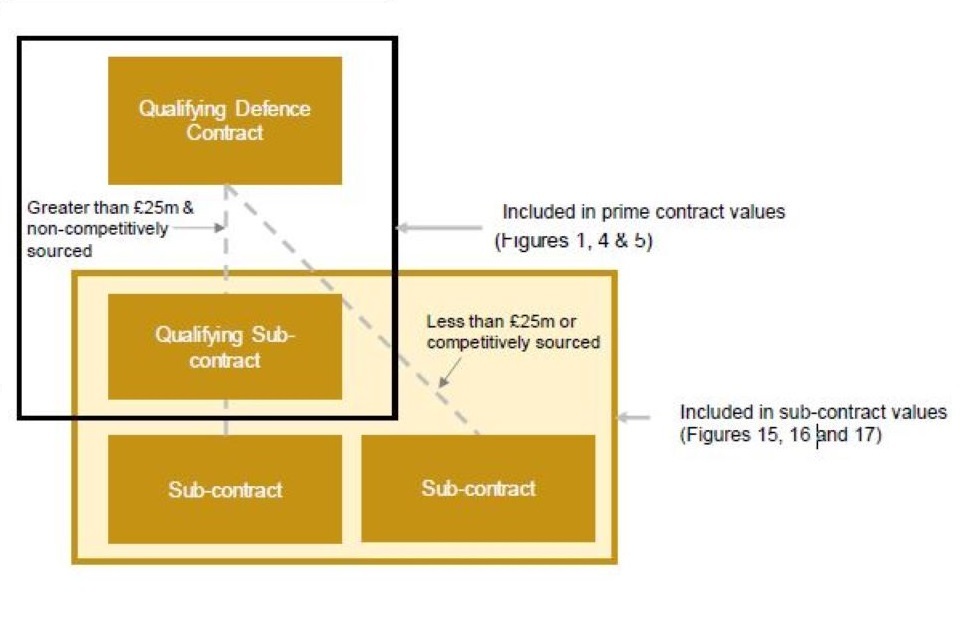
Graphic showing the relationship of QDCs, QSCs and sub-contracts within the analysis.
Commercial sensitivity
Due to the commercial sensitivity of this data, the SSRO does not release any information that will enable identification of individual contracts or contractors included within the analysis. Where publication of a low number of QDCs/QSCs within a particular data point may risk anonymity, this is suppressed, denoted by a “*”. Data relating to the number of QDCs/QSCs is not suppressed, as this does not risk disclosure of identifiable information.
For more information on the SSRO’s handling of commercially sensitive information, see the SSRO’s statement on its website.
Open Government Licence
This information is licensed under the Open Government Licence v3.0. To view this licence, visit http://www.nationalarchives.gov.uk/doc/open-government-licence/ or write to the Information Policy Team, The National Archives, Kew, Richmond, Surrey, TW9 4DU.
A licensee must acknowledge the source of the information by including the following attribution statement: “Contains public sector information licensed by the SSRO under the Open Government Licence v3.0
Further information
The SSRO is committed to engaging with stakeholders to improve these statistical releases. If you would like to get in touch, please email us at helpdesk@ssro.gov.uk. The SSRO is also happy to receive feedback through the regular face-to-face engagement it conducts with stakeholders.
-
A Contract Cost Statement is required 12 months after contract completion, but this is an unstructured report and so will not be used for statistical purposes. ↩
-
Eight QDCs/QSCs have been excluded from the analysis of pricing methods in this section due to contractors not providing the required data. Therefore, the pricing method analysis is based on 270 QDCs/QSCs. ↩
-
One QDC has been excluded from analysis in this section due to the contractor not providing the required data. The analysis in this section is therefore based on 277 QDCs/QSCs. ↩
-
https://www.gov.uk/government/publications/guidance-on-the-baseline-profit-rate-and-its-adjustment-version-6 for the latest guidance. For the guidance that applied for 2019/20 contracts, see https://www.gov.uk/government/publications/guidance-on-the-baseline-profit-rate-and-its-adjustment-version-5 ↩
-
Note: Some QDCs/QSCs had reported a BPR or SSRO funding adjustment that differed from the rate set by the Secretary of State (for example where a profit rate includes sunk costs, before the BPR was set), which explains why these figures do not show the published rates. ↩
-
The ‘other’ row relates mostly to data quality issues, where the reported profit rate steps do not sum to the total contract profit rate reported by contractors. ↩
-
Either the date the contract was entered into, or if it is a QDC/QSC by amendment, the date of the amendment. ↩