Alcohol and late night refreshment licensing England and Wales 31 March 2013
Published 14 November 2013
Applies to England and Wales

© Crown copyright 2013
This publication is licensed under the terms of the Open Government Licence v3.0 except where otherwise stated. To view this licence, visit nationalarchives.gov.uk/doc/open-government-licence/version/3 or write to the Information Policy Team, The National Archives, Kew, London TW9 4DU, or email: psi@nationalarchives.gov.uk.
Where we have identified any third party copyright information you will need to obtain permission from the copyright holders concerned.
This publication is available at https://www.gov.uk/government/statistics/alcohol-and-late-night-refreshment-licensing-england-and-wales-31-march-2013/alcohol-and-late-night-refreshment-licensing-england-and-wales-31-march-2013
The Home Office is seeking feedback on this publication so that we can assess how well it meets our users’ needs and make improvements where possible. If you have not already done so, please could you complete a short five-minute survey.
1. Introduction
This release contains statistics on the following licensing authority powers under the Licensing Act 2003:
- premises licences
- club premises certificates
- personal licences
- late night refreshment and 24-hour alcohol licences
- temporary event notices (TENs)
It also includes statistics on:
- reviews, hearings and appeals
- cumulative impact areas
Headline figures, which include modelled estimates for non-responding licensing authorities (LAs), show that on 31 March 2013, in England and Wales, there were in force:
- 204,400 premises licences, 1% (1,900) more than the previous year
- 15,700 club premises certificates, 2% (-300) fewer than the previous year
- 544,600 personal licences, 7% (34,300) more than the previous year
The main purpose of this collection is to monitor the administration of the Licensing Act 2003 (the 2003 Act) and subsequent amendments, such as those introduced by the Police Reform and Social Responsibility Act 2011 (the 2011 Act). It provides information to inform the Government’s evaluation, impact assessments and policy making. The collection also helps licensing authorities to benchmark their position and understand the national context.
Further information on the types of licence, as well as a glossary of terms, and conventions used in the statistics are available in the User guide to alcohol and late night refreshment licensing statistics (referred to as the user guide from this point on). Section 8, data quality and interpreting the figures, at the bottom of this release, provides information on response rates, modelling, bias and underestimates. It also includes a revisions analysis.
The figures within this release, as well as additional ones, are provided within the ‘Alcohol and late night refreshment licensing England and Wales 31 March 2013’ tables. Datasets at LA level are provided within the ‘Alcohol and late night refreshment licensing England and Wales 31 March 2013’ supplementary tables.
The Department for Culture, Media and Sport (DCMS) previously produced these statistics but in 2010 responsibility for alcohol licensing and late night refreshment was transferred to the Home Office whilst responsibility for regulated entertainment was retained by DCMS. DCMS plans to publish entertainment licensing figures as at 31 March 2013 on 5 December 2013.
The Scottish Government annually publishes Scottish Liquor Licensing Statistics under the Licensing (Scotland) Act 2005. These include headline figures on the number of premises and personal licences in force. The former includes licences for registered clubs, the equivalent to club-registered certificates, which are collected separately in England and Wales. The release also includes figures on the number of premises licences applied for, granted, and refused. The Scottish Liquor Licensing Statistics are broadly comparable with those for England and Wales. The Northern Ireland Executive does not publish Alcohol/Liquor licensing statistics.
The publication dates of future editions of this release will be announced on the UK Statistics Authority’s Publication Hub.
2. Premises licences
2.1 Introduction
A premises licence gives authority for a premises to be used for the sale or supply of alcohol, the provision of regulated entertainment, or the provision of late night refreshment, under the Licensing Act 2003.
This section contains statistics on premises licences, issued by LAs in England and Wales, that were in force on 31 March 2013, and comparisons with previous years’ figures. The headline figure for 31 March 2013 combines the data received from 99% of LAs (346 out of 350) with estimates for the remaining non-respondents. Based purely on data from the responding LAs, also presented here are breakdowns on the numbers of premises licences in force on 31 March 2013 by fee band, plus the numbers applied for, granted or refused in the year to 31 March 2013. The response rate for these figures are lower than for the headline figures and range from 79% to 97%. See the licence questionnaire for the response rate for each figure.
2.2 Key facts
Based on data received from LAs and estimates for the remaining non-respondents, there were 204,400 premises licences in force in England and Wales on 31 March 2013, a slight increase of 1% (1,900) compared with the previous year, and an increase of 3% (6,400) compared with 31 March 2009. The most recent rise could be associated with amendments made to the 2003 Act (which came into force from April 2012), which lowered the threshold of evidence needed to support decisions on whether or not to grant licences.
Number of premises licences, England and Wales, 31 March 2009 to 2013
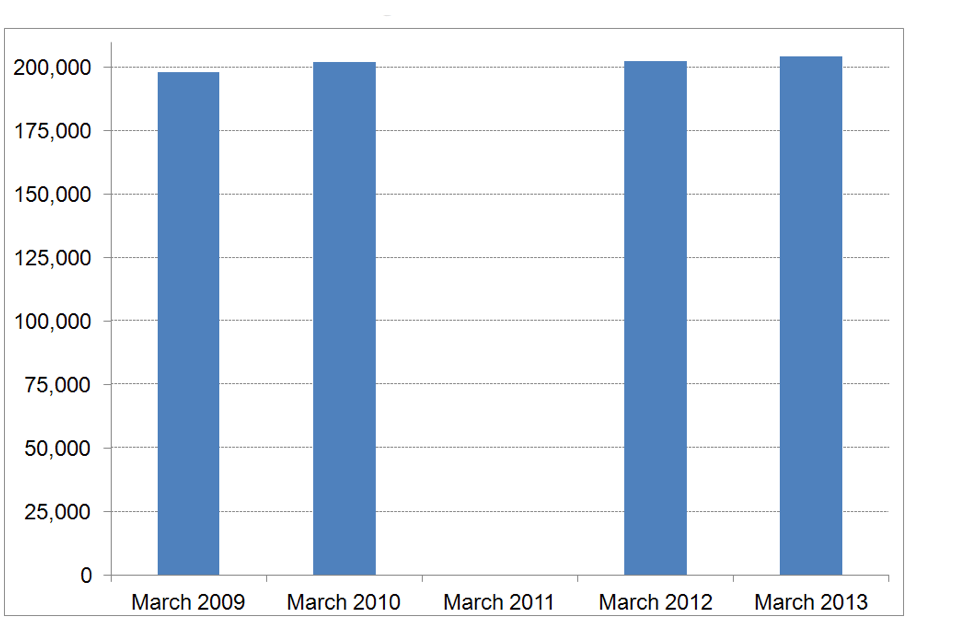
Number of premises licences, England and Wales, 31 March 2009 to 2013
Chart notes
Figures include modelled estimates for non-responding LAs.
Data were not collected for 31 March 2011.
Source: Home Office, ‘Alcohol and late night refreshment licensing England and Wales 31 March 2013’ tables.
Based on data received from LAs and estimates for the remaining non-respondents, within the 31 March 2013 total:
- 37,800 premises were licensed for on-sales of alcohol only, up 4% (1,300) compared with the previous year
- 53,900 premises were licensed for off-sales or supply of alcohol only, up 5% (2,400)
- 80,400 premises were licensed for on- or off-sales or supply, down 2% (-1,600)
2.3 Premises licences by fee band
There are 5 distinct fee bands for premises, which are based on the non-domestic rateable value of the premises. The glossary of the user guide contains more detail on fee bands, including the costs of each band, which range from an application fee of £100 and an annual fee of £70 for Band A to an application fee of £1,905 and an annual fee of £1,050 for Band E with a multiplier. Multipliers are applied to premises used exclusively or primarily for the supply of alcohol for consumption on the premises under the authorisation of a premises licence.
Based only on the LAs who provided data, there were 201,976 premises licences in force on 31 March 2013, and of these, fee band information was provided for 164,058 licences. Over half (54% or 88,079) were in Band B. The next largest fee band was Band A, which accounted for around a fifth (21% or 34,487) of premises. Of the premises licences in force on 31 March 2013, 11,164 (6% of the premises total) did not attract a fee, even though a fee band was set.
Premises licences by fee band, England and Wales, 31 March 2013
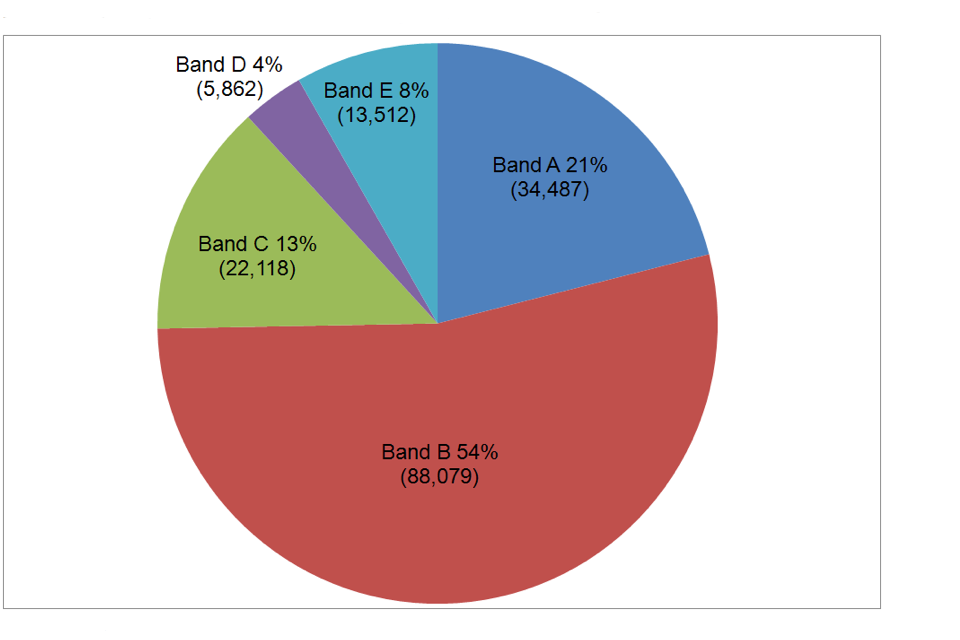
Premises licences by fee band, England and Wales, 31 March 2013, band A 34,487, band B 88,079, band C 22,118, band D 5,862, band E 13,512.
Chart notes
Bands D and E include licences for premises where fee multipliers are applied.
Source: Home Office, ‘Alcohol and late night refreshment licensing England and Wales 31 March 2013’ tables.
2.4 Premises licence activity and outcome
Based only on the LAs who provided data, 9,547 applications for new premises licences were received in the year to 31 March 2013. Of these 8,710 were granted, equating to 4% of the total number of premises licences which were in force on 31 March 2013, 313 were refused, and the outcome was unknown or to be decided for a further 524.
There were 6,533 applications made to change the terms of a licence, of which 6,021 were granted, 228 were refused and the outcome was unknown or to be decided for a further 284.
In the year to 31 March 2013, 5,053 premises licences were surrendered by the holder, 608 lapsed, 28 were suspended by the court, 3,880 were suspended by a licensing authority, and 14 were affected by a closure notice.
3. Club premises certificates
3.1 Introduction
A club premises certificate allows a qualifying club to carry out activities specified under the Licensing Act 2003. This section contains statistics on club premises certificates, issued by LAs in England and Wales, that were in force on 31 March 2013, and comparisons with previous years’ figures. The headline figure for 31 March 2013 combines the data received from 98% of LAs (344 out of 350) with estimates for the remaining non-respondents.
Based purely on data from the responding LAs, also presented here are breakdowns on the numbers of club premises certificates in force on 31 March 2013 by fee band, plus the numbers of club premises certificates applied for, granted or refused in the year to 31 March 2013. The response rate for these figures are lower than for the headline figures and range from 78% to 97%. See the licence questionnaire for the response rates for each figure.
3.2 Key facts
Based on data received from LAs and estimates for the non respondents, there were 15,700 club premises certificates in force in England and Wales on 31 March 2013, a decrease of 2% (-300) compared with the previous year and a decrease of 9% (-1,600) compared with 31 March 2009. The fall could be associated with clubs using premises licences or TENs to cover activities instead (both have increased in recent years).
Number of club premises certificates, England and Wales, 31 March 2009 to 2013
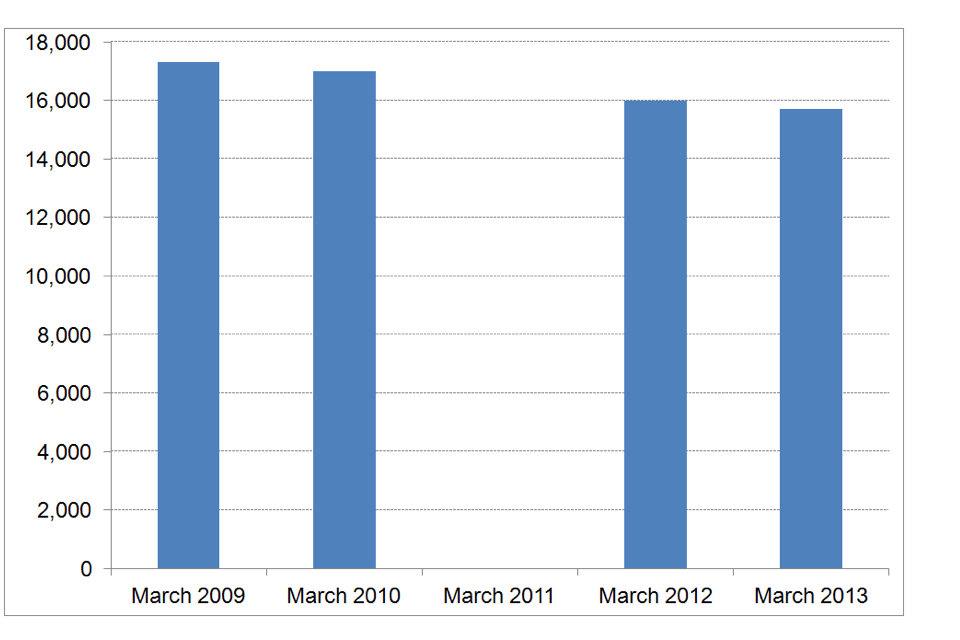
Number of club premises certificates, England and Wales, 31 March 2009 to 2013.
Chart notes
Figures include modelled estimates for non-responding LAs.
Data were not collected for 31 March 2011.
Source: Home Office, ‘Alcohol and late night refreshment licensing England and Wales 31 March 2013’ tables.
Based on data received from LAs and estimates for the remaining non-respondents, within the total for 31 March 2013:
- 7,400 club premises were certificated for on-sales or supply of alcohol only, down 1% (-100) compared with the previous year
- 8,200 premises were licensed for both on- and off-sales or supply of alcohol, down 2% (-200)
3.3 Club premises certificates by fee band
There are 5 distinct fee bands for club premises certificates, which are based on the non-domestic rateable value of the premises. The glossary of the user guide contains more detail on fee bands, including the costs of each band, which range from an application fee of £100 and an annual fee of £70 for Band A to an application fee of £1,905 and an annual fee of £1,050 for Band E with a multiplier.
Based only on the LAs who provided data, there were 15,479 club premises certificates in force on 31 March 2013, and of these, fee band information was provided for 12,784. Nearly two-thirds (63% or 7,998) were in Band B. The next largest fee band was Band A, which accounted for almost a third (30% or 3,832) of premises.
Of the club premises certificates in force on 31 March 2013, 87 (0.6% of the club premises total) did not attract a fee, even though a fee band was set.
Club premises certificates by fee band, England and Wales, 31 March 2013
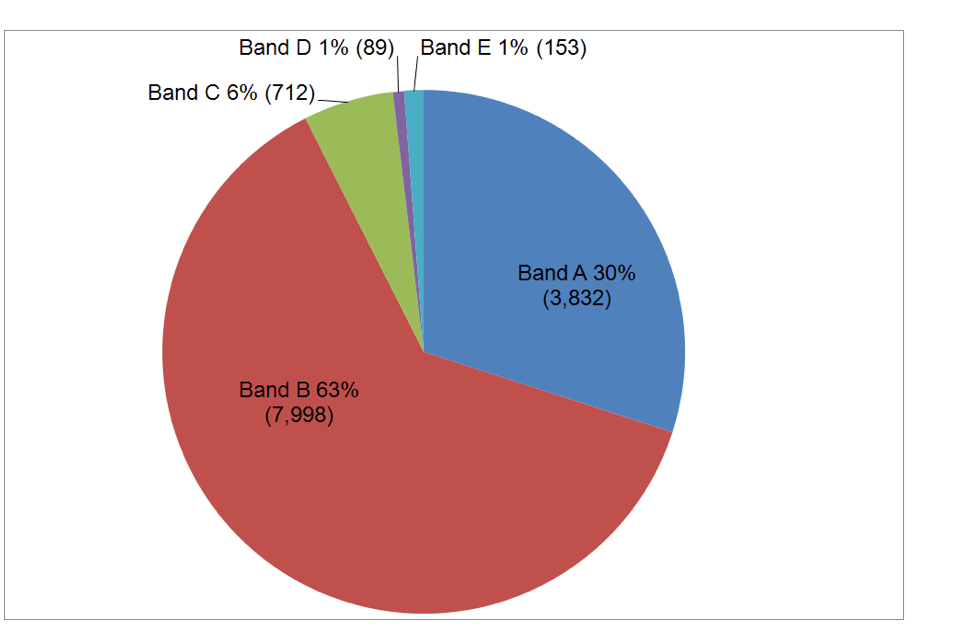
Club premises certificates by fee band, England and Wales, 31 March 2013, band A 3,832, band B 7,998, band C 712, band D 89, band E 153.
Chart notes
Bands D and E include licences for premises where fee multipliers are applied.
The percentages in the pie chart do not add up to 100% because of rounding.
Source: Home Office, ‘Alcohol and late night refreshment licensing England and Wales 31 March 2013’ tables.
3.4 Club premises activity and outcome
Based only on data provided from LAs, 134 applications for new club premises licences were received. Of these, 129 were granted, equating to just under 1% of the total number of club premises certificates which were in force on 31 March 2013, 2 were refused and the outcome was unknown or to be decided for a further 3.
There were 185 variation applications made to change the terms of a certificate, of which 175 were granted, 3 refused, and the outcome was unknown or be decided for a further 7.
In the year to 31 March 2013, 259 club premises certificates were surrendered by clubs, 19 lapsed, 137 were suspended by a licensing authority, and 30 were withdrawn.
4. Personal licences
4.1 Introduction
A personal licence authorises an individual to supply or authorise the supply of alcohol in accordance with a premises licence under the Licensing Act 2003.
This section contains statistics on the numbers of personal licences, issued by LAs in England and Wales, that were in force on 31 March 2013, and comparisons with previous years’ figures. The headline figure for 31 March 2013 combines the data received from 98% of LAs (344 out of 350) with estimates for the remaining non-respondents.
Based purely on data from the responding LAs, also presented here are figures on personal licence activity. The responses rates for these figures are lower than for the headline figures and range from 93% to 94%. See the licence questionnaire for the response rate for each figure.
4.2 Key facts
Based on data received from LAs and estimates for the non-respondents, there were 544,600 personal licences in force in England and Wales on 31 March 2013, 7% (34,300) more than the previous year, and 39% (153,000) more than 31 March 2009.
Number of personal licences, England and Wales, 31 March 2009 to 2013
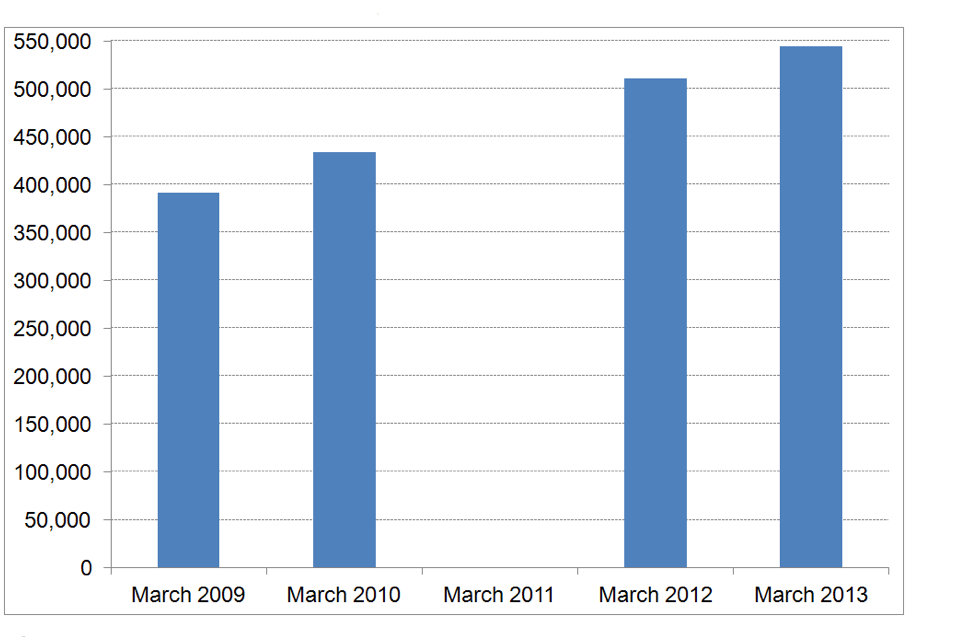
Number of personal licences, England and Wales, 31 March 2009 to 2013.
Chart notes
Figures include modelled estimates for non-responding LAs.
Data were not collected for 31 March 2011.
Source: Home Office, ‘Alcohol and late night refreshment licensing England and Wales 31 March 2013’ tables.
4.3 Personal licences activity
Based only on LAs who provided data, in the year to 31 March 2013, 610 personal licences were surrendered, 11 were revoked, 6 were forfeited and 15 were suspended by a court.
5. Late night refreshment and 24-hour alcohol licences
5.1 Introduction
Late night refreshment refers to the provision of hot food or drink to the public, for consumption on or off the premises, between 11pm and 5am or the supply of hot food or hot drink to any persons between those hours on or from premises to which the public has access. A 24-hour licence refers to premises that are licensed for the sale or supply of alcohol for 24 hours in their standard timing.
This section contains statistics on the numbers of premises licences with late night refreshment and on 24-hour alcohol licences, issued by LAs in England and Wales, that were in force on 31 March 2013, and comparisons with previous years’ figures. These headline figures for 31 March 2013 combine data received from LAs (91% or 318 out of 350 for late night refreshment and 95% or 331 for 24-hour alcohol licences) with estimates for the remaining non-respondents.
Based purely on data from the responding LAs, also presented here are breakdowns on late night refreshment and 24-hour alcohol licences. The responses rates for these figures are generally lower than for the headline figures and range from 80% to 93%. See the licence questionnaire for the response rates for each figure.
5.2 Key facts
Based on data received from LAs and estimates for the non-respondents, there were 86,700 licences with late night refreshment in force on 31 March 2013, remaining stable compared with the previous year’s figure of 87,000 but representing a 6% (5,100) increase compared with 31 March 2009. The number of licences with late night refreshment in force on 31 March 2013 equated to 42% of the total number of premises licences.
Number of late night refreshment licences, England and Wales, 31 March 2009 to 2013
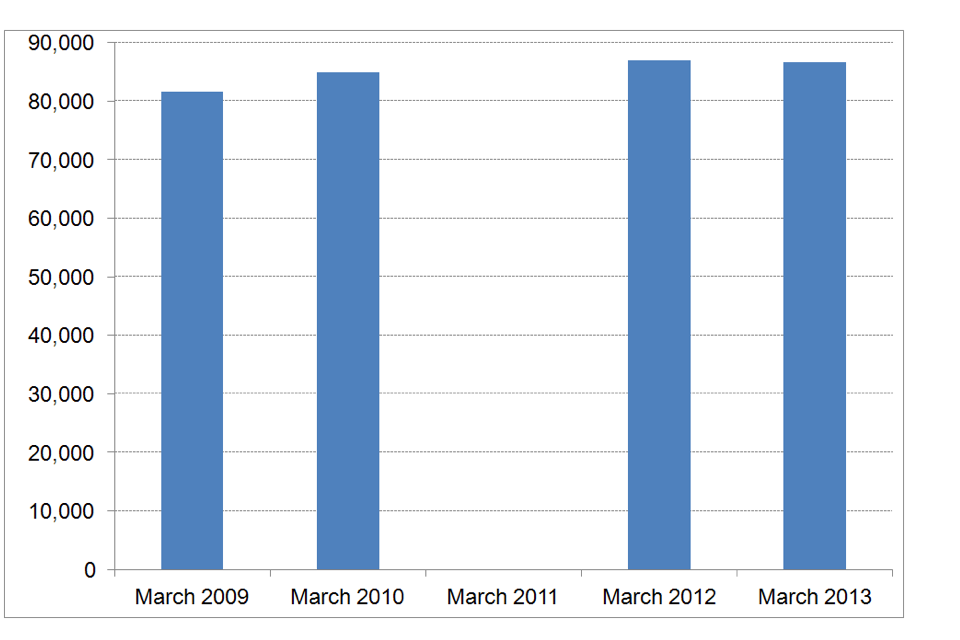
Number of late night refreshment licences, England and Wales, 31 March 2009 to 2013.
Chart notes
Figures include modelled estimates for non-responding LAs.
Data were not collected for 31 March 2011.
Source: Home Office, ‘Alcohol and late night refreshment licensing England and Wales 31 March 2013’ tables.
Based on data received from LAs and estimates for the non-respondents, there were 8,900 premises with 24-hour alcohol licences in force in England and Wales on 31 March 2013, the same as the previous year, but an increase of 17% (1,300) compared with 31 March 2009, with supermarkets and stores and other types of premises driving the trend. The number of premises with 24-hour alcohol licences in force on 31 March 2013 equated to 4% of the total number of premises licences.
Number of 24-hour alcohol licences, England and Wales, 31 March 2009 to 2013
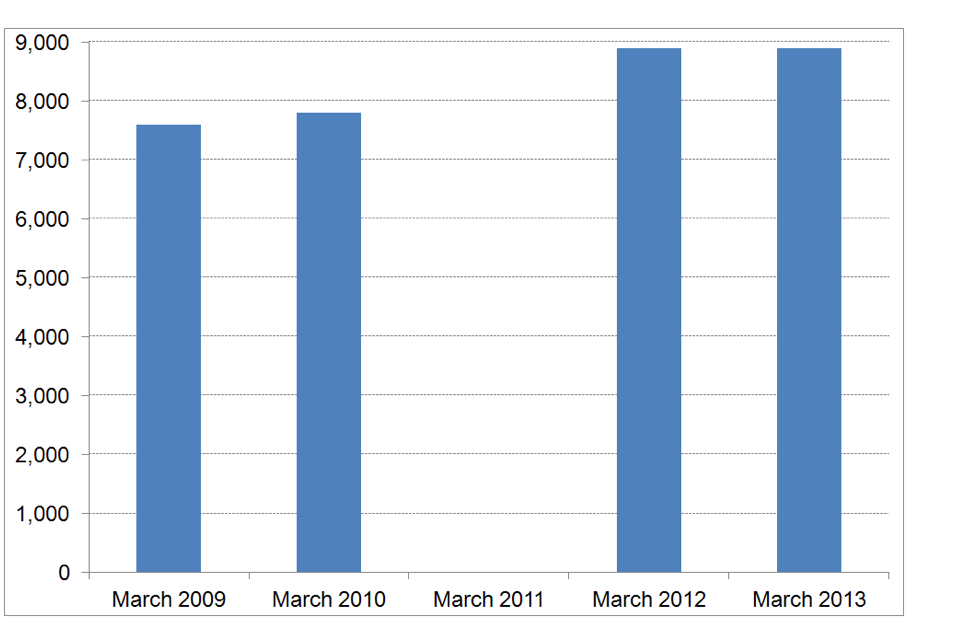
Number of 24-hour alcohol licences, England and Wales, 31 March 2009 to 2013.
Chart notes
Figures include modelled estimates for non-responding LAs.
Data were not collected for 31 March 2011.
Source: Home Office, ‘Alcohol and late night refreshment licensing England and Wales 31 March 2013’ tables.
5.3 Late night refreshment
Based only on LAs who provided data, there were 76,433 premises licences with late night refreshment in force on 31 March 2013, and of those, 16,830 premises had authorisation only for late night refreshment activity.
5.4 24-hour alcohol licences
Based only on LAs who supplied data, there were 7,672 24-hour alcohol licences in force on 31 March 2013, and of these the premises type was known for 7,352 licences.
On 31 March 2013, 45% (3,295) of all 24-hour alcohol licences were in hotel bars, of which, for where it was known, 85% (2,660) were open 24 hours for guests only and the remaining 15% (481) were open to the public as well as guests.
Supermarkets and stores accounted for 28% (2,082) of 24-hour alcohol licences, of which, for where it was known, 53% (1,072) were for convenience stores and the remaining 47% (963) were for large supermarkets. Pubs, bars, and nightclubs accounted for 12% (918) of 24-hour alcohol licences.
Premises with 24-hour alcohol licences by premises type, England and Wales, 31 March 2013
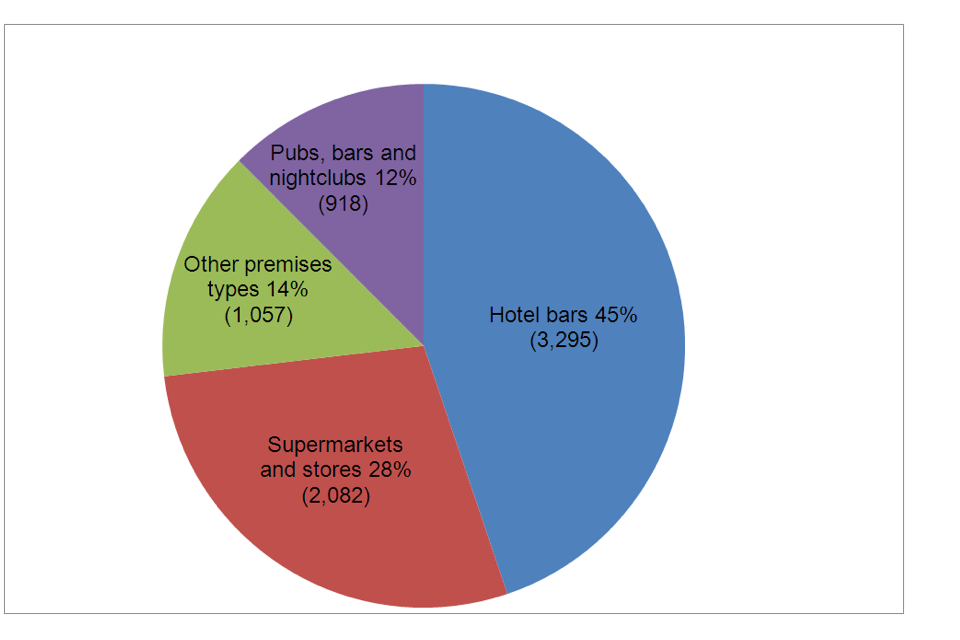
Premises with 24-hour alcohol licences by premises type, England and Wales, 31 March 2013, hotel bars 3,295, supermarkets and stores 2,082, other premises types 1,057, pubs, bars and nightclubs 918.
Chart notes
Source: Home Office, ‘Alcohol and late night refreshment licensing England and Wales 31 March 2013’ tables.
6. Reviews, hearings and appeals
6.1 Introduction
This section contains statistics on the number of reviews completed by LAs in England and Wales in the year to 31 March 2013, and comparisons with the previous year’s figure. The headline figure for 31 March 2013 combines data received from 96% of LAs (336 out of 350) with estimates for the remaining non-respondents.
Based purely on data from the responding LAs, it also contains statistics on the number of reviews completed, by the type of licence reviewed, the reason for the review, the instigating body, and the actions taken following the review. Statistics are also presented on the interim steps taken after expedited reviews, and on the numbers of hearings, appeals and judicial reviews. The responses rates for these figures are generally lower than for the headline figures and range from 79% to 99%. See the licence questionnaire for the response rates for each figure.
6.2 Key facts
Based on data received from LAs and estimates for non-respondents, 800 reviews were completed in the year to 31 March 2013, 27% (-300) fewer than the previous year.
6.3 Completed reviews
A licensing authority can be asked to review a licence on the grounds of it having an adverse impact. The figures in this section refer to reviews that were completed in the year to 31 March 2013.
Based only on LAs who were able to supply information on the type of the review:
- 86% (667) were for premises licences following a general application for a review
- 11% (88) were for premises licences following an application by the police for an expedited review
- 2% (15) were for premises licences following a closure order
- 1% (9) were for club premises certificates
Regarding the reason for completed reviews (or reasons as more than one was cited in some instances), 574 were for crime and disorder, 268 were for public nuisance, 266 were for protection of children, and 165 were for public safety.
The police were the main responsible authority, instigating 59% (460) of the total number of reviews, with trading standards being the second most common responsible authority, instigating 21% (165). Environmental health officers and local residents instigated 9% (70) and 6% (47) respectively.
Completed reviews instigated by responsible authority, England and Wales as at 31 March 2013
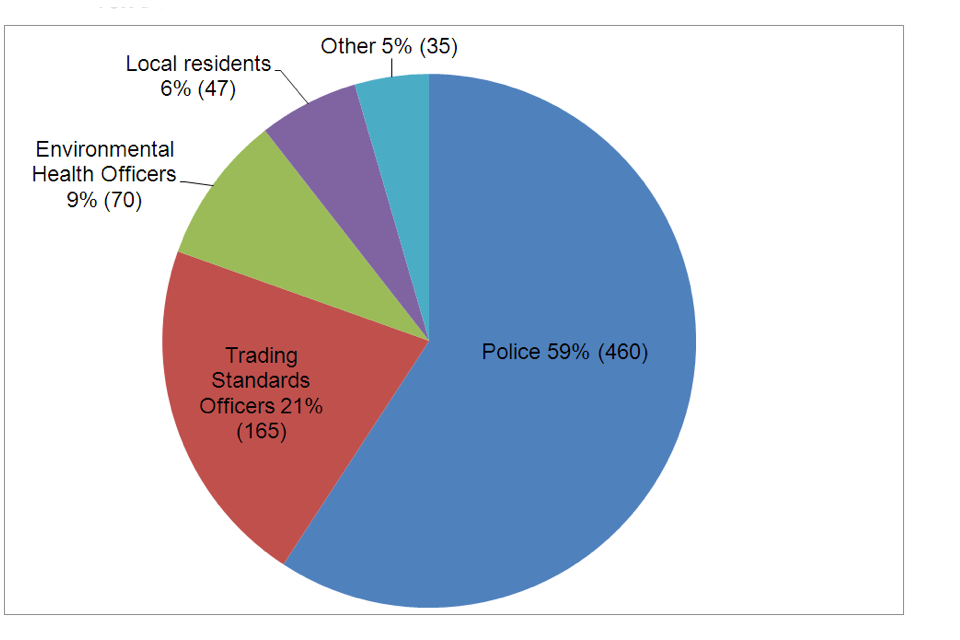
Completed reviews instigated by responsible authority, England and Wales as at 31 March 2013, police 460, trading standards officers 165, environmental health officers 70, local residents 47, other 35..
Chart notes
Source: Home Office, ‘Alcohol and late night refreshment licensing England and Wales 31 March 2013’ tables.
Regarding the action (or actions) taken following reviews, the majority (471) resulted in conditions being added to the licence or modified, 150 resulted in a licence being revoked or a club premises certificate being withdrawn and 98 resulted in a licence or certificate being suspended. No action was taken following 58 reviews.
Actions taken following completed reviews, England and Wales 31 March 2013
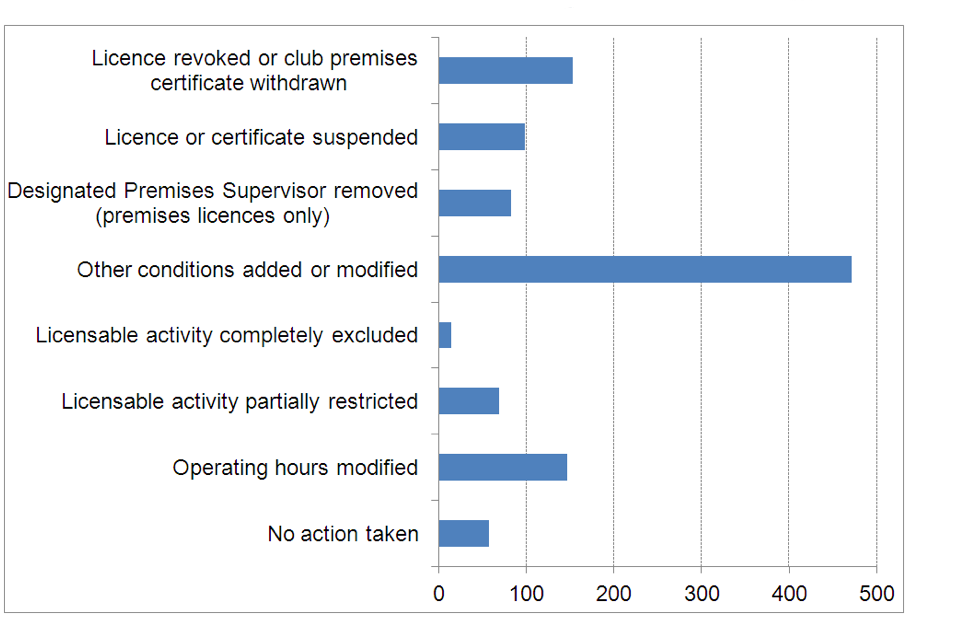
Actions taken following completed reviews, England and Wales 31 March 2013.
Chart notes
Source: Home Office, ‘Alcohol and late night refreshment licensing England and Wales 31 March 2013’ tables.
6.4 Expedited reviews
Expedited review powers allow the police to trigger a fast-track process to review a premises licence where they consider a premises to be associated with serious crime and/or serious disorder, and allow the licensing authority to quickly respond by taking interim steps, where appropriate, pending a full review. Interim steps are temporary measures which have to be taken within 48 hours of the expedited review being accepted.
Based only on LAs who provided data, there were 94 applications for an expedited review in the year to 31 March 2013, and 3 of these applications were withdrawn or rejected.
Interim steps were taken for 87 expedited reviews and none was taken in 5 cases. Where interim steps were taken:
- in 47 cases the premises licence was suspended
- in 31 cases other conditions were added or modified
- in 19 cases the designated premises supervisor was removed
- in 15 cases the operating hours were modified
- in 10 cases the licensable activity was partially restricted
- in 2 cases the licensable activity was completely excluded
6.5 Hearing, appeals and judicial reviews
LAs have 1 month, following the end of the advertising period, to hold a hearing to consider the review application. The applicant for the review, the premises licence holder and any person who submitted a representation all have a right of appeal against the panel’s decision.
Based only on data from responding LAs, in the year to 31 March 2013, 3,289 premises licence/club premises certificate applications went to a committee hearing and 226 personal licence applications went to a committee hearing.
There were 109 completed appeals against the application decision (where the magistrates’ court notified parties of its decision in the time period specified) and 114 completed appeals against the licence review decision. In the year to 31 March 2013, 230 LAs reported that no appeals were made against any decision. Just 1 judicial review was completed.
7. Other topics
7.1 Introduction
This section contains statistics on the numbers of cumulative impact areas identified by local authorities on 31 March 2013 and the number of TENs issued in the year to 31 March 2013.
A cumulative impact area is an area that the LA has identified in their licensing policy statement as having a saturation of licensed premises and the ‘cumulative impact’ of any additional licensed premises could affect the licensing objectives.
TENs are used to authorise certain relatively small-scale events involving licensable activities, subject to certain criteria and limits. The 2011 Act introduced late TENs in April 2012, which allow TENs users to give their notices 5 days ahead of the start of the temporary event period rather than the usual 10 days. Unlike standard TENs, there is no right to appeal and it cannot go ahead if the police or the environmental health authority object to it.
Headline figures on the number of cumulative impact areas only include data received from LAs (95% or 333 out of 350) whilst headline figures for TENs combine data received from LAs (96% or 336 for standard notice TENs and 91% or 318 for late notice TENs) with estimates for the remaining non-respondents.
7.2 Key facts
Based only on data received from LAs, there were 175 cumulative impact areas in place on 31 March 2013.
Based on returns received from LAs and estimates for non-response, there were 138,300 TENs used in the year to 31 March 2013, 4% (5,600) more than in the previous year, and 13% (16,200) more than in the year to 31 March 2009. The rise could reflect the increased flexibility in the system introduced by the reforms to TENS in April 2012.
8. Data quality and interpreting the figures
8.1 Response rate and modelling
For the 31 March 2013 figures, the overall response rate was very high; 99% of LAs (346 out of 350) were able to supply data, although some were unable to for all of the requested fields (see the Licence Questionnaire for the response rate for each figure).
To allow meaningful comparisons to be made between years, the headline figures within this release (i.e. the figures under the key facts’ headings) include modelled estimates for the LAs who were unable to supply data (see the User Guide for an explanation of the methodology). Some breakdowns only include data from responding LAs as it was not always possible to produce reliable modelled estimates for the non-respondents as the figures are of a smaller, disaggregated nature and the response rates were generally lower.
8.2 Bias and underestimates
We do not expect that the modelling process will introduce bias as the modelled estimates for non-responding LAs are only calculated for large headline totals, which have high response rates (ranging from 91% to 99% for the 31 March 2013 figures).
For the figures which are based purely on data received from responding LAs, the numbers will underestimate the overall picture for England and Wales, especially for figures with lower response rates (the lowest being 72%).
8.3 Revisions analysis
Of the responding LAs, 3% (9 LAs) submitted revisions which resulted in some small changes to four of the 31 March 2012 figures including breakdowns for one of the figures. Looking purely at LAs who provided data, the number of personal licences increased by 0.2% (897) as a result of the changes. The number of premises with late night refreshment increased by 0.2% (129) and the number of premises with only late night refreshment increased by 0.1% (25). Finally, the number of premises with 24-hour licences increased by 0.5% (38) and there were minor changes to some of the breakdowns of the types of premises with a 24-hour licence (changes ranged from -0.1% to 1%).
The modelled estimates for 31 March 2012 have been revised in this year’s release as the calculations now also incorporate 31 March 2013 data where possible. This is because LAs have indicated that the figures they submit become more accurate over time so using the latest available data to calculate the modelled estimates will improve their accuracy. The table below shows how the headline figures, which include modelled estimates for the non-responding LAs, have changed ranging from a decrease of 10% to an increase of 6%. See the User Guide for an explanation of the modelling procedure.
Comparison between initial and revised headline figures, which include modelled estimates for non-responding LAs, for 31 March 2012
| 31 March 2012 - last year’s publication | 31 March 2012 - this year’s publication | Change | % Change | |
|---|---|---|---|---|
| Premises licences | 202,000 | 202,500 | 500 | 0.2% |
| Club premises certificates | 15,900 | 16,000 | 100 | 1% |
| Personal licences | 502,400 | 510,300 | 7,900 | 2% |
| Premises licences on-sales of alcohol only | 35,500 | 36,500 | 1,000 | 3% |
| Premises licences off-sales or supply of alcohol only | 51,130 | 51,500 | 370 | 1% |
| Premises licences both on- and off-sales or supply of alcohol | 82,900 | 82,000 | -900 | -1% |
| Club premises certificates on-sales of alcohol only | 7,400 | 7,500 | 100 | 1% |
| Club premises certificates both on- and off-sales or supply of alcohol | 8,400 | 8,400 | 0 | 0% |
| Any premises licences with late night refreshment | 87,300 | 87,000 | -300 | -0.3% |
| Premises with 24-hour alcohol licences | 8,400 | 8,900 | 500 | 6% |
| Premises with 24-hour alcohol licences: pubs, bars and nightclubs | 1,000 | 900 | -100 | -10% |
| Premises with 24-hour alcohol licences: supermarkets and stores | 2,000 | 2,100 | 100 | 5% |
| Premises with 24-hour alcohol licences: hotel bars | 4,500 | 4,600 | 100 | 2% |
| Premises with 24-hour alcohol licences: other premises type | 1,100 | 1,100 | 0 | 0.0% |
| Total number of completed reviews | 1,100 | 1,100 | 0 | 0.0% |
| Valid temporary event notices given to licensing authority | 134,100 | 132,700 | -1,400 | -1% |
The Home Office is seeking feedback on this publication so that we can assess how well it meets our users’ needs and make improvements where possible. If you have not already done so, please could you complete a short five-minute survey.