2025 drought: how it developed in England
Published 26 January 2026
Applies to England

© Crown copyright 2026
This publication is licensed under the terms of the Open Government Licence v3.0 except where otherwise stated. To view this licence, visit nationalarchives.gov.uk/doc/open-government-licence/version/3 or write to the Information Policy Team, The National Archives, Kew, London TW9 4DU, or email: psi@nationalarchives.gov.uk.
Where we have identified any third party copyright information you will need to obtain permission from the copyright holders concerned.
This publication is available at https://www.gov.uk/government/publications/2025-drought-how-it-developed-in-england/2025-drought-how-it-developed-in-england
1. Introduction
This report details the factual timeline of how the 2025 drought developed through the year in England. The 2025 drought has been a significant one in recent times. This report sets out impacts on:
- the environment
- water companies and their customers
- agriculture
- other sectors of use
England’s climate is changing, and scientists warn that weather patterns will become increasingly extreme. The drought of 2025 illustrates this volatility and how conditions can shift dramatically from very wet to very dry.
The 18 months leading up to December 2024 were the wettest on record for England. Yet by mid-February 2025, the weather turned to settled and dry. The dry end of February continued into March, causing the driest spring since the late Victorian era. Through June and July, there was a mixture of sunshine and showers plus a succession of heatwaves. August was especially dry and was on course for the one of the driest August’s on record until a damp end to the month.
By the end of the summer, reservoirs across Yorkshire and the Pennines were very low, nearly 9 million people were covered by a hosepipe ban, 20% of the canal network had closed due to water shortages, and both farmers and the environment faced severe challenges.
2025 saw many historical climate records broken, with it being the sunniest and warmest year on record for England. In contrast, September, November and December saw wetter than average conditions, with areas in the East Midlands and Humberside recording the wettest November since records began.
The Drought prospects for spring 2026 report sets out the risks that different sectors face over the winter and into next year.
For further information on how droughts are managed by the Environment Agency, see Drought: how it is managed in England.
2025 drought summary
- Driest spring in England since 1893.
- 46 drought permits granted to water companies.
- 15 key reservoirs were below 50% full at the end of September 2025.
- Hottest summer on record: 1.69°C above the long-term average.
Rainfall for England as a percentage of the long-term average (LTA), January 2025 to November 2025
| Month | % of LTA |
|---|---|
| January | 112% |
| February | 79% |
| March | 25% |
| April | 50% |
| May | 57% |
| June | 80% |
| July | 89% |
| August | 42% |
| September | 149% |
| October | 90% |
| November | 149% |
| December | 114% |
2. The weather story through 2025
- Hottest summer on record for England (June, July, August) with an average temperature of 17.42°C. This is 1.69°C above the long-term average.
- Driest spring for England in more than 100 years.
- Driest February to August on record across central and north-east England.
This section sets out how the drought developed month by month.
January
January 2025 saw a combination of unsettled and dry weather conditions with a number of named storms. In the last week of the month, storm Herminia brought heavy rainfall and strong winds to southern England. Overall, across England, rainfall was above the long-term average (LTA) at 112%. It was drier in parts of Cumbria and Northumbria but generally wetter elsewhere particularly across most of southern England.
River flows were generally normal or above with the highest monthly mean flows for January on record being recorded in the River Weaver in Cheshire.
Groundwater levels across the England were mostly within the normal to above normal range, with chalk aquifers in southern England showing exceptionally high levels. Several indicator sites recorded their highest end of January groundwater levels on record.
Regional reservoir stocks finished the month above average except for those in the north-west which were impacted by planned engineering work carried out by United Utilities.
February
February 2025 was characterised by settled and predominantly dry conditions for the first couple of weeks before the weather turned more unsettled as frontal rain moved across the country. At the end of the month high pressure started to build back in, with rainfall across England at 79% of the long-term average. Some parts of central England received less than half the usual long-term average rainfall for February. The only part of England receiving above average rainfall was central-southern England.
River flows generally returned to normal following the wet January. With drier conditions in northern England, river flows responded quickly and dropped to below normal and notably low flows. Central southern England typically saw above normal flows.
Groundwater levels were generally similar to the end of January, but levels peaked and started to recede earlier than usual in faster responding aquifers in the Cotswolds and Yorkshire.
Overall regional reservoir stocks were largely static or starting to recede across parts of northern, central and eastern England. Seasonal recession of reservoirs started earlier than normal.
March
March 2025 was dominated by persistent high pressure, with warm conditions and significantly reduced rainfall, just 25% of the monthly long-term average. It was the driest March in England since 1961 and the sixth driest on record.
Soils dried out rapidly in response to the temperatures and lack of rain.
These warm and dry conditions led to below normal to exceptionally low river flows widely across northern England. Some rivers, for example, the South Tyne in Northumbria, recorded their lowest ever monthly mean flow for March on record.
In contrast, chalk groundwater fed rivers across southern England were classed as normal or higher for the time of year, particularly in the Chilterns. Groundwater levels in the chalk and sandstones remained normal or higher at most indicator sites. Levels continued to recede most notably in the Cotswolds Oolite limestones where groundwater levels were classed a notably low for the time of year.
Reservoir storage continued to recede particularly in Cumbria, and regional stocks were below average except across the south-west and east.
April
April 2025 was notably dry and warm, ranking as the third warmest April on record since 1884. Rainfall across England was just 50% of the long-term average, with parts of the north-east receiving less than 20%. It was the third consecutive month of below average rainfall for England, and the driest February to April period since 1956.
Soils continued to dry quickly during April, except in south-west England where above-average rainfall was received and were drier than would be expected for the time of year across much of the country.
In response to another dry month, two-thirds of river flows were classed as below normal or lower. This included all sites in north-west and north-east England, 6 of which recorded their lowest April monthly mean flow on record.
April typically marks the end of the recharge season for groundwater aquifers as temperatures warm and plants start to grow, however many groundwater levels had already begun to decline in previous months following drier than average conditions, and this continued in April. In Cotswolds Oolite limestones groundwater levels were classed as exceptionally low for the time of year, while most chalk aquifer sites were classed as normal.
Reservoirs stocks in England, and those that supply England from Wales, were overall at 85% of total capacity, which was below average for the time of year.
May
May 2025 was sunny, warm, and largely dry. It was the 2nd warmest in England since records began in 1884. Despite some rainfall later in the month, total rainfall for England was 57% of the long-term average, with many parts of the country receiving less than half the rain expected for the month, It was particularly dry in the south-east. It was the driest March to May period for since 1893 for England, and the driest on record since 1871 in north-east England.
Soils continued to dry across England, although rainfall at the end of May helped some in north-west England and along the Welsh border become wetter. Despite this, soils remained drier than average for most of the country, and much drier than expected in south-east England.
River flows remained low across England, with most sites classed as below normal or lower for the time of year.
Groundwater levels continued to fall across all sites, and a number of observational wells in the chalk aquifers from Yorkshire to the Wessex and South Downs were classed as below normal.
Reservoir stocks were 77% of the total capacity, after twelve reservoirs or groups saw a decrease of more than 10% during May.
June
June 2025 was marked by contrasting weather conditions. The month began unsettled, with heavy rain in places, before ending with heatwave conditions across England. It was the warmest June on record for England. Rainfall in England was 80% of the long-term average, but there were large variations. The east of England received just 46% LTA while the north-west was much wetter and received 163% LTA.
Soils continued to dry, and were drier than expected across most of England, except in the north-west where conditions had been wettest.
River flows remained low in many parts, with most sites classed as below normal or lower, and 3 sites in the north-east recording their lowest monthly mean flow on record for June.
Groundwater levels continued to fall in June, and although many chalk and sandstone sites remained normal or higher for the time of year, the number of below normal or lower sites increased.
Reservoir storage was 75% at the end of June, the lowest it has ever been for the time of year.
July
July 2025 was warm with mixed weather, with localised heavy rainfall and high temperatures. Rainfall was below the long-term average at 89% in England, the sixth month in a row of below average rainfall. It was drier in the west and south-west but wet in the far south-east.
Soil moisture deficits remained high across England, with soils in central, east and southern England much drier than average.
Despite some heavy, localised rainfall, river flows decreased at the majority of sites, and more than half were classed as below normal or lower.
As is expected during the summer, groundwater levels continued their seasonal recessions, although some sites were lower than would be expected. Seven sites in chalk aquifers were below normal or notably low, and the Oolitic limestone in the Cotswolds was exceptionally low.
After a 6% fall, reservoir storage was 69% at the end of July, with 4 reservoirs at or below 50% full.
August
It was the driest August since 2003 in England, with just 42% of the long-term average recorded. Most of this rain fell in the final few days of the month as the remnants of Hurricane Erin reached the UK. It was the warmest summer period (June to August) since records began in 1884.
Despite the wet end to the month which helped some soil moisture deficits, soils remained much drier than average across much of England, particularly in central and north-east areas.
River flows remained low following another dry month, and the majority of sites were classed as below normal or lower. This included 4 sites which recorded their lowest August monthly mean flow on record.
Groundwater levels continued to fall as is expected during the summer months. Three sites in southern England were classed as exceptionally low, and 3 chalk aquifer sites classed as notably low.
Reservoir storage was 57% full, after a 12% decrease, and twelve sites less than 50% full.
September
September was a very different month, with slightly lower than average temperatures and much wetter conditions in England which received 149% of the long-term average rainfall. There were regional differences though, with the south-east seeing lower than average rainfall, while parts of the north-west received twice as much rain as would be expected.
These wet conditions helped decrease soil moisture deficits in many places, but preceding dry conditions meant that soils remained drier than average in central, south-east and east England.
River flows increased at almost all sites following the very wet weather, and just over half were classed as normal for the time of year.
Groundwater levels continued to fall as is typical of their early autumn recession, with ten sites classed as below normal or lower.
Despite heavy rainfall, half of reservoirs saw a decline in overall storage. However those that rose saw increases of over 10%. These were predominately reservoirs across northern England which are directly fed by inflows from upstream catchments. This meant that at the end of September England’s reservoir storage was 63%.
October
The first named storm of the season arrived at the beginning of October, but Amy’s impact was mainly felt in Scotland and Northern Ireland. England received 90% of the long-term average October rainfall, with the south-east the only part of the country receiving above average rainfall.
Soil moisture deficits decreased across England, although soils remained drier than average in east, south-east and central England.
River flows were normal at most sites, although a few sites were below normal or lower, including the Ely Ouse in east England which was exceptionally low for the time of year.
Groundwater levels continued to decline at most sites, and most chalk aquifer sites were below normal or lower.
Reservoir storage was a mixed picture, with half seeing increased storage and half continuing to fall. England as a whole had 64% of total storage, but this ranged from just 27% full in Wimbleball in south-west England, to 88% full in Vyrnwy which supplies parts of England from Wales.
November
November began being unseasonally warm and wet. The standout event in November was Storm Claudia which resulted in more than a month’s average rainfall in the space of a couple of days falling across parts of central and eastern England. England received 149% of the long-term average November rainfall, with Hull and Humber receiving 257% of their long-term average. Five hydrological areas in the East Midlands and Humberside recorded the wettest November since records began in 1871.
Soil moisture deficits have rapidly been reduced, with most areas close to average for the time of year.
River flows have generally responded to the recent rainfall returning to normal ranges for the time of year.
The Cotswolds have been wet enough to initiate groundwater recharge in its limestone aquifers however, elsewhere across many chalk aquifers, we have yet to see significant water percolated down to replenish groundwater levels in chalk.
Some parts of the country have seen significant reservoir recovery, with all reservoirs in north-east England returning to normal. For England, stocks rose by 14% during November.
December
December began with wet and mild weather for much of England, as unsettled weather dominated. Storm Bram arrived early in the month, bringing persistent rain to west and northern areas. By the middle of the month, south-west, central and north-west England had received more than three quarters of the long-term average rainfall for the month. Conditions remained drier in the east and south-east of England, and the final week of December was very dry across the whole country after high pressure settled close to the UK. England received 114% of the long term average December rainfall, with south-west England receiving 136%, and east England receiving 94%.
Soil moisture deficits diminished through most of December, and they remained around average for the time of year at the end of December.
River flows were normal or higher for December, with above normal or higher flows across most of England, while flows in east, south-east and north-east England were normal for the time of year. In east England three rivers continued to see below normal flows.
Groundwater levels continued to recover in many aquifers, with Yorkshire chalk aquifers now above normal or higher. In contrast groundwater levels in the North West Norfolk Chalk in east England and the Epsom North Downs Chalk in south-east England showed, as yet, little recovery and were below normal and exceptionally low respectively.
During December, reservoir storage increased by 7% across England, however, this masks regional differences in storage. Reservoirs in east England were generally below normal or lower, and storage in the region was 13% lower than would be expected at the end of December.
3. How the drought developed in 2025
Figure 2 shows how the drought developed across the country through the year. The first areas to declare drought were Greater Manchester, Merseyside and Cheshire Area and Cumbria and Lancashire Area in May. Yorkshire was declared as being in drought in June, followed by East and West Midlands in July.
The Environment Agency has 4 stages of drought management after normal:
- prolonged dry weather
- drought
- severe drought
- recovery
Figure 1: Conceptual diagram showing drought statuses

Source: Environment Agency
Figure 2: Map showing Environment Agency area drought stages throughout the year

Source: Environment Agency
4. Public water supply: impacts
- Water companies were granted 46 drought permits and 2 drought orders in 2025.
- Approximately 9 million people subject to a temporary use ban (TUB).
- Yorkshire Water stated that it saw a 10% reduction in household demand following its TUB implementation.
- South East Water’s Ardingly reservoir reached a minimum level of 17% of usable capacity in October.
All water companies, except Portsmouth Water activated their drought plans in 2025. The first water company to move to level 2 was United Utilities following low water levels in Haweswater Reservoir.
Over the summer the drought spread southwards and reservoir levels fell across central and southern England. A series of heatwaves also meant high demand for water over July and August.
At the end of the summer, public water supplies were very low. A significant number of reservoirs across the country were defined as exceptionally low. Even with the significant rainfall in September, some reservoirs continued to decline. The reservoirs in Yorkshire and the Pennines were particularly low at 30.3% and 29% respectively. A number of reservoirs in the south of the country were also below 40% full including Ardingly (South East Water), Clatworthy (Wessex Water) and Wimbleball (South West Water).
Figure 3: Trentabank Reservoir, Cheshire – May 2025

Source: Environment Agency
Figure 4: Chew Valley Reservoir – September 2025

Source: Environment Agency
Figure 5: Levels at reservoirs in England at the end of each month. These are classed relative to their historical operation
| Month | Exceptionally low | Notably low | Below normal | Normal | Above normal | Notably high | Exceptionally high | Total reservoirs |
|---|---|---|---|---|---|---|---|---|
| January | 0 | 2 | 3 | 14 | 8 | 1 | 3 | 31 |
| February | 0 | 2 | 5 | 15 | 7 | 0 | 2 | 31 |
| March | 1 | 3 | 6 | 18 | 1 | 2 | 0 | 31 |
| April | 1 | 7 | 6 | 14 | 1 | 2 | 0 | 31 |
| May | 7 | 4 | 10 | 8 | 1 | 1 | 0 | 31 |
| June | 4 | 11 | 9 | 4 | 3 | 0 | 0 | 31 |
| July | 6 | 9 | 9 | 6 | 0 | 1 | 0 | 31 |
| August | 13 | 7 | 6 | 4 | 1 | 0 | 0 | 31 |
| September | 8 | 3 | 11 | 7 | 2 | 0 | 0 | 31 |
| October | 6 | 6 | 11 | 8 | 0 | 0 | 0 | 31 |
| November | 1 | 9 | 6 | 14 | 0 | 0 | 1 | 31 |
| December | 1 | 2 | 8 | 16 | 4 | 0 | 0 | 31 |
Temporary use bans (TUBs)
Formerly known as ‘hosepipe bans’, a water company has the power to conserve water by imposing a TUB. The use of a hosepipe, which is banned under a TUB, can use 1000 litres an hour. This is almost 10 times what an individual generally uses in a day.
Four companies implemented TUBs:
- Yorkshire Water – implemented on 11 July, covering 5.45 million people (removed on 10 December 2025)
- South East Water – implemented on 18 July for its Kent and Sussex resource zones, covering 1.46 million people
- Thames Water – implemented on 22 July for its Swindon and Oxfordshire zone, covering 1.14 million people (removed on 27 November 2025)
- Southern Water – implemented on 21 July for Hampshire and Isle of Wight, covering around 933,000 people (removed on 31 October 2025)
New appointments and variations (NAVs) are limited companies which provide water or sewerage services to customers in a specific geographical area which were previously provided by a water company. NAVs have the same legal duties as other water companies. When NAVs provide water to their customers via bulk supplies bought from water companies, if the supplier water company implements a TUB the NAV should also. Albion Water, ESP Utilities Group, Last Mile Water, Independent Water Networks, Advanced Water Infrastructure Networks, Leep Utilities and Matrix Water are NAVs that implemented TUBs for their customers in areas aligned with the 4 water companies listed.
An initial survey by the Environment Agency, Waterwise and the Consumer Council for Water (CCW) in 2025 showed that 63% of people felt that TUBs were justified and only 17% felt that they were not.
South Staffs Water, Bristol Water and United Utilities decided to not implement TUBs, despite being at level 2 of their drought plans.
Drought permits and orders
Drought permits allow water companies to temporarily take more water from the environment or reduce releases from reservoirs that support the environment to manage supplies during a drought. They are granted by the Environment Agency. A water company can apply and be granted a drought permit but may not always implement them if the situation improves or changes. In 2025, a total of 46 drought permits were issued by the Environment Agency to 3 water companies.
Drought orders are determined by the Department for Environment, Food and Rural Affairs (Defra) Secretary of State in England or Welsh Ministers for sites in Wales. Ordinary drought orders enable a wider range of available actions than drought permits. They can allow a water company to change its own discharges and change someone else’s abstraction or discharge licence. They also allow water companies to prohibit or limit non-domestic customer uses of water under non-essential use bans. In 2025, 2 drought orders were granted to 2 water companies.
The following water company drought permits and orders were applied for in 2025:
- Yorkshire Water was granted 44 drought permits and 1 drought order in the summer
- South East Water was granted a drought permit and a drought order to support its Ardingly reservoir, and applied for a further drought order to restrict non-essential water use (24 October)
- Severn Trent Water was granted a drought permit (3 November) to help refill Carsington Reservoir
- Southern Water applied for a drought order for the River Test (included additional abstraction and non-essential use restrictions) and it withdrew the application when conditions improved
Figure 6: TUBs implemented and drought permits granted over 2025

Source: Environment Agency
Non-essential use bans
Non-essential use bans restrict uses of water by non-domestic users, such as window washing and can be applied for by a company with an ordinary drought order. No company implemented a non-essential use ban in 2025. However, 2 water companies applied for them:
- South East Water applied on 24 October (withdrawn 16 December)
- Southern Water applied on 18 July (withdrawn 3 October)
Actions taken by water companies
Water companies have mostly followed their statutory drought plans over the summer to implement actions when needed. These actions include:
- communicating with customers to explain the impacts of the drought and what they can do to save water
- implementing formal restrictions on customers such as implementing TUBs
- additional actions to reduce leakage
- optimising their sources of water and reducing outages
Some companies experienced increased leakage due to the dry weather, causing high soil moisture deficits and moving ground. Most companies reported that their customers responded well to appeals to use less water in the drought and especially in hot weather. TUBs have reduced peak demands.
Companies have undertaken some innovative communications with their customers to encourage them to use less water. United Utilities advertised at a football match to appeal to fans to reduce water use in the summer. Companies used hyper-local targeted communications to customers in areas with impacts water resources.
The Environment Agency granted 46 drought permits to 3 water companies: the highest number in one year in recent droughts.
5. Agriculture: impacts
It has been a challenging and variable year for farming. The wet end of 2024 and start to 2025 saw many fields under water impacted the growth of autumn sown crops. However, drier conditions became established during late winter and early spring. The driest March since 1961, followed by a dry April meant low river levels particularly across northern England and very dry soils. This meant that ‘hands-off flow’ (HOF) conditions in abstraction licences to safeguard other abstractors and river flows were activated early, which impacted the ability on some growers to irrigate spring crops.
Where HOF conditions were activated, some growers had to use storage reservoirs much earlier in the season to irrigate crops. This placed an increased demand on irrigation reservoirs and as the summer continued it was increasingly difficult for arable farmers to irrigate crops. Spring crops that were planted in areas that have lighter soils were significantly impacted from the dry start to spring, due their root systems being less well established and not able to find water deeper within the soil. Crops such as wheat, barley and potatoes showed early signs of water stress. Crops that did not have irrigation were also impacted from the dry spring.
With the dry weather persisting into the summer and with 4 heatwaves, irrigation reservoir stocks became significantly depleted and widespread HOF conditions on abstraction licences were activated. In East Anglia and the West Midlands, voluntary abstraction restrictions were requested where river flows were exceptionally low. To support the agriculture community, the Environment Agency’s flexible abstraction scheme was in operation to allow short term changes to abstraction licences during the dry weather. However, rain that fell in June and at the end of July helped and came just at the right time.
The harvest season started as early as July due to the dry weather. This year harvest has been challenging for growers with a high degree of variability in crop yields across the country. The Agriculture and Horticulture Development Board reported that cereal crop yields such as wheat, oats, barley are generally below the 10-year average. Wheat saw the greatest variation in yields with some areas of the country experiencing bumper yields whilst other areas had some of the worst years on recent record. The average wheat yields this year are 6.1% below the 10-year average. Root vegetable crops were also impacted with these being of poorer quality and reduced yields.
Livestock farmers also faced significant challenges from the dry conditions which led to poor grass growth during the spring and summer. Subsequently, forage stocks were in short supply, poorer quality and became more expensive over the summer. This resulted in many farmers using winter feed earlier than planned in the year and buying extra or selling animals to help with the shortage.
In August, the Addington Fund launched emergency grants to support those livestock famers most in need. There were temporary adjustments to Countryside Schemes and Sustainable Farming Incentive grazing rules which allowed early cutting or grazing of forage under the agriculture-environment schemes, to ease pressures on the forage situation. Concerns remain heading into the winter on feed availability for livestock. There are also concerns around water resilience for next year and the ability to refill irrigation reservoirs over the winter ahead of the irrigation season.
6. Environment: impacts
The drought particularly affected species dependent on rivers and wetlands. The high temperatures and lack of rain led to algal blooms and weed growth. The Environment Agency reported that dry weather environmental incidents increased particularly during August. The highest number of incidents were in the North West, West Midlands and South coast.
The prolonged dry weather and drought conditions experienced this year have caused environmental impacts across the whole of England. The West Midlands, North West, Yorkshire parts of the South coast have had the highest number of incidents recorded as being caused by drought and dry weather. In the West Midlands there were widespread low flows across catchments, an unusually high number of dry sites and a greater number of fish rescues and blue-green algae incidents. Environmental incident numbers rose steadily from April, earlier than previous years, reflecting the dry spring. The overall number of incidents attributed to drought and dry weather was notably lower than in 2022, although similar to the 2018 drought.
We have seen ecological impacts in some rivers during 2025. In particular impacts to the ecological community were observed in rivers on the eastern side of the country and in catchments where underlying groundwater levels fell very low, reducing the river baseflow. Other rivers have shown minimal signs of ecological impact, but an extended dry period would result in increased longer-term impacts, extended recovery time and a greater risk of permanent community shifts and potential local loss of species.
The low flows and extreme water temperatures experienced this year have caused:
- fish mortality in rivers and still water fisheries. Although still waters have seen less fish mortalities than previous years due to work being done with the Angling Trust on education and guidance
- increased reports of diseased and distressed fish
- restricted movement of migratory fish such as salmon, sea trout, lamprey and eels
- restricted access to nursery areas for all fish species
- high numbers of algal blooms
- unseasonably high levels of aquatic plant growth on some lowland rivers, in turn causing water quality problems and fish mortality and further blocking of fish migration
In response to these incidents we carried out the following actions:
- undertook fish rescues across the country – earlier in the year and more frequent than in a usual summer
- ran river support schemes, monitoring thresholds and ensuring others instigated these as needed
- provided advice on managing algal blooms
- advised on monitoring and mitigation of implementation for water company drought permits
Figure 7: A seine net being used to rescue fish

Source: Environment Agency
The Environment Agency applied for 5 drought orders to protect the environment:
- 2 for Holme Styes reservoir, Yorkshire (granted 28 July and 3 September)
- one for Elslack reservoir (submitted on 26 June, withdrawn in October due to improved conditions)
- one for Winterburn reservoir (submitted on 7 August, withdrawn in September due to improved conditions)
- one for Belmont reservoir (submitted on 15 August, withdrawn in September due to improved conditions)
The River Severn Regulation was operated for 86 days, starting on 9 May, to support the environment and abstractors. This scheme supports flows in the River Severn.
Figure 8: Drought orders applied for by the Environment Agency

Source: Environment Agency
Designated sites
Natural England has identified that at least 530 Sites of Special Scientific Interest (SSSIs) are vulnerable to dry weather and at least 190 internationally important sites. Natural England reported that at least 0.5 million hectares of protected sites were affected by this year’s drought. Some of the key impacts are listed here.
Wetland birds
Breeding success was significantly affected by lack of wetland habitat. For example, Shoveler Duck at Lower Derwent Valley National Nature Reserve.
Coastal
Significant impacts affecting vegetation communities, open water pools and species such as amphibians and wetland birds were seen on coastal habitats at reserves in Lincolnshire and Cumbria.
Grasslands
Saw very slow growth throughout the year. Early grass die-back recorded in North Pennines and scorched chalk grasslands in Wiltshire.
Invertebrates
The impact of the dry weather was mixed. Butterflies had a better year than 2024. It was a mixed picture for dragonflies. The ruddy darter had a poor year on Lincolnshire coastal sites.
Peatlands
The drought caused very dry peatlands. The sphagnum moss started to bleach at Chartley Moss National Nature Reserve in the West Midlands. Lower water tables and dry ditches were noted at a number of reserves.
Lakes, pools and rivers
Very low levels across multiple sites. There were observable impacts including algal blooms on Aqualate Mere National Nature Reserve, West Midlands. The Atlantic salmon streams ran dry in the River Taw in Devon and St John’s Beck in Cumbria, potentially affecting migratory routes.
Woodland
Moor House Upper Teesdale National Nature Reserve, showed early leaf browning in shallower soils. Wye National Nature Reserve, Kent showed a pre-autumn shedding of leaves, which is a typical response to drought induced stress.
Case study: Natterjack toads
Natterjack toads are a red listed species and breed in ponds. They are mainly found in the sand dunes and saltmarshes around the coasts of North-west England and Scotland. They breed in shallow, usually temporary pools of water. The drought meant that many of these ponds dried out early and with no rainfall to recharge them, the toads had a very poor breeding season. Natural England reported that in their Cumbrian reserves the toads only had a very small window of opportunity to lay their strings of eggs and that only 36 strings were recorded and only 137 toadlets were found at the end of July.
Figure 9: Natterjack toad
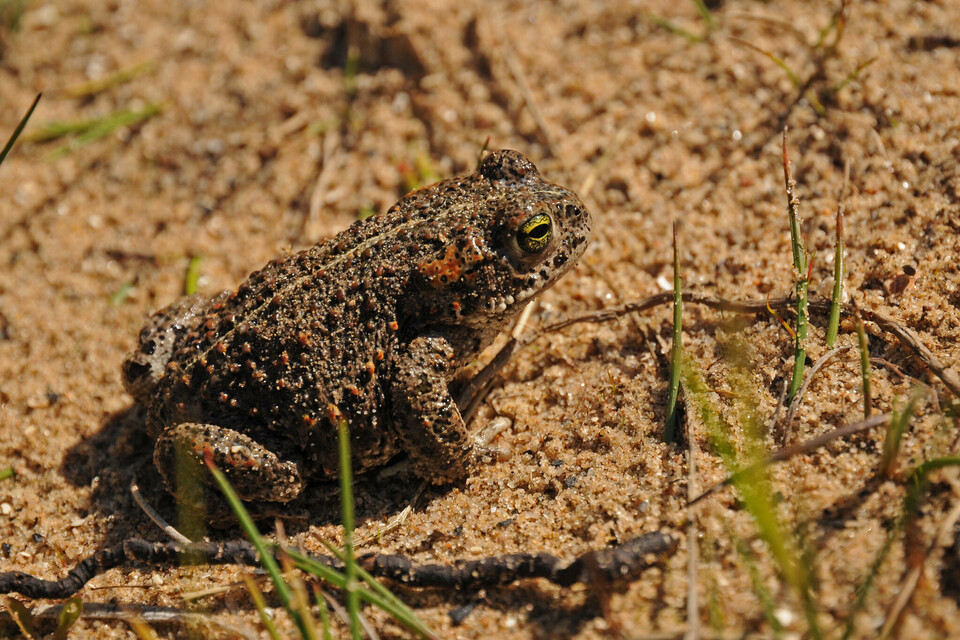
Natterjack Toad at Saltfleetby-Theddlethorpe Dunes NNR. © Natural England, Peter Roworth.
Angling
The Angling Trust reported that the impact of the dry weather on fish this year has varied both regionally and by type of water body fished. Different fish species have different tolerances to temperature and low dissolved oxygen. The levels in some lakes and reservoirs have been significantly low which has resulted in angling clubs and fishery managers took proactive action by either reducing the number of anglers or closing the fisheries to protect the fish and prevent accidents.
Figure 10: Stranded angling platform at Sutton reservoir, Cheshire – August 2025

Source: Environment Agency
Wildfires
The dry spring, followed by a hot summer with a number of heatwaves, meant that it was a record-breaking year for wildfires. By the beginning of September, fire and rescue services in England and Wales responded to 996 wildfire incidents, surpassing the 2022 total.
The Global Wildlife Information System recorded wildfires have burnt nearly 460 square kilometres in the UK. This is more than the size of the Island of Barbados.
Case Study: Langdale Moor Fire
The Langdale Moor fire in North Yorkshire was one of the most significant wildfires the UK has seen in recent years. The impact of the fire extended to an area of 25 square km (9.7 square miles). It broke out on the evening of 11 August 2025 and was declared a major incident 2 days later. The incident status was lifted on 23 September, after burning for 43 days.
Langdale Moor lies around 35 miles north-east of York and is known for its remote landscape and ecological importance. The fire affected a legally protected SSSI, which is home to rare habitats and species many of which were unable to escape the fast-moving flames. Damage to the site may take decades to recover.
Resilience of restored sites
One notable observation of the 2025 drought was that the sites that had been restored were more resilient to the weather conditions. For example, restored peat was shown to be more resilient to fire and there were fewer fires. On degraded peatlands the fire burned deeper and fiercer. Peatlands are home to our most precious wildlife, storing carbon and reducing flooding downstream. To deliver these benefits, they must be in a healthy condition but 80% of peatlands across England are dried out and deteriorating.
7. Navigation: impacts
The drought had a major impact on the canal network, canal supply reservoirs and navigable rivers. By September, 400 miles of Canal and River Trust canals were closed, approximately 20% of the network. The situation was more severe than the 2022 drought where only 15% of the network was closed. The worst affected canals in terms of restrictions and closures were, but not exclusively, in northern and central areas of England. Some of the canal reservoir supply holdings were the lowest on record with the Peak Forest and Macclesfield canal holding as low as 11.1%.
The closure, and in some cases emptying of the canals has significant impacts on those living and working by the canals as well as the wildlife and ecology. Some boaters were unable to return to their home mooring because of canal closures. Some boats were stranded after canals were closed. Some businesses such as boatyards and boat hire companies suffered significant financial losses.
The Environment Agency, as the navigational authority for the River Thames, has been managing challenging conditions in the Oxford area and balancing levels for navigation and Thames Water abstraction. Challenging navigation conditions were also experienced East Anglia where river flows were very low.
Figure 11: Near empty Canal and River Trust reservoir supplying the Macclesfield canal – Cheshire
Source: Environment Agency
Figure 12: Canal and River Trust closures and restrictions on 11 September 2025

© Canal & River Trust, © Mapbox, © OpenStreetMap
8. Energy: impacts
The energy sector has coped well with the dry weather and there have been no significant issues or concerns due to lack of water. Early on in the drought there were some concerns that some hydropower sites in the northwest might reach their hands off flow triggers in abstraction licences, which would have meant they had to stop operating. However, the rainfall in the northwest removed this risk by early summer.
9. For more national graphics
See the supporting annex of national graphics.