2024 Global Accounts of private registered providers
Published 9 January 2025
Applies to England

© Crown copyright 2025
This publication is licensed under the terms of the Open Government Licence v3.0 except where otherwise stated. To view this licence, visit nationalarchives.gov.uk/doc/open-government-licence/version/3 or write to the Information Policy Team, The National Archives, Kew, London TW9 4DU, or email: psi@nationalarchives.gov.uk.
Where we have identified any third party copyright information you will need to obtain permission from the copyright holders concerned.
This publication is available at https://www.gov.uk/government/publications/2024-global-accounts-of-private-registered-providers/2024-global-accounts-of-private-registered-providers
Executive summary
The Global Accounts cover the year up to the end of March 2024. Against a challenging backdrop, private registered providers (referred to as providers in this document) continued to invest heavily in both existing homes and new supply. The operating margin stabilised in the year. However, higher interest rates pushed up the cost of debt and record levels of capitalised repair and maintenance expenditure resulted in a decrease in the underlying surplus and a weakening of other financial performance indicators.
Despite Consumer Price Index (CPI) inflation falling in the year to March 24, rising spend on existing stock was again a key driver of the financial results. Increased spend was attributable to providers’ focus on stock decency, fire remediation, building safety and energy efficiency. In total, a record £8.8bn was spent on repairs and maintenance. This was a 13% (£1.0bn) increase on the previous year and 55% (£3.1bn) above the pre-pandemic level of £5.7bn reported in 2020.
The Bank of England (BoE) base rate increased to 5.25% in August 2023 and remained at that level for the remainder of the period covered by this publication. Debt reported on balance sheets increased by £6.1bn (7%) to £99.7bn in the year to March 2024. Nearly 80% of sector debt is held at a fixed rate, mitigating the impact of higher rates to an extent. Interest costs still increased by £0.6bn (16%) to £4.4bn and the Effective Interest Rate grew from 4.1% to 4.4%.
The Regulator of Social Housing (the regulator) uses a measure of interest cover that includes all major repairs spend as a key indicator of financial viability. This ensures that all critical spend on stock quality, safety and energy efficiency is consistently included in our assessment of a provider’s ability to service debt from core activities. Sector EBITDA MRI (earnings before interest, tax, depreciation and amortisation inclusive of capitalised major repairs) interest cover deteriorated by 15 percentage points to 88%. Cover below 100% indicates that the increased cost of servicing debt exceeds net earnings after all repairs spend is deducted. This is the first time the aggregate figure has dropped below this threshold since the 2007-2008 financial crisis.
Financial headroom and capacity to absorb downside risk is reduced across the sector. Some of the largest organisations are reporting relatively low levels of interest cover and weaker metrics. This is particularly true for those operating in London and other urban areas with significant levels of investment in safety and quality works. The regulator will continue to engage with providers where we have concerns over financial viability and covenant positions.
The sector’s operating margin (excluding fixed asset sales), although remaining at historically low levels, increased slightly in the year to 17%. This was attributable to the surplus realised on Social Housing Lettings (SHL), which increased by £0.4bn (11%) to £4.2bn. In 2023 high inflation in the year exerted pressure on core costs, whilst rent increases were limited to 4.1% (based on September 2021 CPI of 3.1%). Although CPI Inflation fell in 2024, falling from 8.7% in April 2023 to 3.2% in March 2024, the extent to which the operating margin on SHL recovered was limited by the capping of rent increases at 7% (September 2022 CPI inflation was 10.1%).
Many providers also develop properties for sale. These may be low-cost home ownership (LCHO) units, where a proportion of the property is sold as a first tranche, or units developed for outright sale at market values. The income and surplus on first tranche sales is stable, contributing £0.4bn towards the overall operating surplus. In contrast, receipts from market sale were down almost 50% on 2023 levels. The contribution from market sale was just £43m, equivalent to 1% of the sector’s operating surplus and by far the lowest level on record since we started collecting consolidated financial data in 2015.
Despite the financial pressures, investment in new supply increased in the year. Development spend across all tenures was £15.0bn for the year, a 10% increase on the £13.7bn reported in 2023 and greater than the previous pre-pandemic peak. The increase was partially attributable to higher construction costs with the number of new social homes delivered increasing by just 3% to 54,000. The value of properties under construction also increased by 7% to £15.6bn.
The sector continues to demonstrate robust liquidity in aggregate and was able to raise the funds required to support investment in new and existing supply. Including refinancing, the sector agreed new facilities of £12.5bn in the year and reported undrawn facilities of £29.9bn in March 2024. However, weaker performance and high levels of investment are impacting on the level of cash and short-term investments held by the sector which decreased for the third year in a row to £5.5bn.
The sale of properties held for rent is classified in financial statements as a fixed asset sale. The profit recognised on this type of disposal decreased by £0.2bn to £1.0bn in 2024. This decrease was driven by reduced levels of sales to existing tenants, either through the Right to Buy (RTB) and Right to Acquire (RTA) schemes or through staircasing sales to shared owners. In contrast, the sales of social housing properties remained at a consistent level, this includes bulk and strategic disposals to other registered providers.
The sector forecasts summarised in the annex show an increase in the projected receipts generated through such bulk disposals and transfers. The regulator will continue to monitor the financial viability of providers where such sales are required in mitigation of financial pressures. It is essential that providers understand the associated risks of such a strategy, both financial and reputational.
The forecasts also illustrate the trade-off between maintaining financial resilience and investment in new and existing supply. Projected spend on repairs and maintenance has increased by 11% on last year’s plans and is now equivalent to £10bn per annum over the next five years. Investment in existing stock continues to drive weaker financial performance and has resulted in many providers scaling back their development ambitions. The total number of homes forecast to be completed in the first five years has fallen by 42,000 units (12%) to 292,000.
In response to reduced financial capacity, a challenging operating environment and the level of economic uncertainty we expect providers to continue to adapt plans appropriately. It is vital they continue to manage their resources and risks effectively to ensure that their financial viability is maintained, and that they remain capable of delivering effective services and their responsibilities to tenants.
1. Introduction
1.1 - The 2024 Global Accounts of registered providers (Global Accounts) provides a financial overview of the social housing sector based on an analysis of the regulatory returns of private registered providers (providers). The publication does not include any financial data relating to social housing stock held by local authorities.
1.2 - In total, there are around 1,400 providers on our Register, of which the majority have fewer than 1,000 homes. This publication is concerned with the financial analysis of 200 large provider groups which own or manage at least 1,000 social homes, together representing more than 96% of the sector’s stock. The underlying dataset used to produce the Global Accounts is subject to change as the number of providers above or below the 1,000 homes cut-off changes each year.
1.3 - The provision of homes for rent is the main activity of the sector. Many providers also generate income from the sale of homes, either on a shared ownership basis or through outright sale at market value. This activity exposes providers to a different risk profile to that of traditional renting and has changed the financial profile of several providers.
1.4 - Most large providers are part of a group structure; these can include multiple registered providers and non-registered entities. The development of properties for outright sale and other non-social housing activity is often delivered by non-registered entities or joint ventures within group structures. This leads to differences between the accounts prepared by registered entities (entity level) and those prepared on a consolidated group basis (consolidated level). This publication presents both sets of results.
1.5 - Further differences exist between providers. While most providers have some supported housing or housing for older people, there is a small but significant number of primarily specialist providers. A small sub-set of supported housing providers operate a lease-based business model.
1.6 - The vast majority of providers are designated as not-for-profit. The Global Accounts dataset includes the results of seven for-profit providers which hold more than 1,000 homes. Together these currently comprise a very small but growing part of the sector.
1.7 - A financial review of the 2023/24 Global Accounts is presented in Part 2 of this document. Part 3 comprises the aggregate financial statements. Part 4 contains notes to the primary statements showing further detail of key entries and balances.
1.8 - The annex includes an analysis of providers’ latest financial forecasts. This compares aggregate current projections and business plans against those submitted in previous years.
2. Financial review
Operating environment
2.1 - During the period covered by the Global Accounts the operating environment remained challenging, and the macroeconomic context continued to impact on financial performance.
2.2 - Annual maximum rent increases for the reporting period covered would normally have been determined by the September 2022 CPI of 10.1%, plus 1%. However, in response to exceptionally high inflation levels and following a consultation, the Government directed us to set a standard which applied a ceiling on the maximum permissible rent increase for existing tenants of 7% for the period between 1 April 2023 and 31 March 2024[footnote 1]. This applied to general needs Social Rent and Affordable Rent homes but excluded supported housing.
2.3 - In October 2023, shared ownership rents reform was introduced which would allow rents for new shared owners to be increased once a year by up to CPI + 1%. Prior to this, shared ownership rents increased once a year by the RPI + 0.5%[footnote 2].
2.4 - Having reached a peak of 11.1% in October 2022 in the previous financial year, CPI inflation fell from 8.7% in April 2023 to 3.2% in March 2024. The lag between permitted. rent increases of 7% and falling inflation in the year is reflected in the financial results.
2.5 - To bring down the level of inflation, the Bank of England (BoE) increased interest rates on three consecutive occasions during the year. The base rate increased from 4.25% in April 2023, reaching 5.25% by August, the highest since April 2008, where it remained for the rest of the period covered by this publication.
2.6 - Mortgage interest rates fluctuated during the reporting period and the average interest rate for a typical 5-year mortgage stood at 4.53% at the end of March 2024[footnote 3] after peaking at 5.71% in July 2023. Monthly mortgage approvals for house purchases decreased in the year to 51,700 from an average of 56,200 during 2023[footnote 4].
2.7 - England saw average house prices increase by 1.0% in the 12 months to March 2024[footnote 5], however there were notable regional variations in housing market performance. Yorkshire and the Humber was the fastest growing region with annual growth of 5.0%, whilst London saw prices decrease by 3.4%.
2.8 - The financial results demonstrate significant levels of investment in the quality, safety and energy efficiency of existing stock. To facilitate the installation of energy performance measures in social homes in England the Government announced funding allocations of £778m for the second wave of the Social Housing Decarbonisation Fund (SHDF) on 22 March 2023.
2.9 - Quarterly, the regulator publishes a Fire Remediation survey to report progress on remediating fire safety issues in buildings that measure more than 11 metres high or that have 5 or more storeys. Data from the survey relates to landlords’ obligations under the Fire Safety (Regulatory) Order 2005 for assessing fire safety risks, the percentage of buildings with a fire risk assessment along with progress in remediating identified defects and the risks identified in relation to external wall systems. The Building Safety Fund (BSF) and the Cladding Safety Scheme (CSS)[footnote 6] are available to registered providers to fix fire safety problems with external cladding for buildings over 11 metres, up to the value which providers would otherwise be entitled to pass on to leaseholders.
2.10 - Across the UK, average construction costs on new properties increased by 2.2%[footnote 7] over the 12-month period to 31 March 2024 (March 2023 10.3%). In the same period housing repair and maintenance costs increased by 1.5% whilst overall construction material prices fell by 2%[footnote 8].
2.11 - On average, monthly construction output for all works in the year to March 2024 was 1% higher than in the year to March 2023. This comprised of a 9% increase in repair and maintenance works, partially offset by a 4% reduction in new works[footnote 9]. According to Energy Performance Certificate (EPC) data there were 232,470 new homes completed in the 12 months to March 2024, a 6% reduction compared to the previous year[footnote 10].
2.12 - The number of people on Universal Credit was 5.7 million at March 2024[footnote 11], an increase from the figures reported for March 2023 of 5.1 million. The number of households on Universal Credit in England claiming housing entitlement with a social rented landlord increased from 1.4 million in March 2023[footnote 12] to 1.6 million in March 2024. This reflects the Universal Credit migration roll-out. Under the latest plans the migration of the final group of legacy benefit claimants is deferred until 2028/29[footnote 13].
2.13 - In the period following the Global Accounts inflation fell further, moving towards the BoE’s 2% target. The base rate has also been reduced twice, to stand at 4.75% in November 2024. However, the trajectory of interest rates remains uncertain. Constrained financial headroom reduces the capacity for the sector to manage downside risk. The regulator expects providers to be able to demonstrate resilience against future macroeconomic shocks.
2.14 - Commencing 1 April 2024, the regulator introduced new consumer standards, the biggest changes to social housing regulation in over a decade. These standards apply to all social landlords, including councils and housing associations[footnote 14]. Expectations around stock decency, decarbonisation and provision of new homes will continue to evolve. Whilst financial headroom is reduced, providers will need real skill and judgement to ensure their organisations continue delivering for current and future tenants.
Financial highlights
The reported and underlying surplus
2.15 - Based on the consolidated financial statements, the surplus reported in 2024 of £2.3bn was a £2.0bn (46%) decrease on the £4.3bn reported in 2023. As can be seen from the figure below, the reported surplus fluctuates year-on-year as a result of movements in fair value. This is particularly true in the consolidated financial statements which often include fair value gains from group merger activity.
Figure 1: Factors impacting the reported surplus (consolidated)
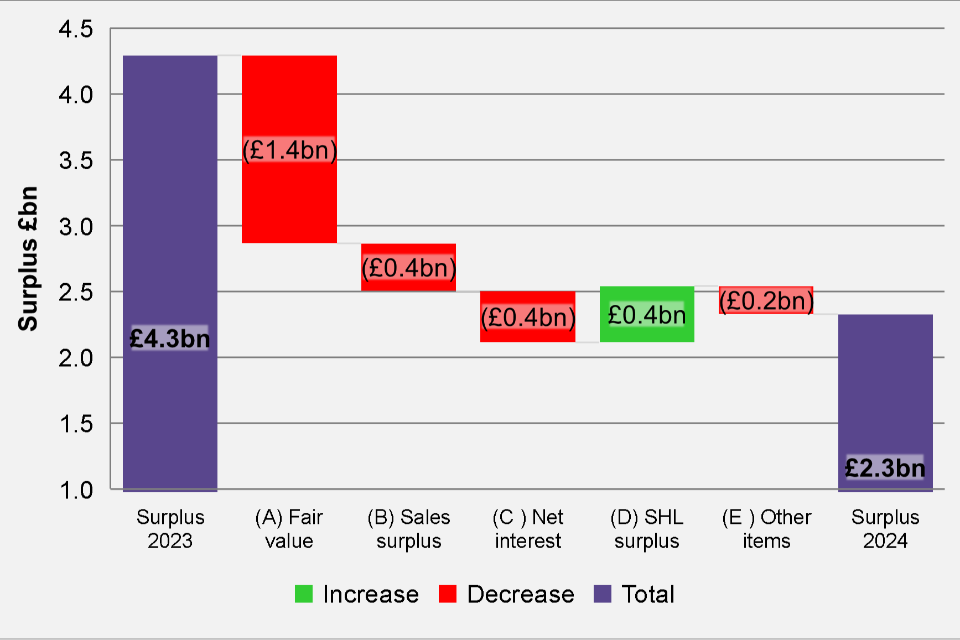
| Surplus 2023 (£bn) | 4.294 |
| (A) Fair value (£bn) | (1.428) |
| (B) Sales surplus (£bn) | (0.362) |
| (C ) Net interest (£bn) | (0.391) |
| (D) SHL surplus (£bn) | 0.428 |
| (E ) Other items (£bn) | (0.214) |
| Surplus 2024 (£bn) | 2.328 |
2.16 - Each of the key drivers behind the movements in the reported surplus in 2024 are examined in turn overleaf.
2.17 - (A) Fair value gains were £1.4bn less than in 2023:
-
In 2024 there were three business combinations over £100m (mergers accounted for using the business combination method), which represent almost 87% of the £0.9bn total gain on business combinations. In comparison, in 2023 there were fair value gains of £2bn, with one large merger accounting for the majority of the gain.
-
Other non-cash items reported in the surplus include movements in the fair values of investment properties and financial instruments. In total the sector reported a net loss on these items of £0.2bn, compared to a gain of £0.2bn in 2023.
2.18 - (B) A decrease in the surplus recognised on sales of £0.4bn:
-
Surplus from current asset sales declined by £0.2bn, mainly as a result of outright sales dropping off while LCHO first tranche sales performance remained stable.
-
The surplus from fixed asset sales (properties held for rent) decreased by £0.2bn. This was due to a £0.3bn (44%) decline in the surpluses recognised from staircasing by shared owners and from Right to Buy / Right to Acquire (RTB/RTA) sales to tenants.
2.19 - (C) The increase in the base interest rate from 4.25% to 5.25% during the year led to an increase in net interest costs, which rose by £0.4bn to £3.6bn, 12% higher than in 2023.
-
Interest payable increased to £3.9bn, from £3.4bn, with the vast majority of providers experiencing increased costs.
-
This was partially offset by a £0.1bn increase in interest receivable, from £0.2bn in 2023 to £0.3bn in 2024.
-
The effective interest rate[footnote 15] increased from 4.1% to 4.4%.
2.20 - (D) There was an increase in the surplus on Social Housing Lettings of £0.4bn. This was partially driven by an increase in the number of units but also reflects a slight increase in the margin on this core activity.
-
Net rents increased by 8% on a per unit basis, partially driven by the 7% permitted rent increase in the year, together with an increase in new units and properties being re-let throughout the year.
-
As inflation peaked at 8.7% in April and gradually fell to 3.2% by the end of the year, SHL costs increased on average by 7% per unit.
2.21 - (E) Other net movements year-on-year contributed towards a further £0.2bn increase in the reported surplus. Other items include the share of operating surpluses from joint ventures (JVs), other non-SHL social and non-social housing activities and corporation tax. One provider reported a £0.1bn loss relating to building safety liabilities as an exceptional item.
2.22 - Excluding ‘non-cash’ fair value gains and losses (A) the underlying surplus generated by the sector decreased from £2.2bn in 2023 to £1.6bn in 2024.
Figure 2: Underlying surplus excluding movements in fair value (consolidated)

| 2020 | 2021 | 2022 | 2023 | 2024 | |
|---|---|---|---|---|---|
| Operating surplus (£bn) | 4.7 | 4.9 | 4.4 | 4.0 | 4.3 |
| Surplus on the sale of fixed assets (£bn) | 1.0 | 0.9 | 1.2 | 1.2 | 1.0 |
| Net interest (£bn) | (3.1) | (3.3) | (3.2) | (3.2) | (3.6) |
| Other (£bn) | 0.1 | 0.1 | 0.0 | 0.1 | (0.1) |
| Underlying surplus (£bn) | 2.7 | 2.6 | 2.4 | 2.2 | 1.6 |
2.23 - Since we started collecting data on gains and losses from business combinations in 2018, the underlying surplus has deteriorated year-on-year from more than £3.6bn to its current level.
Spend on existing stock
2.24 - The underlying surplus reported above is after recognition of revenue repair and maintenance costs on existing stock of £5.5bn (2023: £5.0bn). In addition to this spend a further £3.3bn (2023: £2.8bn) of major repairs works were capitalised in the year bringing the total spend on existing stock to a record of £8.8bn (2023: £7.7bn) the third consecutive year of record spend, 13% more than the previous year and 55% (£3.1bn) above the pre-pandemic level of £5.7bn reported in 2020.
Figure 3: Total major repairs and maintenance spend (consolidated)

| 2020 | 2021 | 2022 | 2023 | 2024 | |
|---|---|---|---|---|---|
| Maintenance (£bn) | 3.2 | 3.3 | 3.7 | 4.3 | 4.7 |
| Major repairs (£bn) | 0.5 | 0.5 | 0.6 | 0.7 | 0.8 |
| Capitalised major repairs (£bn) | 1.9 | 1.6 | 2.2 | 2.8 | 3.3 |
| Total (£bn) | 5.7 | 5.4 | 6.5 | 7.7 | 8.8 |
2.25 - Repairs and maintenance expenditure recognised in the Statement of Comprehensive Income (SOCI) of £5.5bn was the highest spend on record. Throughout the year providers continued to report higher volumes of responsive repairs driven by the management of damp and mould issues, compliance repairs, and catch-up works. The backlog mainly related to larger repair programmes being postponed due to responsive repairs taking priority. Increased spend on void properties was also reported to reduce the backlog of vacant homes[footnote 16].
2.26 - Capitalised major repairs (those which add to the reporting value of the asset) increased by 18% to £3.3bn (2023: £2.8bn), also the highest level recorded to date. The main drivers of this increase relate to fire remediation, building safety and investment works, as providers continue to implement building safety and energy efficiency measures.
2.27 - During the reporting period a number of providers also commenced works to improve the energy efficiency of existing homes. The Department for Energy Security and Net Zero announced the successful bids from wave 2.1 of the Social Housing Decarbonisation Fund[footnote 17], which included over £300m for providers, with all grant funding to be claimed by 31 March 2025.
2.28 - Latest business plans show that investment in existing stock is set to continue to increase, with an average annual spend of £10bn per annum on repairs and maintenance over the next five years (see annex).
Investment in new supply
2.29 - Investment in new supply totalled £15.0bn for the year; the highest amount recorded since comparable data was first collected in 2019 and 10% higher than the £13.7bn reported in 2023. The total includes the development and acquisition of social housing properties, properties developed for sale, and investment properties.
Figure 4: Investment in new supply (consolidated)

| 2020 | 2021 | 2022 | 2023 | 2024 | |
|---|---|---|---|---|---|
| New Social Housing (inc. rental element of shared ownership) (£bn) | 10.2 | 7.9 | 9.2 | 10.2 | 11.9 |
| Other Housing (£bn) | 3.5 | 3.0 | 3.1 | 3.4 | 3.1 |
| Total (£bn) | 13.7 | 10.9 | 12.3 | 13.7 | 15.0 |
2.30 - A total of £11.9bn was invested in new social housing properties for rent (including the rental element of shared ownership properties), an increase of 17% compared to 2023. This partially reflects the impact of inflation and interest rates on development costs. The number of new units delivered during the year increased by just 3%, with a total of 54,000 completions compared to the 53,000 units delivered in 2023. The value of properties under construction at the year-end increased by 7% (£1.0bn) to £15.6bn. Net of demolitions and disposals, the total number of social homes owned by providers increased by 1% to 2,858,000.
-
In addition to the £11.9bn invested in social housing properties for rent, providers spent a further £3.1bn on the supply of properties developed for sale and units classified as investment properties. In 2024, estimated[footnote 18] spend on properties developed for outright sale and the expected first tranche element of shared ownership properties was £2.5bn (2023: £3.0bn).
-
The categorisation of fixed assets as investment properties has historically been restricted to properties held for market rent and other units held primarily for non-social housing purposes. However, in recent years this category has also been used by a small number of for-profit providers to record social housing properties. Total additions to investment properties over the year amounted to £0.6bn (2023: £0.4bn); 70% of which (£0.4bn) related to social housing asset additions by for-profit providers.
2.31 - The financial statements show that capital expenditure that has been approved by directors but is not yet in contract has reduced for a second consecutive year. The amount reported fell from £18.3bn in March 2023 to £17.1bn in March 2024, the lowest amount in six years. Latest business plans also show a 12% reduction in the number of units being delivered over the next five years in comparison to 2023 forecasts (see annex).
2.32 - Whilst record levels of investment in new supply have been recorded this year, the impacts of inflation, contractor insolvency and higher interest rates have made the development of new housing a much more challenging activity than in the recent past. Although cost increases have begun to stabilise, many providers will have previously been protected by fixed-price contracts and will only see the full impact of cost increases when new works are procured, or in a growing number of cases, if a contractor becomes insolvent.
2.33 - With continuing pressure to improve the quality of existing stock, a number of providers have indicated that they will be reducing their development targets in order to prioritise investment in existing homes.
Housing assets
2.34 - With record levels of investment in both new and existing stock over the year, the total value of housing assets held by the sector increased by £11.3bn (5.7%) to reach £207.8bn. This includes both completed properties and properties under construction.
Figure 5: Housing asset value (consolidated)

| 2020 | 2021 | 2022 | 2023 | 2024 | |
|---|---|---|---|---|---|
| Tangible fixed assets: Housing properties at cost (Current period) (£bn) | 158.0 | 164.4 | 171.4 | 181.8 | 192.2 |
| Tangible fixed assets: Housing properties at valuation (Current period) (£bn) | 2.3 | 1.7 | 1.9 | 1.3 | 1.4 |
| Social housing properties (£bn) | 160.3 | 166.1 | 173.3 | 183.1 | 193.6 |
| Investment properties (Current period) (£bn) | 6.7 | 6.9 | 7.4 | 7.3 | 8.3 |
| Properties held for sale (Current period) (£bn) | 7.4 | 7.1 | 6.4 | 6.0 | 5.9 |
| Total (£bn) | 174.4 | 180.0 | 187.1 | 196.5 | 207.8 |
2.35 - The net book value of social housing properties increased by 5.7% (£10.4bn) to £193.6bn. This includes £15.6bn worth of properties under construction; equal to 8% of the total.
2.36 - The value of investment properties increased to £8.3bn, of which £0.2bn (2%) relates to properties under construction. This category consists primarily of properties held for market rent, student accommodation and commercial property, and as noted in 2.30 above, now includes an element of social housing assets.
2.37 - The value of properties held for sale reduced by 2% (£0.1bn) to £5.9bn; of which £4.6bn (77%) related to land and properties under construction and £1.3bn (23%) related to completed properties.
Debt and funding
2.38 - The growth in housing assets detailed in the preceding sections is much greater than the increase in debt and new grant, highlighting the extent to which internally generated funds are reinvested into stock. The value of housing assets reported in the Statement of Financial Position (SOFP) increased by £11.3bn. In comparison, the net increase in debt was £6.1bn and a total of £2.6bn worth of new grant was received.
2.39 - Although reinvestment of reserves into new and existing stock remains a key funding method for the sector, record levels of capital investment, combined with lower overall surpluses to reinvest, has resulted in additional debt being required to fund capital expenditure. This is reflected both in terms of the overall nominal value of debt and on a debt-per-unit basis. The sector’s indebtedness metrics (table 1 below) show the impact of this. While debt has increased by 6.5%, the balance sheet value of housing assets has increased by only 5.7%, resulting in an increase in gearing. Likewise, turnover (excluding capital grants) has increased by just 3.7%, giving a higher debt to turnover ratio of 4.1. Debt per unit has increased by 5% to £34.3k.
Table 1: Indebtedness metrics
| Consolidated | Entity | |||
|---|---|---|---|---|
| Metric | 2024 | 2023 | 2024 | 2023 |
| Gearing (debt as % of social housing assets) | 52% | 51% | 52% | 51% |
| Debt to turnover (as a multiple) | 4.1 | 3.9 | 4.3 | 4.3 |
| Debt per unit (£ per social housing unit) | 34,344 | 32,635 | 33,918 | 31,996 |
2.40 - Data from the March 2024 Quarterly Survey[footnote 19] showed that during the year, including refinancing, the sector agreed new facilities of £12.5bn, with undrawn facilities of £29.9bn remaining available at the end of the year (March 2023: £30.3bn). As at March 2024, 78% of drawn debt was held at a fixed rate (March 2023: 79%), with 56% being held at a rate fixed for 10 years or more.
Figure 6: Total debt (consolidated)

| 2020 | 2021 | 2022 | 2023 | 2024 | |
|---|---|---|---|---|---|
| Debt (£bn) | 83.1 | 86.3 | 89.2 | 93.7 | 99.7 |
| Debt to Turnover (as a multiple) | 4.0 | 4.0 | 4.0 | 3.9 | 4.1 |
2.41 - The total value of drawn facilities reached £99.7bn at the end of March; a £6.1bn net increase since 2023. Levels of cash and short-term investments held by providers reduced by 12% to £5.5bn (2023: £6.3bn); the lowest level since consolidated data was first collected in 2015.
2.42 - Overall levels of liquidity remain robust within the sector, and it remains a viable and attractive proposition for lenders. However, increasing costs of borrowing and weaker cash generation means that capacity and appetite to increase debt is constrained. The regulator continues to review each provider’s Quarterly Survey and will engage with providers where indicators identify short-term liquidity issues.
Financial performance
Interest Cover
2.43 - A key indicator of sector viability is providers’ ability to cover ongoing finance costs from operating activity. The interest cover measure used by the regulator includes all major repairs spend. This ensures a consistent comparison of performance across providers, regardless of capitalisation policies.
Figure 7: EBITDA MRI interest cover (consolidated)

| 2020 | 2021 | 2022 | 2023 | 2024 | |
|---|---|---|---|---|---|
| EBITDA MRI Interest Cover | 138% | 151% | 128% | 103% | 88% |
| EBITDA MRI IC Adj. for Breakage Costs | 143% | 166% | 136.9% | 104.8% | 88.5% |
| Maintenance & Major Repairs Spend (£bn) | 5.7 | 5.4 | 6.5 | 7.7 | 8.8 |
| Total Interest (£bn) | 3.7 | 3.8 | 3.7 | 3.8 | 4.4 |
2.44 - Aggregate EBITDA MRI interest cover has been deteriorating for several years. Since the pandemic the main driver had been increased spend on repairs and maintenance (impacting the top-half of the interest cover metric). This pressure is evident again in 2024, a £1.0bn (13%) increase in spend on existing stock has resulted in aggregate EBITDA MRI margin falling to below 16%.
Table 2: Interest cover metrics
| Consolidated | Entity | |||
|---|---|---|---|---|
| % (unless otherwise stated) | 2024 | 2023 | 2024 | 2023 |
| EBITDA MRI interest cover | 88% | 103% | 93% | 107% |
| EBITDA MRI interest cover SHL | 87% | 97% | 91% | 100% |
| EBITDA MRI margin | 15.8% | 16.5% | 18.0% | 19.4% |
| Debt to turnover (as a multiple) | 4.1 | 3.9 | 4.3 | 4.3 |
| Effective interest rate (EIR) | 4.4% | 4.1% | 4.6% | 4.2% |
| EIR (excluding breakage costs) | 4.4% | 4.0% | 4.5% | 4.1% |
2.45 - In contrast to previous years, the deterioration in aggregate interest cover in 2024 is also a result of an increase in interest costs (the bottom-half of the interest cover metric). Total interest costs increased by £0.6bn (16%) and the aggregate effective interest rate increased from 4.1% to 4.4%.
2.46 - Sector EBITDA MRI interest cover below 100% indicates that the cost of servicing debt exceeds net earnings after all repairs spend is deducted. This is the first time the aggregate figure has dropped below this threshold since the 2007-2008 financial crisis. However, the low level of cover reported then was partially attributable to the number of providers undertaking stock improvement programmes following stock transfers.
2.47 - Interest cover performance does vary across the sector. In 2024 34% of providers reported interest cover of below 100% (2023: 30%, 2022: 23%).
Figure 8: EBITDA MRI Interest Cover by band (consolidated)

| Number of providers | 2022 | 2023 | 2024 |
|---|---|---|---|
| Less than 50% | 18 | 26 | 36 |
| Between 50% and 100% | 29 | 34 | 32 |
| Between 100% and 150% | 59 | 76 | 74 |
| Between 150% and 200% | 48 | 31 | 30 |
| Greater than 200% | 48 | 32 | 24 |
2.48 -. The 17 largest providers (all with more than 40k social units), as a cohort, have the lowest level of reported EBITDA MRI interest cover in 2024 at 73%. This cohort of large providers also report high levels of spend on repairs and maintenance, particularly those organisations with significant levels of stock in the London area.
2.49 - The regulator will continue to use the EBITDA MRI version of interest cover as an indicator of financial viability. Capitalised major repairs costs relate to catch-up spend on backlog works from the pandemic, fire-safety activity and commitments to improving stock quality. This expenditure is critical in maintaining homes to meet statutory and regulatory requirements and enabling providers to achieve their objectives.
2.50 - An additional disclosure in the regulatory returns this year reports the grant income associated with capitalised major repairs works. In total, the sector reported capitalised grant of £122m in 2024 (2023: £59m). Including this in income would increase sector aggregate EBITDA MRI interest cover to 91%.
2.51 - Most providers have an interest cover loan covenant, with limits typically between 110% and 125%, which may be calculated on a different basis to our headline EBITDA MRI metric. For example, covenants may exclude certain expenditure or factor in non-operating income such as fixed asset sales. Frequently, lender covenants may exclude elements of major repair spend, particularly where they relate to exceptional costs. Where this is not the case many providers have sought waivers from lenders to exclude specific components of expenditure from covenant calculations. If we exclude the total capitalised repairs spend of £3.3bn from the calculation, then interest cover would be 162% (2023: 176%) on an EBITDA only basis. However, due to the essential nature and amount of spend on capitalised repairs, it is not possible to take an aggregate view on interest cover with such spend excluded from the calculation.
2.52 - The recent regulatory judgements published by the regulator reflect the impact of broader financial pressures currently faced by providers. With investment in existing stock at record levels and interest rates remaining raised, the sector is evidently in a weaker financial position than it has been in the recent past. Many providers face difficult decisions, balancing reduced financial headroom and less capacity to absorb downside risk with continued investment in new homes.
Operating activity
2.53 - Turnover from Social Housing Lettings (SHL) increased by £1.6bn (9%). SHL income now accounts for 77% of total turnover (73% in 2023). In contrast, receipts from outright market sales dropped by £0.8bn (48%) to £0.9bn, by far the lowest level since we started collecting group consolidated financial data, including activity in non-registered entities in group structures, in 2015.
Figure 9: Breakdown of turnover (consolidated)

| 2020 | 2021 | 2022 | 2023 | 2024 | |
|---|---|---|---|---|---|
| Social Housing Lettings (£bn) | 15.7 | 16.1 | 16.5 | 17.7 | 19.3 |
| LCHO 1st tranche (£bn) | 1.6 | 1.6 | 2.0 | 2.1 | 2.0 |
| Properties developed for sale (£bn) | 1.6 | 1.9 | 1.7 | 1.8 | 0.9 |
| Other activities (£bn) | 2.4 | 2.4 | 2.5 | 2.7 | 2.9 |
| Total (£bn) | 21.2 | 22.1 | 22.8 | 24.3 | 25.1 |
2.54 - The operating surplus (excluding fixed asset sales) increased by £0.2bn to £4.3bn. This was almost entirely attributable to a £0.4bn increase in the surplus from SHL activity, partially offset by a reduction in the surplus from outright sale. The contribution from other activities, including 1st tranche LCHO sales, remained stable.
Table 3: Margins
| Consolidated | Entity | |||
|---|---|---|---|---|
| % | 2024 | 2023 | 2024 | 2023 |
| Operating margin | 16.9% | 16.6% | 17.7% | 18.2% |
| Operating margin on social housing lettings | 21.8% | 21.4% | 21.3% | 21.2% |
| Operating margin on 1st tranche sales | 17.9% | 18.1% | 17.0% | 17.4% |
| Operating margin on outright sale | 4.6% | 10.6% | 1.4% | 3.5% |
| Operating margin on other activities (excluding gift aid) | (12.3%) | (11.7%) | (21.6%) | (15.9%) |
2.55 - The increase in margin on the sector’s core activity (SHL) has resulted in a slight up-tick in the overall operating margin based on consolidated returns. Despite the slight improvement in the year, the operating margin remains historically low; 2023 was the first year that it had fallen below 17% since 2009.
2.56 - The total impairment charge recognised by providers was £317m in 2024 (2023: £312m). An impairment loss is normally recognised in operating expenditure against the associated activity. Of the impairment figure reported in 2024, £92m related to SHL with the balance allocated to other social and non-social activities.
2.57 - Impairment charges recognised in the year mainly related to fire safety and building remediation works, contractor insolvencies and regeneration plans to demolish properties. Five providers reported total impairment charges of over £20m each, accounting for over 50% of the total charge reported in the year.
Social Housing lettings
2.58 - The operating surplus on SHL increased by £0.4bn to £4.2bn. Turnover increased by £1.6bn (9%) to reach £19.3bn. The majority of SHL income (£16.5bn) is from rent. For the year ending March 2024 permitted rent increases for general needs Social Rent and Affordable Rent tenancies were capped at 7%. On a per-unit basis, rent increased by 8%. The higher increase in average rent per unit is driven by the addition of new units and properties being re-let throughout the year.
2.59 - As annual permitted rent increases are based on the published CPI figure for the previous September, there can be a mismatch between increases in income and increases in costs; something that becomes more apparent in periods of economic volatility. During the period covered by this publication, 12-month CPI inflation fell from 8.7% in April 2023 to 3.2% in March 2024. This contributed to SHL expenditure increasing by 7% on a per-unit basis. This contrasts with the previous year where inflation significantly outstripped the permitted rent increase. In 2023-24 total SHL expenditure grew by £1.2bn (9%) to £15.1bn.
2.60 - Capping rent increases at 7% for the year largely offset the impact of falling CPI inflation over the 12-month period covered by the Global Accounts. The operating margin on SHL grew only slightly from 21.4% in 2023 to 21.8% in 2024.
Figure 10: Social housing lettings income and expenditure growth (consolidated)

| 2020 | 2021 | 2022 | 2023 | 2024 | |
|---|---|---|---|---|---|
| % Growth in Expenditure | 5.2% | 2.3% | 6.9% | 12.4% | 8.6% |
| % Growth in Turnover | 1.4% | 3.0% | 2.4% | 6.9% | 9.2% |
| Margin | 27.8% | 28.4% | 25.3% | 21.4% | 21.8% |
2.61 - Repairs and maintenance spend, recognised in operating expenditure, increased by £0.5bn (11%) to £5.5bn. The main factors placing upward pressure on repairs and maintenance costs are covered elsewhere in this publication.
2.62 - Management costs also increased by £0.2bn (7%) to £3.7bn. In total, 77% of providers reported an increase in management costs relative to 2023, predominantly due to inflationary pressures impacting utilities, insurance costs and staff salary increases.
2.63 - Service charges to tenants increased by £0.3bn (16%) to £2.0bn and the corresponding expenditure increased by £0.3bn (13%) to £2.6bn. Increases in service charge expenditure are widespread, reflecting higher costs for labour, materials and building maintenance. Providers with a significant presence in the care and support sector tend to have relatively higher service charge costs and reported the greatest level of increase year-on-year.
2.64 - Void losses, current tenant arrears and the level of bad debts reported are key performance indicators in assessing the efficiency of letting and rent collection.
Table 4: Indicators of operating performance
| Consolidated | Entity | |||
|---|---|---|---|---|
| % of gross rent | 2024 | 2023 | 2024 | 2023 |
| Rent loss from voids | 1.9% | 1.9% | 1.9% | 1.9% |
| Bad debts for the year | 0.6% | 0.7% | 0.6% | 0.7% |
| Current tenant arrears | 5.3% | 5.3% | 5.2% | 5.3% |
2.65 - Measured as a percentage of gross rent, relative to the previous year, all three indicators are broadly stable. Levels of bad debts and arrears reduced slightly.
2.66 - However, rent losses from voids and arrears remain raised relative to levels reported prior to the pandemic. For the 12 months up to March 2020 rent loss from voids was 1.5% and current tenant arrears were 4.9%.
2.67 - The highest levels of voids continue to be experienced by providers with a large proportion of supported housing units, care home units or housing for older people. Providers also reported higher than anticipated repairs causing a backlog of works, impacting void turnaround times in their Quarterly Survey submission for Q4 2023/24. The majority of property works relate to damp and mould, building safety and other larger repairs works. In addition, a number of providers are reliant on tenant referrals from partnering agencies which are experiencing delays.
Sales
2.68 - A weak housing market affected by high mortgage rates and inflation impacted total sales receipts in 2024, which declined from the previous year by £1.5bn to £5.4bn. The corresponding surplus decreased by £0.4bn to £1.4bn.
Figure 11: Surplus on sales (consolidated)

| 2020 | 2021 | 2022 | 2023 | 2024 | |
|---|---|---|---|---|---|
| Gain / (loss) on disposal of fixed assets (£bn) | 1.0 | 0.9 | 1.2 | 1.2 | 1.0 |
| First tranche LCHO sales (£bn) | 0.3 | 0.3 | 0.3 | 0.4 | 0.4 |
| Non-social housing built for sale (£bn) | 0.2 | 0.2 | 0.2 | 0.2 | 0.0 |
| Total (£bn) | 1.5 | 1.3 | 1.7 | 1.8 | 1.4 |
2.69 - Many providers develop properties for sale. These may be units for outright sale at market values or low-cost home ownership (LCHO) units where a proportion of the property is sold as a first tranche. Both types of sale are classified as current asset sales and are included in operating activities.
2.70 - Total receipts from outright sale were £0.9bn in 2024, almost half of the £1.8bn reported in 2023. The contribution from this activity was just £43m, equivalent to 1% of the sector’s operating surplus. Outright sale remains concentrated in a small number of large providers. Five providers each reported a reduction in sales receipts of £60m or more relative to 2023, accounting for 60% of the overall decrease. Rising construction costs, higher interest rates and delays on development sites have all contributed towards the reduction in outright sale activity.
2.71 - In contrast, LCHO first tranche sale performance remained relatively robust. Sales receipts from this activity decreased by just 3% to £2.0bn and the margin remained at 18%. The contribution from first tranche sales was £364m, equivalent to 9% of the sector’s operating surplus (excluding fixed asset sales).
2.72 - The sector also recognises profit realised on the sale of properties held for rent. Such sales are classified as fixed asset sales. The profit recognised on this type of disposal decreased by £0.2bn to £1.0bn in 2024.
Figure 12: Surplus on fixed asset sales

| 2020 | 2021 | 2022 | 2023 | 2024 | |
|---|---|---|---|---|---|
| AHO/LCHO staircasing (£bn) | 0.3 | 0.3 | 0.4 | 0.4 | 0.2 |
| Other FA Sales (£bn) | 0.5 | 0.5 | 0.6 | 0.6 | 0.7 |
| RTB / RTA (£bn) | 0.3 | 0.1 | 0.2 | 0.2 | 0.1 |
| Total (£bn) | 1.0 | 0.9 | 1.2 | 1.2 | 1.0 |
2.73 - Sales of properties to existing tenants have decreased significantly in 2024 and are well below historic levels.
-
Tenants are able to purchase social / affordable rent properties through the RTB and RTA schemes. Sales proceeds from these schemes halved in the year, with the profit recognised falling from £238m in 2023 to £119m in 2024.
-
LCHO shared owners are able to purchase additional shares of their property. Such ‘staircasing’ sales decreased by 38% with the profit recognised falling from £360m in 2023 to £215m in 2024.
2.74 - Both staircasing and RTB/RTA sales are impacted by market conditions. In 2024, higher costs of borrowing and the increased cost of living have contributed towards the fall in demand. The Statistical Data Return showed that RTB/RTA sales fell by 48% (from 4,516) to 2,364 units in 2024[footnote 20]. LCHO sales to tenants also decreased by 37%.
2.75 - In contrast, the profit recognised on other fixed asset sales increased by 8% to £0.6bn. Other disposals include stock rationalisation and the bulk sale of social housing properties to other providers. In 2024, 65% of ‘other’ social housing sales were attributable to ten providers with just one provider accounting for 17% of sales.
2.76 - The sector forecasts summarised in the annex show an increase in the receipts generated through fixed asset disposals. The regulator will continue to monitor the financial viability of providers with material disposals. Where such sales are required to maintain viability, it is essential that providers understand the associated risks, both financial and reputational.
3. Financial statements
Table 5: Statement of Comprehensive Income
| Consolidated | Entity | ||||
|---|---|---|---|---|---|
| £ billion | Notes | 2024 | 2023 | 2024 | 2023 |
| Turnover | 2 | 25.1 | 24.3 | 23.6 | 21.6 |
| Operating expenditure | 2 | (18.3) | (16.9) | (17.5) | (15.8) |
| Cost of sales | 2 | (2.6) | (3.4) | (1.9) | (1.9) |
| Operating surplus/(deficit) | 2 | 4.3 | 4.0 | 4.2 | 3.9 |
| Gain/(loss) on disposal of fixed assets | 4 | 1.0 | 1.2 | 1.0 | 1.2 |
| Operating surplus/(deficit) including fixed asset disposals | 5.3 | 5.2 | 5.2 | 5.1 | |
| Other items | 5 | 0.8 | 2.0 | (0.1) | 0.1 |
| Interest receivable | 0.3 | 0.2 | 0.7 | 0.5 | |
| Interest payable and financing costs | 6 | (3.9) | (3.4) | (4.0) | (3.5) |
| Movements in fair value | 7 | (0.2) | 0.2 | (0.1) | 0.3 |
| Surplus/(deficit) before tax | 2.3 | 4.3 | 1.7 | 2.5 | |
| Taxation | (0.0) | 0.0 | (0.0) | 0.0 | |
| Surplus/(deficit) for the period | 2.3 | 4.3 | 1.7 | 2.5 | |
| Unrealised surplus/(deficit) on revaluation of housing properties | 0.0 | 0.1 | 0.0 | 0.1 | |
| Actuarial (loss)/gain in respect of pensions | 20 | (0.2) | 1.3 | (0.2) | 1.3 |
| Change in fair value of hedged instruments | 7 | (0.0) | 0.6 | (0.1) | 0.4 |
| Total comprehensive income for the period | 2.1 | 6.3 | 1.5 | 4.3 |
Table 6: Statement of changes in reserves
| £ billion | Income and expenditure reserves | Revaluation reserves | Other reserves | Total |
|---|---|---|---|---|
| Consolidated | ||||
| Closing balance 2023 | 55.2 | 10.8 | 0.9 | 66.8 |
| Restatements | 0.0 | (0.0) | (0.0) | 0.0 |
| Balance at start of period | 55.2 | 10.8 | 0.9 | 66.8 |
| Surplus/(deficit) for the period | 2.3 | 2.3 | ||
| Other comprehensive income | (0.2) | 0.0 | 0.0 | (0.2) |
| Transfer from revaluation reserve | 0.1 | (0.1) | (0.0) | |
| Other transfers | (0.0) | (0.0) | 0.5 | 0.5 |
| Closing balance 2024 | 57.4 | 10.7 | 1.4 | 69.4 |
| Entity | ||||
| Closing balance 2023 | 52.6 | 11.9 | 0.9 | 65.5 |
| Restatements | 0.0 | (0.0) | (0.0) | (0.0) |
| Balance at start of period | 52.6 | 11.9 | 0.9 | 65.5 |
| Surplus/(deficit) for the period | 1.7 | 1.7 | ||
| Other comprehensive income | (0.2) | 0.0 | 0.0 | (0.2) |
| Transfer from revaluation reserve | 0.1 | (0.1) | (0.0) | |
| Other transfers | (0.0) | (0.0) | 0.5 | 0.5 |
| Closing balance 2024 | 54.2 | 11.8 | 1.4 | 67.4 |
Table 7: Statement of Financial Position
| Consolidated | Entity | ||||
|---|---|---|---|---|---|
| £ billion | Note | 2024 | 2023 | 2024 | 2023 |
| Fixed assets | |||||
| Tangible fixed assets: housing properties at cost & valuation |
8 | 193.6 | 183.1 | 188.0 | 177.2 |
| Other fixed assets | 9 | 3.1 | 3.1 | 2.7 | 2.7 |
| Investment properties | 9 | 8.3 | 7.3 | 5.2 | 4.3 |
| Other investments | 9 | 1.7 | 1.8 | 3.9 | 3.7 |
| Total fixed assets | 206.6 | 195.4 | 199.9 | 187.9 | |
| Current assets | |||||
| Properties held for sale | 10 | 5.9 | 6.0 | 2.8 | 2.9 |
| Trade and other debtors | 10 | 2.6 | 2.4 | 2.1 | 2.0 |
| Cash and short-term investments | 10 | 5.5 | 6.3 | 4.4 | 5.1 |
| Other current assets | 10 | 2.3 | 2.3 | 9.3 | 8.9 |
| Total current assets | 16.4 | 17.1 | 18.5 | 18.9 | |
| Creditors: amounts falling due within one year |
|||||
| Short-term loans | 12 | 2.1 | 2.5 | 2.4 | 2.5 |
| Deferred capital grant: due within one year | 13 | 0.6 | 0.6 | 0.6 | 0.5 |
| Other current liabilities | 11 | 8.0 | 7.6 | 8.4 | 7.8 |
| Total creditors: amounts falling due within one year |
10.8 | 10.6 | 11.4 | 10.8 | |
| Net current assets/liabilities | 5.5 | 6.5 | 7.1 | 8.1 | |
| Total assets less current liabilities | 212.1 | 201.8 | 207.0 | 196.0 | |
| Creditors: amounts falling due after more than one year |
|||||
| Long-term loans | 12 | 96.3 | 89.8 | 72.5 | 68.1 |
| Amounts owed to group undertakings | 12 | 0.5 | 0.5 | 22.4 | 19.8 |
| Finance lease obligations | 12 | 0.8 | 0.8 | 0.8 | 0.7 |
| Deferred capital grant: due after more than one year | 13 | 41.1 | 39.7 | 40.4 | 38.8 |
| Other long-term creditors | 14 | 2.2 | 2.3 | 1.9 | 2.0 |
| Total creditors: amounts falling due after more than one year |
140.9 | 133.2 | 138.1 | 129.5 | |
| Provisions for liabilities | |||||
| Pension provision | 20 | 0.7 | 0.7 | 0.7 | 0.7 |
| Other provisions | 15 | 1.1 | 1.0 | 0.8 | 0.7 |
| Total net assets | 69.4 | 67.0 | 67.4 | 65.2 | |
| Reserves | |||||
| Income and expenditure reserve | 16 | 57.4 | 55.2 | 54.2 | 52.6 |
| Revaluation reserves | 16 | 10.7 | 10.9 | 11.8 | 11.8 |
| Other reserves | 16 | 1.4 | 0.8 | 1.4 | 0.8 |
| Total reserves | 69.4 | 67.0 | 67.4 | 65.2 |
4. Notes to the accounts
4.1 - Global Accounts methodology
4.1.1 - This analysis is based on a database of information derived from housing providers’ audited financial statements. The database contains data from the annual account regulatory returns (known as Financial Viability Assessments – FVAs) which must be submitted by providers that own or manage 1,000 or more homes.
4.1.2 - Where a provider is a parent of a group structure that produces consolidated financial statements, it submits both an entity and a consolidated FVA.
4.1.3 - These regulatory returns are aggregated to produce the Statement of Financial Position (SOFP), Statement of Changes in Reserves and Statement of Comprehensive Income (SOCI). The statements and notes within this document are based on the entity and consolidated datasets for 2023/24. Comparative figures for 2022/23 are also provided.
4.1.4 - Figures have been rounded to the nearest £billion or £million to one decimal place. This can result in rounding differences in totals as the individual returns are denominated in £000s.
Aggregate SOCI
4.1.5 - The aggregate SOCI reflects the sum of private registered provider activity for all accounting periods ending between 1 April 2023 and 31 March 2024.
Aggregate SOFP
4.1.6 - The aggregate SOFP is the sum of individual statements where the financial year-end falls within the period from 1 April 2023 to 31 March 2024.
Additional information
4.1.7 - Additional information is provided on other activities, selected notes to the financial statements and the number of homes in management.
Changes to the FVA return
4.1.8 - The following changes were made to the ‘Notes’ section of the FVA return for 2024.
-
A new line was added to the note for ‘other provisions’ to capture future shared ownership repairs provisions that arise under the new model of shared ownership.
-
A new note was added for selected defined benefit pension scheme disclosures for details of amounts recognised in the surplus or deficit for the year, and for the cash contributions made by the employer.
-
The guidance for gross arrears was updated to clarify that the figure reported should relate to arrears on Social Housing properties.
4.2 - Particulars of turnover, operating expenditure and operating surplus
a. Social housing lettings
4.2.1 - Turnover from SHL increased by 9% in the consolidated return and by 11% in the entity return, reaching £19.3bn and £19.2bn respectively. Factors contributing to the small difference between the consolidated and entity figures include turnover from small registered providers with fewer than 1,000 units where these form part of group structures, and social housing letting activity undertaken outside of England.
Table 8: Income and expenditure from SHL
| Consolidated | Entity | |||
|---|---|---|---|---|
| £ billion | 2024 | 2023 | 2024 | 2023 |
| Income | ||||
| Rents | 16.5 | 15.2 | 16.4 | 14.9 |
| Service charge income | 2.0 | 1.7 | 1.9 | 1.6 |
| Net rental income | 18.5 | 16.9 | 18.4 | 16.5 |
| Capital grant released to income | 0.5 | 0.5 | 0.5 | 0.5 |
| Other & revenue grant | 0.3 | 0.3 | 0.3 | 0.3 |
| Turnover from SHL | 19.3 | 17.7 | 19.2 | 17.3 |
| Expenditure | ||||
| Management | 3.7 | 3.4 | 3.7 | 3.4 |
| Service charge costs | 2.6 | 2.3 | 2.6 | 2.2 |
| Routine maintenance | 3.4 | 3.0 | 3.4 | 3.0 |
| Planned maintenance | 1.3 | 1.3 | 1.3 | 1.2 |
| Major repairs expenditure | 0.8 | 0.7 | 0.8 | 0.7 |
| Bad debts | 0.1 | 0.1 | 0.1 | 0.1 |
| Depreciation of housing properties | 2.8 | 2.6 | 2.7 | 2.6 |
| Impairment of housing properties | 0.1 | 0.1 | 0.1 | 0.1 |
| Other costs (including lease costs) | 0.4 | 0.4 | 0.4 | 0.4 |
| Expenditure on SHL | 15.1 | 13.9 | 15.1 | 13.6 |
| Operating surplus/(deficit) on SHL | 4.2 | 3.8 | 4.1 | 3.7 |
| Void rent loss | 0.3 | 0.3 | 0.3 | 0.3 |
4.2.2 - Rental income increased by £1.4bn (9%) in the consolidated return. Rent increases were capped at 7% for most properties (see 2.2, the highest amount in over 20 years, and for the rental element of shared ownership units, increases were capped at CPI + 1% at 11.1% (see 2.3). A net increase in the overall number of housing units during the year further increased the level of rental income recorded. The lag in rent increases resulted in a timing difference for the inflationary driven increase in turnover versus the increase in expenditure. Inflation peaked in 2022 and has gradually reduced since.
4.2.3 - Total expenditure on SHL increased by 9% to £15.1bn. Management costs increased by £247m (7%) over the year. 77% of providers reported an increase in management costs relative to 2023, predominantly due to inflationary pressures impacting utilities, insurance costs and staff salary increases. In addition, this also includes decant costs to enable significant repair works to take place.
4.2.4 - Service charge costs increased by £302m (13%) compared to 2023, with the corresponding income increasing by £267m (16%). Increases were widespread, with 82% of providers reporting an increase in service charge costs, whilst 87% reported an increase in related income. The higher proportion of providers increasing their charges is mainly due to timing differences of when costs are incurred by the provider, and when they are recharged back to the tenants. This time lag results in a discrepancy between service charge costs and income. The general increases reflect the higher costs for labour, materials and utilities required for building maintenance. Providers with a large proportion of stock in London are more likely to incur higher costs. From the top 10 providers reporting service charge costs, seven have over 20% of their stock in London. Providers with a significant presence in the care and support sector also tend to have relatively higher service charge costs. The ratio of service charge income to associated costs rose slightly to 76% (2023: 74%).
4.2.5 - Total maintenance and major repairs costs (recognised as operating expenditure) increased by 11% in 2024, with 83% of providers reporting an increase in spend compared to 2023. Within this, routine maintenance and planned maintenance expenditure increased by £451m (11%) over the year. Higher costs have been widespread; driven by increased demand for routine repairs to address damp and mould issues alongside building safety risks. Price inflation and the need for additional contractors to carry out higher volumes and complexity of works has also contributed to the cost increases. In addition, expensed major repairs spend increased by £77m (11%) in the year.
4.2.6 - Depreciation charges increased by £120m (5%) over the year, reflecting the continued investment in new and existing properties. Impairment charges relating to SHL were £92m, 2% higher than in 2023. Impairment charges recognised in the year mainly related to fire and building remediation works, contractor insolvencies and regeneration plans to demolish properties. One provider accounted for 20% of the overall SHL impairment charge. Similarly bad debt charges, including the movement in provisions and amounts written off, were also largely in line with the previous year.
4.2.7 - On a consolidated basis, operating surplus has increased by £428m (11%), with operating margin slightly increasing from 21.4% to 21.8%. The margin on an entity basis is not materially different.
4.2.8 - At both consolidated group and entity level, void rent losses remained at elevated levels at £0.3bn, in line with the average in recent years following the pandemic. Providers have continued to experience increased void re-let and repair times, due to delays in tenant referrals from partnering agencies for supported housing and the rise in repair works relating to damp and mould and building safety. As reported in the Quarterly Survey submission of Q4 2023/24, the highest void rent losses continue to be experienced by providers with a large proportion of supported housing units, care home units or housing for older people.
b. Other social housing activities
Table 9: Other social housing activities
| Consolidated | Entity | |||
|---|---|---|---|---|
| £ billion | 2024 | 2023 | 2024 | 2023 |
| First tranche LCHO sales | ||||
| Turnover | 2.0 | 2.1 | 2.0 | 2.0 |
| Expenditure / Cost of sales | 1.7 | 1.7 | 1.6 | 1.7 |
| Surplus | 0.4 | 0.4 | 0.3 | 0.4 |
| Other social housing activities | ||||
| Turnover | 0.9 | 0.9 | 1.1 | 1.0 |
| Expenditure / Cost of sales | 1.3 | 1.3 | 1.4 | 1.2 |
| Surplus | (0.4) | (0.4) | (0.3) | (0.2) |
| Total | ||||
| Turnover | 2.9 | 3.0 | 3.1 | 3.0 |
| Expenditure / Cost of sales | 3.0 | 3.0 | 3.0 | 2.8 |
| Surplus | (0.0) | (0.0) | 0.1 | 0.1 |
4.2.9 - Turnover from first tranche LCHO sales in the consolidated statements reduced by 3% (£69m) in 2024 to £2.0bn (2023: £2.1bn), and the surplus reduced by 4% to £364m (2023: £381m). The sales margin was consistent with that achieved in 2023, remaining at 18%. LCHO sales activity continues to be widespread across the sector, with over three-quarters of providers reporting income from this source. However, it is heavily concentrated amongst a small number of these providers, with seven reporting turnover of over £50m each and accounting for a third of the sector total.
4.2.10 - At group level, the turnover and surplus from other social housing activities (excluding first tranche LCHO sales) remained broadly in line with the figures reported in 2023. At entity level, turnover increased by £142m (15%) and costs increased by £207m (18%), resulting in a deficit of £272m. Turnover from other social housing activities is higher in the entity accounts than at group level due to the effect of intra-group transactions that are eliminated on consolidation. This includes Gift Aid receipts of £106m (see note 3 which have no associated operating costs and therefore contribute towards the smaller deficit reported at entity level compared to consolidated accounts.
4.2.11 - Just under half of other social housing activity (excluding first tranche LCHO sales) relates to support services. In the consolidated accounts, income from support services increased by 4% to £421m, and the overall deficit reduced by 7% to £67m. Support service income is concentrated in a small number of providers, with 12 providers each reporting income in excess of £10m from this source, and in aggregate accounting for two-thirds of the sector total.
4.2.12 - At group level, income from development services stood at £23m, compared to £37m in 2023. The deficit reduced by 27% to £169m and accounted for around 40% of the overall deficit on other social housing activities. Income in this category generally relates to development services provided to external organisations, however the operating costs also include internal development costs that cannot be capitalised or have been written-off. Over half of the sector’s total development service costs were reported by three providers.
4.2.13 - The remainder of other social housing activity in consolidated accounts includes community and neighbourhood services and housing management services, in addition to a range of other activities. The sector reported income of £448m from these activities (2023: £408m), and an overall deficit of £176m (2023 deficit: £116m).
c. Non-social housing activities
Table 10: Non-social housing activities
| Consolidated | Entity | |||
|---|---|---|---|---|
| £ billion | 2024 | 2023 | 2024 | 2023 |
| Properties developed for sale | ||||
| Turnover | 0.9 | 1.8 | 0.1 | 0.2 |
| Expenditure / Cost of sales | 0.9 | 1.6 | 0.1 | 0.2 |
| Surplus | 0.0 | 0.2 | 0.0 | 0.0 |
| Other non-social housing activities | ||||
| Turnover | 2.0 | 1.9 | 1.2 | 1.1 |
| Expenditure / Cost of sales | 1.9 | 1.8 | 1.2 | 1.0 |
| Surplus | 0.1 | 0.1 | 0.0 | 0.1 |
| Total | ||||
| Turnover | 2.9 | 3.6 | 1.3 | 1.3 |
| Expenditure / Cost of sales | 2.8 | 3.4 | 1.3 | 1.1 |
| Surplus | 0.1 | 0.3 | 0.0 | 0.1 |
4.2.14 - Turnover from properties developed for sale fell by 48% to £936m in consolidated statements; the lowest level since data was first collected in 2015. The surplus on outright sales fell by 77% to £43m. The resulting margin on outright sales was 4.6%, compared to 10.6% in 2023, and was also the lowest level recorded since 2015 when consolidated financial data, including the results from non-registered entities within providers’ group structures, was first collected.
4.2.15 - Five providers each reported a reduction in outright sale receipts of £60m or more since 2023, together accounting for 60% of the overall net reduction. Providers continue to be affected by a high level of contractor insolvencies within the sector, which has led to both delays on site and to uncommitted development being reassessed. Construction cost pressures, combined with higher interest rates, have resulted in the fall in surplus and margin seen this year. In 2024, 20 providers recorded an overall loss on outright sales, compared to 34 reporting an overall gain. In contrast, in 2023 only five providers reported an overall loss, compared to 58 with an overall gain.
4.2.16 - Around a quarter of providers have reported turnover from outright sales in 2024, however over 80% of the total was reported by just 15 provider groups; each of which recorded turnover of over £20m from this source. Outright sales activity is primarily undertaken by non-registered entities within group structures and is therefore materially greater in the consolidated returns.
4.2.17 - Turnover from outright sales included £54m worth of bulk sales to other organisations, compared to £137m in 2023. Five providers reported income of this type, however over three-quarters of the total was attributable to just one provider.
4.2.18 - A number of providers deliver units for outright sale through joint ventures, the income and expenditure from which is not separately reported. The net surplus from joint ventures is included in the income statement under “Other items” (see note 5.
4.2.19 - Income from all other non-social housing activities increased by 7% (£124m) in the consolidated accounts to reach £2.0bn. Costs increased by 9% to £1.9bn, resulting in a reduced surplus of £58m (2023 surplus: £101m).
4.2.20 - Other non-social housing turnover of £2.0bn includes income from market rent (£344m; 17%), nursing home provision (£339m; 17%), student accommodation (£98m; 5%), and non-social support service charges (£64m; 3%). However, the bulk of the income does not sit within these categories and is disclosed as ‘other’. This category accounted for 58% (£1,145m) of total other non-social housing turnover.
4.2.21 - Other non-social activities are concentrated in a small number of specialist or diverse groups. Within consolidated returns, 10 providers each reported income in excess of £20m; together accounting for 57% of the overall sector total. The nature of the non-social housing activity varies between providers, and includes the provision of leisure facilities, property management, commercial property rental, and gas servicing income. In addition to the costs associated with these income streams, other non-social costs that contributed to the deficit of £123m included building safety expenditure, amortisation and impairment charges, and pension scheme cessation costs.
4.3 - Gift Aid
4.3.1 - Within provider groups, Gift Aid payments are typically made by a trading subsidiary to a charitable group member, thereby allowing tax relief to be claimed on the amount donated. Gift Aid receipts and payments are eliminated on consolidation in group accounts.
4.3.2 - Within entity returns, Gift Aid receipts are included within turnover and disclosed as either ‘other social housing’ or ‘non-social housing’ activity. Receipts totalled £212m in 2024; 8% higher than the £196m reported in 2023. The Gift Aid receipts recognised in the year include distributions from group members participating in development for outright sale, shared ownership first tranche sale and management, and market rent, and can correspond to the profits generated by the trading subsidiary in either the current or the prior year. Providers classified £106m of the total receipts as social housing income (2023: £105m), with a further £106m being allocated to non-social housing activities (2023: £91m).
4.4Disposal of fixed assets
4.4.1 - Based on consolidated returns, total fixed asset sales during the year generated proceeds of £2.5bn, with a surplus of £1.0bn. This is a decrease in sales proceeds of 20% (£622m) from 2023, and a decrease in surplus of 17% (£200m). The surplus on disposal of fixed assets is calculated by deducting the carrying value of the asset from the sales proceeds. For the majority of providers, the carrying value is equal to the historic cost of the asset, less accumulated depreciation, and therefore this typically results in higher surpluses than with current asset sales.
Table 11: Disposal of fixed assets
| Consolidated | Entity | |||
|---|---|---|---|---|
| £ billion | 2024 | 2023 | 2024 | 2023 |
| Staircasing | ||||
| Proceeds | 0.5 | 0.9 | 0.5 | 0.9 |
| Costs of Sales | 0.3 | 0.5 | 0.3 | 0.5 |
| Surplus | 0.2 | 0.4 | 0.2 | 0.4 |
| RTB/RTA | ||||
| Proceeds | 0.2 | 0.4 | 0.2 | 0.4 |
| Costs of Sales | 0.1 | 0.2 | 0.1 | 0.2 |
| Surplus | 0.1 | 0.2 | 0.1 | 0.2 |
| Other housing property sales | ||||
| Proceeds | 1.5 | 1.6 | 1.6 | 1.5 |
| Costs of Sales | 0.9 | 1.0 | 1.0 | 0.9 |
| Surplus | 0.6 | 0.6 | 0.6 | 0.5 |
| Sales of other assets | ||||
| Proceeds | 0.2 | 0.2 | 0.3 | 0.1 |
| Costs of Sales | 0.1 | 0.2 | 0.2 | 0.1 |
| Surplus | 0.0 | 0.0 | 0.1 | 0.0 |
| Total | ||||
| Proceeds | 2.5 | 3.1 | 2.7 | 2.9 |
| Costs of Sales | 1.5 | 1.9 | 1.6 | 1.7 |
| Surplus | 1.0 | 1.2 | 1.0 | 1.2 |
4.4.2 - Staircasing receipts fell by 38% (£336m), and surpluses by 40% (£146m). Seven providers reported sales over £20m, accounting for 46% of the staircasing proceeds and 43% of the surplus. Staircasing transactions accounted for just over a fifth of the total fixed asset sale receipts generated during the year.
4.4.3 - Proceeds from RTB and RTA sales to tenants halved to a total of £216m, and the corresponding surplus also reduced by the same degree to £119m. Sales proceeds were split almost equally between RTB and RTA sales.
4.4.4 - The largest proportion of fixed asset sales were generated from other housing property sales, including stock rationalisation, sales to other providers and the strategic sale of void properties. In 2024, £1.5bn (2023: £1.6bn) was generated from this type of sale with a surplus of £0.6bn (2023: £0.6bn), and ten providers accounting for just over 60% of this amount.
4.4.5 - Sales of other assets, including the sale of commercial properties, amounted to £177m in the year (2023: £197m), with a surplus of £47m being achieved (2023: £29m). Almost half of these sales were reported by just two providers.
4.5 - Other items
Table 12: Other items
| Consolidated | Entity | |||
|---|---|---|---|---|
| £ billion | 2024 | 2023 | 2024 | 2023 |
| Other items | 0.7 | 1.9 | (0.1) | 0.1 |
| Share of operating surplus in joint ventures or associates | 0.1 | 0.1 | 0.0 | 0.0 |
| Total | 0.8 | 2.0 | (0.1) | 0.1 |
4.5.1 - The majority of the balance of ‘other items’ is comprised of gains on business combination, which amounted to £858m in 2024 (2023: £1,951m). This was partially offset by other sundry items with an overall net loss of £138m (2023: £40m). The net loss includes a charge of £102m which was reported as an exceptional item by one provider, and relates mainly to building safety liabilities.
4.5.2 - Gains on business combination arise where the acquisition method of accounting has been used. Of the £858m total gain reported, £832m relates to acquisitions where a new subsidiary is acquired. Five providers reported transactions of this type, with over half of the sector total being attributable to one provider. The remaining balance relates to gains where another organisation is acquired via a transfer of engagements and is subsumed into the acquiring organisation. The comparable figure for entity returns includes only acquisitions via transfer of engagements and amounts to £58m (2023: £54m).
4.5.3 - In consolidated returns, providers account for activity undertaken in jointly controlled entities using the equity method. In the SOCI, income and expenditure are not reported separately; instead, the net surplus or deficit from joint ventures is included as a single line item. The majority of the surplus from joint ventures is generated through the provision of homes for outright sale.
4.5.4 - For 2024, providers reported a share of turnover from joint ventures of £1,043m; an increase of 14% from the £918m reported in 2023. However, as with the surplus on outright sales (see note 2c), the net surplus from joint ventures experienced a large reduction in 2024; falling 35% to £67m (2023: £103m). A total of 41 provider groups reported a surplus or deficit from joint venture activity, with five providers accounting for over three-quarters of the overall sector surplus.
4.6 - Interest payable and finance costs
4.6.1 - Total interest and finance costs increased by £0.5bn (16%) in the consolidated statements to a total of £3.9bn. This includes a 19% increase in interest payable on liabilities marginally offset by a £39m decrease in ‘other amounts payable’ and £27m decrease in defined benefit pension charges.
4.6.2 - Capitalised interest of £520m (2023: £438m) is netted off the figure reported in the SOCI. When this is added back, total interest costs increased by £0.6bn (16%) in the year to £4.4bn.
4.6.3 - The increase in interest payable on liabilities was widespread throughout the sector with 83% of providers reporting an increase compared to 2023. This reflects the high and climbing interest rate environment in the year to March 2024, exacerbated by the increased financial pressures faced by the sector leading many providers to increase their debt portfolio. Total debt increased by £6.1bn (7%) to £99.7bn in 2024.
4.6.4 - Loan breakage costs saw the largest reduction within ‘other amounts payable’, with a £44m decrease to £12m compared to 2023. As the cost of borrowing increased the number of providers refinancing reduced and a total of just 6 providers reported loan breakage costs, compared to 20 providers last year.
Table 13: Interest payable and finance costs
| Consolidated | Entity | |||
|---|---|---|---|---|
| £ billion | 2024 | 2023 | 2024 | 2023 |
| Interest payable on liabilities | 4.2 | 3.6 | 4.2 | 3.5 |
| Defined benefit pension charges | 0.0 | 0.0 | 0.0 | 0.0 |
| Other amounts payable | 0.2 | 0.2 | 0.2 | 0.3 |
| Less: interest capitalised in housing properties | (0.5) | (0.4) | (0.4) | (0.3) |
| Total interest payable and financing costs | 3.9 | 3.4 | 4.0 | 3.5 |
4.7 - Movements in fair value and remeasurements
Movements in the fair value of investment properties
4.7.1 - Properties held for market rent or for capital appreciation are categorised as investment properties. They are re-measured annually at their fair value, with any change in fair value being reported in the surplus for the year.
4.7.2 - Based on the consolidated returns, the fair value of investment properties held by the sector fell by a net total of £141m. This resulted from valuation losses totalling £185m that were reported by 55 providers, partially offset by favourable movements of £44m reported by 61 providers. Three providers reported revaluation losses of over £29m each, accounting for almost 70% of the sector total.
Movements in the fair value of financial instruments
4.7.3 - Interest rate swaps and a minority of loans are classified as ‘non-basic’ or ‘other’ financial instruments under FRS102 and must be re-measured annually at fair value. Movements in the fair value of financial instruments are included within either the surplus, or, where they meet the conditions for hedge accounting, within other comprehensive income. Whether hedge accounting can be applied or not is determined by the economic relationship between the hedged item and the hedging instrument.
4.7.4 - Financial instruments held at fair value through the SOCI decreased by £19m during the year. This was almost entirely due to one provider that reported a fair value loss of £18m. In comparison, movement in fair value increased by £239m in 2023.
4.7.5 - In respect of hedged financial instruments, providers reported a favourable movement of £54m for the year, with one provider accounting for over 40% of this amount. The majority of hedging instruments within the sector are variable rate to fixed-rate interest rate swaps, and the liability associated with these reduces as swap rates increase. Over the year, the 15-year swap rate increased from 3.39% in March 2023 to 3.66% in March 2024.
4.8 - Fixed assets – housing properties
Table 14: Fixed asset housing properties
| £ billion | Consolidated | Entity |
|---|---|---|
| Housing properties at cost or valuation | ||
| Properties held at cost | 208.5 | 204.7 |
| Properties held at valuation | 1.2 | 1.2 |
| Total properties held at start of period | 209.8 | 205.9 |
| Additions | ||
| Additions (new properties) | 11.9 | 11.5 |
| Additions (existing properties) | 3.3 | 3.3 |
| Disposals | (1.5) | (1.5) |
| Transfers and reclassifications[footnote 21] | 0.8 | (0.3) |
| Revaluation and other | (0.0) | (0.0) |
| Total properties held at end of period | 224.2 | 218.8 |
| Depreciation and impairment | ||
| Total depreciation and impairment at start of period | 28.4 | 28.5 |
| Depreciation and impairment charged in period | 2.9 | 2.9 |
| Released on disposal | (0.5) | (0.5) |
| Revaluation and other | (0.1) | (0.1) |
| Total depreciation and impairment at end of period | 30.7 | 30.8 |
| Net book value at end of period: | ||
| Properties held at cost | 192.2 | 186.6 |
| Properties held at valuation | 1.4 | 1.4 |
| Total net book value | 193.6 | 188.0 |
| Net book value at start of period (restated) | 181.4 | 177.4 |
4.8.1 - The consolidated accounts show that the gross book value of housing fixed assets at the end of the period was £224.2bn, an increase of £14.5bn over the course of the year. This net increase comprised:
-
£11.9bn of investment in new supply,
-
£3.3bn worth of works to existing properties,
-
disposal of stock valued at £1.5bn, and
-
other movements, including transfers and revaluations, with a net value of £0.8bn.
4.8.2 - Total investment in new supply has increased by £1.7bn (17%) in comparison to 2023. Development expenditure is concentrated in a relatively small number of providers with 16 reporting more than £200m in the year, together accounting for 44% of the total.
4.8.3 - The amount of capital investment in existing stock saw an increase of £0.5bn (18%) with around three quarters of providers showing an increase year on year. There were 15 providers that each invested more than £50m in their existing stock, together accounting for 41% of the sector total.
4.8.4 - A net total of £2.3bn in depreciation and impairment was added during the year. This resulted in a total net book value of £193.6bn; an increase in the year of £10.4bn[footnote 22] (6%). This includes properties under construction worth £15.6bn; a net increase of 7% and equal to 8% of the total (2023: £14.5bn).
4.9 - Other fixed assets and investments
Table 15: Other fixed assets
| Consolidated | Entity | |||
|---|---|---|---|---|
| £ billion | 2024 | 2023 | 2024 | 2023 |
| Tangible fixed assets: other | 2.0 | 2.0 | 1.8 | 1.8 |
| HomeBuy loans receivable | 0.5 | 0.6 | 0.5 | 0.5 |
| Intangible fixed assets and goodwill | 0.6 | 0.5 | 0.4 | 0.4 |
| Total | 3.1 | 3.1 | 2.7 | 2.7 |
4.9.1 - At both consolidated and entity level, the overall value of other fixed assets remained broadly in line with the totals reported in the previous year. In both sets of statements, other tangible fixed assets are the largest item and account for just under two-thirds of the overall total. This category includes items such as office buildings, IT equipment, and fixtures and fittings.
Table 16: Investments
| Consolidated | Entity | |||
|---|---|---|---|---|
| £ billion | 2024 | 2023 | 2024 | 2023 |
| Investment properties | 8.3 | 7.3 | 5.2 | 4.3 |
| Investment in joint ventures | 1.2 | 1.2 | 0.1 | 0.2 |
| Investment in associates | 0.1 | 0.1 | 0.0 | 0.1 |
| Investment in subsidiaries | 0.0 | 0.0 | 3.3 | 2.9 |
| Other investments | 0.4 | 0.5 | 0.4 | 0.6 |
| Total | 10.0 | 9.1 | 9.1 | 8.0 |
4.9.2 - Total investments reported at consolidated level increased by 9% (£0.8bn) in the year, whilst in entity accounts an increase of 14% (£1.1bn) was recorded. The majority of the increase in investments in consolidated accounts related to investment properties (see Table 17), which increased by £0.9bn over the year. This was partially offset by a £0.1bn reduction in the value of other investments, just over 40% of which was due to two providers reclassifying balances within their FVA returns.
4.9.3 - A total of 45 provider groups reported investment in joint ventures, the overall value of which remained in line with the previous year. Joint venture activity is concentrated in a small number of large provider groups, with six providers accounting for just under three-quarters of the overall sector total. Joint ventures are typically used by the sector as a risk-sharing mechanism and are primarily used to undertake development of both social and private housing, and for large-scale regeneration works. Across the sector, the total value of investment in joint ventures and associates amounts to £1.3bn (2023: £1.3bn).
4.9.4 - Within entity accounts the value of investment properties and investments in joint ventures is substantially lower than in consolidated accounts, as much of the activity is managed through non-registered entities. However, entity accounts include the value of investment in subsidiaries, which are eliminated on consolidation in group accounts. The value of such investments increased by 12% (£0.3bn) over the year to £3.3bn. Around 70% of the net increase is attributable to just one provider, where investment in an existing subsidiary was increased.
Table 17: Investment properties
| Consolidated | Entity | |
|---|---|---|
| £ billion | 2024 | 2024 |
| Opening valuation (restated) | 7.8 | 4.7 |
| of which under construction | 0.2 | 0.0 |
| Additions | 0.6 | 0.6 |
| Transfers & reclassifications | 0.1 | 0.2 |
| Movement in fair value | (0.1) | (0.1) |
| Disposals | (0.2) | (0.2) |
| Closing valuation | 8.3 | 5.2 |
| of which under construction | 0.2 | 0.0 |
4.9.5 - Based on restated 2024 opening balances, the value of investment properties reported in consolidated accounts increased by £0.4bn (6%) to £8.3bn, which includes £0.2bn relating to properties under construction.
4.9.6 - The total value of investment properties mostly relates to both housing properties developed for market rent and commercial properties. However, three for-profit providers have recognised their social housing properties as investment properties. Although this deviates from the Housing SORP (Statement of Recommended Practice), it is permissible under the Financial Reporting Council (FRC) rules, due to these providers holding the properties for capital appreciation. These providers account for 12% of the £8.3bn total and represent 70% of total additions.
4.9.7 - Investment property activities are heavily concentrated within a small number of providers, with 14 providers reporting balances of more than £100m, accounting for 78% of the sector total. At £5.2bn, the value disclosed in the entity accounts is significantly lower, reflecting the general use of unregistered entities for this activity.
4.9.8 - Total disposals amounted to £0.2bn which were heavily concentrated amongst three providers, each with disposals in excess of £25m, accounting for 83% of the total.
4.10 - Current assets
4.10.1 - Total current assets held by consolidated groups decreased by £0.7bn (4%) over the year to £16.4bn. At entity level, a decrease of £0.4bn (2%) was reported.
Table 18: Total current assets
| Consolidated | Entity | |||
|---|---|---|---|---|
| £ billion | 2024 | 2023 | 2024 | 2023 |
| Properties held for sale | 5.9 | 6.0 | 2.8 | 2.9 |
| Trade and other debtors | 2.6 | 2.4 | 2.1 | 2.0 |
| Cash and short-term investments | 5.5 | 6.3 | 4.4 | 5.1 |
| Other current assets | 2.3 | 2.3 | 9.3 | 8.9 |
| Total current assets | 16.4 | 17.1 | 18.5 | 18.9 |
4.10.2 - The total value of properties held for sale is considerably higher at consolidated level (£5.9bn compared to £2.8bn in entity returns). This reflects market sale developments undertaken by unregistered entities.
4.10.3 - Of the £5.9bn total at consolidated level, 77% relates to land and properties under construction rather than unsold properties. Properties held for sale are concentrated in a small number of providers; a total of 17 provider groups reported values in excess of £100m, and between them accounted for 67% of the sector total. The £0.1bn decrease is almost entirely attributable to one provider.
Table 19: Cash and short-term investments
| Consolidated | Entity | |||
|---|---|---|---|---|
| £ billion | 2024 | 2023 | 2024 | 2023 |
| Cash | 5.1 | 5.7 | 4.1 | 4.7 |
| Short-term investments | 0.4 | 0.6 | 0.3 | 0.4 |
| Total | 5.5 | 6.3 | 4.4 | 5.1 |
4.10.4 - Based on consolidated returns, cash and short-term investments decreased by £0.8bn (12%) to £5.5bn. Reducing cash balances were widespread in the sector with 62% of providers reporting this. Cash held by the sector decreased by 10% to £5.1bn, with seven providers reporting a cash reduction of over £50m and accounting for over 90% of the total decrease. Around 20% of providers have short-term investments. Balances decreased by 37% to £0.4bn at consolidated level, with six providers reporting a reduction of over £20m each.
4.10.5 - At both consolidated and entity level, cash balances remain low and at levels not seen in nine years since 2015. Cash levels started reducing from 2022 due to catch-up works delayed during the pandemic and have continued to decrease. This reflects the increased funding of development programmes to build new homes, together with an increased spend on existing stock and loan repayments.
Table 20: Other current assets
| Consolidated | Entity | |||
|---|---|---|---|---|
| £ billion | 2024 | 2023 | 2024 | 2023 |
| Amounts owed by group undertakings | 0.1 | 0.1 | 7.6 | 7.2 |
| Refurbishment obligations | 0.4 | 0.5 | 0.4 | 0.5 |
| Fair value of derivative financial instruments | 0.1 | 0.1 | 0.1 | 0.1 |
| Other debtors due after one year | 0.8 | 0.7 | 0.4 | 0.3 |
| Any other current assets | 1.0 | 1.0 | 0.7 | 0.8 |
| Total | 2.3 | 2.3 | 9.3 | 8.9 |
4.10.6 - Amounts owed by group undertakings make up over 80% of other current assets in entity level accounts. Of the £7.6bn total reported, 14 providers accounted for over 75% of this with balances in excess of £100m. Amounts owed by group undertakings are eliminated on consolidation in group accounts. The small balance reported at consolidated level relates to groups where there is an unregistered parent.
4.10.7 - Refurbishment obligations decreased by around £30m at both consolidated and entity level. This balance relates to cases where a provider has entered into an agreement with a local authority to undertake refurbishment on transferred stock.
4.10.8 - The fair value of derivative instruments remained at £0.1bn in both consolidated and entity accounts. This is reported by providers making use of freestanding interest rate swaps or currency hedges. In 2024 returns, there were 20 provider groups reporting a derivative financial instrument current asset.
4.11 - Other current liabilities
4.11.1 - Total other current liabilities, as reported in the consolidated accounts, increased by £0.5bn (6%) over the year, largely due to a £0.2bn increase in accruals and deferred income, together with a £0.2bn increase in ‘other’ items.
Table 21: Other current liabilities
| Consolidated | Entity | |||
|---|---|---|---|---|
| £ billion | 2024 | 2023 | 2024 | 2023 |
| Trade creditors | 0.9 | 1.0 | 0.7 | 0.7 |
| Rent and service charges received in advance | 0.7 | 0.7 | 0.7 | 0.7 |
| Amounts owed to group undertakings | 0.1 | 0.0 | 2.1 | 1.8 |
| Recycled Capital Grant Funds | 0.4 | 0.4 | 0.4 | 0.4 |
| Accruals and deferred income | 3.8 | 3.6 | 2.8 | 2.6 |
| Other | 2.1 | 1.9 | 1.8 | 1.6 |
| Total | 8.0 | 7.6 | 8.4 | 7.8 |
4.11.2 - ‘Other’ current liabilities have increased to £2.1bn in consolidated group accounts which is predominantly driven by other creditors falling due within one year. This category also includes various miscellaneous creditor balances, including finance lease obligations and short-term refurbishment liabilities.
4.12 - Debt
4.12.1 - At consolidated level total debt in the sector increased by £6.1bn (7%) in the year to £99.7bn. 68% of providers reported an increase in debt. Of the total net increase, 42% was reported by 10 providers, each showing a net increase of over £180m each. In entity returns debt increased by £6.9bn (8%) to £98.1bn.
Table 22: Debt
| Consolidated | Entity | |||
|---|---|---|---|---|
| £ billion | 2024 | 2023 | 2024 | 2023 |
| Short-term loans | 2.1 | 2.5 | 2.4 | 2.5 |
| Long-term loans | 96.3 | 89.8 | 72.5 | 68.1 |
| Amounts owed to group undertakings | 0.5 | 0.5 | 22.4 | 19.8 |
| Finance lease obligations | 0.8 | 0.8 | 0.8 | 0.7 |
| Total | 99.7 | 93.7 | 98.1 | 91.2 |
4.12.2 - Quarterly Financial and Risk Survey data collected in the year to March 2024 shows that just under two-thirds of new finance agreed in the year was raised in the form of bank loans with the remaining mainly raised on the capital markets.
4.12.3 - The amount of short-term debt held in the consolidated accounts decreased by £0.4bn (15%) with 89% of the net decrease attributable to two providers. In contrast, long-term loans increased by £6.5bn (7%) to reach £96.3bn. The increase in long-term loans was widespread across the sector, with 70% of providers reporting an increase.
4.12.14 - The large difference in long-term loan balances at consolidated group level compared to entity level reflects the practice of raising finance within designated treasury vehicles.
4.12.15 - Amounts owed to group undertakings are eliminated on consolidation in group accounts, except where the provider has an unregistered parent. Four providers reported unconsolidated balances at group level, with one provider accounting for over 70% of the £0.5bn total.
4.13 - Capital grant
4.13.1 - At consolidated group level, the total capital grant reported within creditors (due within one year and after one year) increased to £41.8bn. The transactions in the year included the following:
-
New grant totalling £2.6bn was received during the year.
-
Grant of £511m was amortised and recognised in income. The majority of housing properties are held at cost with deferred capital grant being held as a creditor in the SOFP and released to income over the useful life of the asset (the accrual model).
-
A net total of £156m grant was released on disposal of housing properties, which includes balances transferred to the recycled capital grant fund (RCGF). Other movements gave a net deficit of £8m grant.
4.14 - Other long-term creditors
4.14.1 - At consolidated group level, other long-term creditors have decreased by £0.1bn (5%) to £2.2bn, driven by a reduction in the fair value of derivative instruments. At entity level, the total remained in line with previous year at £1.9bn.
Table 23: Other long-term creditors
| Consolidated | Entity | |||
|---|---|---|---|---|
| £ billion | 2024 | 2023 | 2024 | 2023 |
| Fair value derivative financial instruments | 0.3 | 0.4 | 0.2 | 0.3 |
| HomeBuy grant | 0.3 | 0.3 | 0.3 | 0.3 |
| RCGF | 0.6 | 0.7 | 0.6 | 0.7 |
| Other | 1.0 | 0.9 | 0.8 | 0.8 |
| Total | 2.2 | 2.3 | 1.9 | 2.0 |
4.14.2 - A total of 35 groups disclosed derivative financial instruments at fair value as a long-term creditor. These are mainly providers that have utilised standalone interest rate swaps to fix the interest payable on variable rate debt, or in a minority of cases, where currency swaps have been utilised to fix the exchange rate on interest payable in a currency other than Sterling. A liability arises when the value of cash flows due to the counterparty, is greater than those due to the provider. Three providers have recognised a liability in excess of £35m, accounting for 47% of the sector total.
4.14.3 - The total liability reported in consolidated group accounts in respect of derivative financial instruments has decreased by £71m (19%) since 2023. For most providers utilising standard interest rate swaps, the liability decreases as interest rate rise, and the decrease from 2023 reflects the continued rise in swap rates experienced over the year, due to elevated interest rates.
4.15 - Provisions
4.15.1 - The provision reported in respect of pension liabilities is covered in note 20, Pensions.
4.15.2 - Based on consolidated returns, other provisions disclosed by the sector increased by £0.1bn (8%) to £1.1bn. Of this, £0.4bn (2023: £0.5bn) relates to obligations to undertake refurbishment work where a stock transfer provider has entered into an agreement with a local authority. Providers must report both a payment in advance (creditor) and a prepayment (debtor), the latter is reported within current assets (see note 10).
4.15.3 - A new line has been added to the 2024 return to collect information regarding a provider’s future shared ownership repairs provision. The sector has reported a £2m provision based on consolidated returns.
4.16 - Reserves
4.16.1 - The total reserves within the consolidated group accounts increased by 4% in the year to £69.4bn (entity: 3%, £67.4bn). The majority of this increase relates to the annual surplus recognised in the year.
4.16.2 - Most reserves are not ‘cash backed’ as the surpluses transferred to the SOFP are reinvested in providers’ businesses, including major repairs of existing stock and the development of new homes.
4.16.3 - Based on consolidated returns, the income and expenditure reserves increased by 4% to £57.4bn and the revaluation reserve reduced by 2% to £10.7bn. Other reserves are further broken down in Table 24 below.
Table 24: Other reserves
| Consolidated | Entity | |||
|---|---|---|---|---|
| £ billion | 2024 | 2023 | 2024 | 2023 |
| Restricted reserves | 0.5 | 0.5 | 0.5 | 0.5 |
| Cashflow hedge reserves | (0.1) | (0.1) | (0.1) | (0.1) |
| Other reserves | 1.0 | 0.5 | 1.0 | 0.4 |
| Total | 1.4 | 0.8 | 1.4 | 0.8 |
4.16.4 - A total of 38 consolidated groups hold a balance in a cashflow hedge reserve, the majority of which relate to interest rate swaps. Just over half of these balances were negative, however the sector aggregate increased by £0.1bn, reflecting the favourable movement in valuations linked to interest rates.
4.16.5 - Other reserves increased by £0.5bn to £1bn. For-profit providers include shareholder equity in ‘other reserves’ in the FVA. The seven for-profit providers included in the dataset reported balances of £0.7bn in 2024. Share issues by two of this cohort were accountable for £0.4bn of the total increase.
4.17 - Operating leases
4.17,1 - The total amount of future obligations under operating leases disclosed in the financial statements has increased by £4.7bn to £6.6bn. One provider accounts for 68% of the total, with a further three providers with operating lease commitments in excess of £200m accounting for a further 17% of the total. The large increase in liabilities since the previous year is almost entirely attributable to one provider, where the basis of reporting has been changed. If liabilities had been reported on a consistent basis, the increase in the year would have been around £0.6bn.
Table 25: Operating leases
| Consolidated | Entity | |||
|---|---|---|---|---|
| £ billion | 2024 | 2023 | 2024 | 2023 |
| Amounts payable not later than one year | 0.3 | 0.2 | 0.2 | 0.2 |
| Amounts payable between one and five years | 0.7 | 0.5 | 0.7 | 0.5 |
| Amounts payable later than five years | 5.6 | 1.2 | 5.7 | 1.3 |
| Total | 6.6 | 2.0 | 6.6 | 2.0 |
4.18 - Capital commitments
4.18.1 - As a note to published accounts, providers must disclose the value of contracts for capital expenditure that are not provided for in the primary financial statements. In addition, they must also disclose the value of capital expenditure that has been approved by the board but not contracted for.
Table 26: Capital commitments
| Consolidated | Entity | |||
|---|---|---|---|---|
| £ billion | 2024 | 2023 | 2024 | 2023 |
| Expenditure contracted but not accounted for | 21.5 | 22.4 | 18.3 | 18.6 |
| Expenditure approved but not contracted for | 17.1 | 18.3 | 13.2 | 14.5 |
| Total | 38.6 | 40.8 | 31.5 | 33.1 |
4.18.2 - Based on consolidated returns, future capital expenditure contracted for has decreased by 4% to £21.5bn and capital expenditure approved but not yet contracted for has decreased by 7% to £17.1bn. This resulted in total capital commitments decreasing by 5% to £38.6bn overall.
4.18.3 - Future capital expenditure commitments are concentrated in a small number of provider groups. 23 providers disclosed capital commitments in excess of £500m each; together these accounted for 63% of the £38.6bn total.
4.19 - Homes owned and managed
4.19.1 - Restatements between the 2024 and 2023 returns result primarily from merger activity where units included in the 2023 closing total are not shown in the 2024 opening total. Where this is the case, the units will instead be included in the ‘transfers’ line of the acquiring provider following the completion of the merger.
4.19.2 - At entity level, the number of units owned is slightly lower than at consolidated level. The majority of the difference relates to a small number of provider groups where the consolidated returns also include entities operating outside of England. There are also a number of small subsidiary providers that own or manage less than 1,000 units and are therefore not required to submit an FVA, however these are included at the consolidated level.
Table 27: Social housing units owned
| Unit numbers (‘000s) | Consolidated | Entity | ||
|---|---|---|---|---|
| 2023 closing units owned | 2,817 | 2,776 | ||
| Restatements | (16) | (23) | ||
| Opening units owned | 2,801 | 2,752 | ||
| Units developed | 54 | 53 | ||
| Units sold/demolished | (12) | (13) | ||
| Transfers and sales to other providers | 15 | 31 | ||
| Other movements | 0 | (1) | ||
| Closing units owned | 2,858 | 2,823 | ||
| Units managed but not owned | 46 | 69 | ||
| Units managed and/or owned | 2,904 | 2,892 |
4.19.3 - Based on consolidated returns, the total number of units owned increased by 41,000 (1%) to 2,858,000. This includes the development of 54,000 new social units; an increase on the 53,000 and 49,000 units completed in 2023 and 2022 respectively.
4.19.4 - Development activity is concentrated with 12 providers reporting more than 1,000 units developed or acquired in the year. In combination, this group was responsible for more than one third of the total new social units reported by the sector. One for-profit provider developed or acquired 3,700 new social units. In total, 10% of all new social units were attributable to for-profit providers.
4.19.5 - These additional units were partially offset by 12,000 units that were lost from the sector through either sale or demolition, including through RTB/RTA and voluntary open market sales. Just over 10% of providers reported sales or transfers of stock to other providers. One for-profit provider transferred 3,300 units to a related entity. Five large providers reported the sale of more than 500 social units to other providers as part of stock rationalisation. Such transfers largely ‘net-off’ on consolidation at a sector level.
4.19.6 - In total, providers also reported a further 46,000 social units which they manage on behalf of another organisation but do not own (2023: 52,000). These units are concentrated in a small number of providers, with the top 15 accounting for almost 70% of the total.
4.19.7 - The number of non-social homes owned or managed in consolidated returns is significantly higher than that included in entity returns. This reflects the extent to which non-social housing activity, such as market rent, is delivered in non-registered entities within group structures.
4.19.8 - Based on consolidated returns, 2,000 new non-social rent units were developed or acquired in the year. Around a third of total non-social units are managed on behalf of other organisations.
Table 28: Non-social housing units owned and managed
| Unit numbers (‘000s) | Consolidated | Entity | ||
|---|---|---|---|---|
| 2023 closing units | 91 | 46 | ||
| Restatements | (2) | (2) | ||
| Opening units | 88 | 44 | ||
| Units developed | 2 | 1 | ||
| Units sold / demolished and other | (1) | (1) | ||
| Transfers and other movements | (2) | (1) | ||
| Closing units | 88 | 44 |
4.19.9 - In addition to the note on non-social housing units, the FVA return includes disclosures relating to the number of outright sale units developed and sold. Based on consolidated returns, 3,500 new outright sale units were completed in the year (2023: 4,800). In total 51 providers reported outright sale development, with 15 completing more than 100 units and accounting for nearly 80% of the sector total.
4.20 - Pensions
4.20.1 - In 2024, based on consolidated returns, an overall net defined benefit pension provision of £0.7bn was reported, consistent with the figure reported in 2023. A total of 137 providers reported an overall net pension liability and seven providers reported a net pension asset. Ten providers that had reported a pension provision in 2023 have removed their provision entirely this year; four due to exiting their defined benefit pension schemes, and six where there is a pension asset that has been fully derecognised. The accounting requirements of FRS102 state that an asset should only be recognised in respect of a defined benefit pension scheme to the extent that it is recoverable either through reduced future contributions or by way of a refund from the plan.
4.20.2 - New disclosures added to the FVA in 2024 show that during the year, providers contributed £0.3bn towards the pensions of employees that were members of defined benefit pension schemes (2023: £0.3bn). This does not include payments made towards defined contribution schemes, which are not separately reported.
4.20.3- The actuarial gain or loss in respect of the revaluation of defined benefit pension schemes is reported in other comprehensive income and arises as a result of changes in the value of plan assets and movements in underlying actuarial assumptions. These include projected changes in inflation, future salary increases, a discount rate linked to bonds, and mortality assumptions in relation to how long a pension is expected to be paid. Actuarial gains and losses on pension schemes can therefore fluctuate year-on-year. In 2024, based on consolidated returns, an overall actuarial loss of £0.2bn was reported, compared to a gain of £1.3bn being recognised in 2023.
4.20.4 - The net actuarial loss comprised of losses of £0.3bn reported across 139 providers, partially offset by gains of £0.1bn that were reported by 36 providers. In addition to ‘true’ actuarial gains and losses, this category has also been used by providers to disclose adjustments to restrict a pension asset. Such adjustments may also be reported in the FVA as ‘other remeasurements’, and in 2024 additional accounting losses of £0.1bn were reported under this heading in relation to the restriction of pension assets (2023: £0.1bn).
5. Annex – Financial forecasts
5.1 - This section of the report provides an overview of data submitted to the regulator in relation to providers’ current business plans.
Background
5.2 - Financial forecast returns (FFRs) are collected from all private registered providers owning and/or managing more than 1,000 units. The returns set out the financial elements of providers’ business plans in a standardised form and include 30-year projections of the key financial statements plus further details of development plans and the key financial assumptions used.
Context
5.3 - The data in this report is based on the 199 FFRs submitted in June 2024 and focusses on the first five forecast years of those plans, which is the period from April 2024 to March 2029. It also draws on the submissions from previous years to identify some key long-term trends. Business plans are considered commercially sensitive and therefore the disaggregated data source will not be made publicly available.
5.4 - Providers’ business plans represent their view of a range of key factors at a given point in time. They show how the business is likely to continue under a specific set of assumptions but are not predictions of the future. All providers undertake stress-testing of their business plans which is designed to show the impact of a range of adverse scenarios and identify appropriate mitigating actions. There can be substantial changes made to forecasts between years as providers react to the prevailing economic climate and adapt their business plans to emerging priorities and risks.
Weakening financial forecasts
5.5 - The latest set of FFRs continue the recent trend which has seen a weakening of financial performance across the sector year on year. This is evidenced in the declining performance as measured by EBITDA MRI[footnote 23] interest cover, a key measure of the ability to cover finance costs from operating income.
5.6 - Figure 13 below shows how the sector aggregate forecast for EBITDA MRI interest cover has weakened with each successive FFR since 2019. The aggregate sector interest cover forecast for years 1 to 5 has fallen from 125% in 2023 to 111% in the latest forecasts. Business plans typically show that interest cover is forecast to improve over the life of the plan. However, the forecast improvements built into recent business planning rounds have not been achieved. This reflects the challenging environment the sector is experiencing, with continued investment in existing homes combined with higher interest rates pushing up the cost of debt.
Figure 13 EBITDA MRI Interest Cover (Source: FVA and FFR 2019-24)

| 2017 | 2018 | 2019 | 2020 | 2021 | 2022 | 2023 | 2024 | 2025 | 2026 | 2027 | 2028 | 2029 | |
|---|---|---|---|---|---|---|---|---|---|---|---|---|---|
| FVA | 170% | 174% | 153% | 138% | 151% | 128% | 103% | 89.6% | |||||
| FFR 2019 | 161% | 158% | 176% | 183% | 191% | 194% | 200% | 201% | 205% | 212% | 217% | ||
| FFR 2020 | 142% | 142% | 153% | 168% | 176% | 181% | 183% | 189% | 196% | 202% | |||
| FFR 2021 | 154% | 137% | 158% | 166% | 171% | 172% | 173% | 178% | 180% | ||||
| FFR 2022 | 133% | 124% | 140% | 151% | 156% | 157% | 160% | 162% | |||||
| FFR 2023 | 110% | 105% | 117% | 127% | 134% | 138% | 142% | ||||||
| FFR 2024 | 93% | 92% | 105% | 114% | 120% | 123% |
5.7 - These two key factors are also driving the decline in projected performance since the last set of forecasts. Firstly, declining margins, particularly as a result of increased forecast expenditure on repairs and maintenance. Secondly a sustained rise in borrowing costs, reflecting the higher interest rates impacting providers undertaking refinancing or with debt held at flexible rates. Both of these drivers are consistent with the headlines for the financial results in the year to March 2024 summarised in the main publication.
Increasing spend on repairs and maintenance
5.8 - Total spend on repairs and maintenance over the first five years of plans has grown by 11% for the second successive year reaching an annual average of £10bn. Of the £50bn total spend over the first five years, £22bn (45%) is capitalised major repairs with the remainder being revenue spend. A total of £4.5bn (9%) is forecast to be spent on building and fire safety works over this period.
5.9 - Maintaining the condition of the housing stock remains a key priority for providers and there are additional cost pressures associated with improving energy efficiency and decarbonisation which may not yet be fully reflected in business plans. Expectations around stock decency, decarbonisation and provision of new homes will continue to evolve.
5.10 - Based on latest forecasts, repairs and maintenance spending is growing at a faster rate than income from social housing lettings which is squeezing projected EBITDA MRI margins and contributing to the decline in interest cover.
Figure 14 Repairs & Maintenance Spend FY1-5 (Source: FFRs 2022-24)

| 2022 | 2023 | 2024 | |
|---|---|---|---|
| Routine Maintenance (£bn) | £18bn | £21bn | £23bn |
| Major Repairs (£bn) | £4bn | £4bn | £5bn |
| Capitalised Major Repairs (£bn) | £18bn | £20bn | £22bn |
| Total (£bn) | £41bn | £45bn | £50bn |
| 2022 | 2023 | 2024 | |
|---|---|---|---|
| Routine Maintenance (£bn) | 45% | 46% | 46% |
| Major Repairs (£bn) | 11% | 10% | 9% |
| Capitalised Major Repairs (£bn) | 45% | 44% | 45% |
| Total (£bn) | 100% | 100% | 100% |
Increased cost of servicing debt
5.11 - The second factor impacting interest cover is the increase in interest charges for the sector. The overall level of debt in plans is in line with what was previously forecast, increasing by £19bn to reach £117bn by the end of the first five forecast years. However, the amount of interest has increased as providers have assumed that interest rates will remain higher for longer than they did in the previous iteration of plans.
5.12 - A total of £48bn in new facilities are forecast to be raised over the first five years of plans on which interest rates will be determined by market rates at the point deals are concluded. The extent to which those terms differ from the forecasts included in these plans will impact future interest cover performance.
5.13 - The 2023 FFRs saw a significant rise in interest costs reflecting the significant change in economic circumstances at that time. The increase in the latest forecasts is comparatively small but means that finance costs are continuing to exert downward pressure on interest cover.
5.14 - In aggregate the sector is forecasting £25.7bn in interest payments over the first five forecast years. This is an increase of £1.6bn (7%) in comparison to the previous forecasts. The effective interest rate over this period is 4.6%, up from 4.5% in the 2023 forecasts and above the 4.4% reported for the year up to March 2024.
5.15 - Providers generally take a prudent approach to forecasting the interest rates which underpin their business plans. The plans are forecasting a gradual reduction in interest rates, failing to around 4% by 2028. This is slightly higher than current economic forecasts.
Provider responses to weakening financial performance
5.16 - The increased financial pressures outlined above have resulted in providers making trade-offs in the development of their business plans.
5.17 - There has been a marked reduction in the amount of development included within plans. The total number of units forecast to be completed in the first five years has fallen by 42,000 units (12%) to 292,000. The largest reductions are in properties developed for sale (both market sale and low-cost home ownership). The reduction in development for sale in particular may indicate that providers are choosing to de-risk their business plans in order to focus on investment in their existing stock. In some parts of the country market conditions and concerns about viability of the cross-subsidy model may also be a factor.
5.18 - There has been a smaller reduction in sub-market rental development overall with a decrease in affordable rent properties and an increase in social rent.
Figure 15 Forecast Development – new units FY1-5 (Source: FFRs 2022-24)

| 2022 | 2023 | 2024 | |
|---|---|---|---|
| GN - Social | 53 | 47 | 53 |
| GN - Affordable | 158 | 130 | 106 |
| Supported & Other | 28 | 21 | 20 |
| LCHO | 122 | 107 | 91 |
| Mkt. sale & non-social rent | 37 | 29 | 22 |
| 397 | 333 | 292 |
5.19 - After the first two forecast years the vast majority of development included in plans is not contractually committed. For many providers the ability to delay or cancel development programmes is a key mitigation cited in the stress testing of their business plans.
5.20 - In addition to the reduction in development, there has been a marked increase in the forecast sale of fixed assets. The total surplus from fixed asset sales within the first five years has increased by £0.8bn (14%) to £6.3bn. The total cash receipt over the same period is forecast to be £19bn (excluding for profit providers which would otherwise result in double-counting due to the sale of stock between related entities), up over 40% from £13bn in the previous set of plans. This represents c.11% of total income to the sector.
Figure 16 Surplus on Fixed Asset Sales by Type (Source: FFRs 2022-24)

| 2022 | 2023 | 2024 | |
|---|---|---|---|
| GN - Social (£bn) | 53 | 47 | 53 |
| GN - Affordable (£bn) | 158 | 130 | 106 |
| Supported & Other (£bn) | 28 | 21 | 20 |
| LCHO (£bn) | 122 | 107 | 91 |
| Mkt. sale & non-social rent (£bn) | 37 | 29 | 22 |
| Total (£bn) | 397 | 333 | 292 |
5.21 - Whilst the surplus projected generated from sales to existing tenants, under either the Right to Buy or Right to Acquire schemes or through staircasing of shared ownership properties is lower than previous plans, there is marked increase in other sales of social housing units.
5.22 - The 2024 business plans have seen an increase in the number of providers including plans for bulk disposals of specific portfolios of their stock. There are several potential reasons for this, including stock rationalisation in terms of both geographic areas of operation, and the sale of properties which cannot economically be brought up to standard. Where providers are reliant on such disposals to maintain their financial viability, it is essential they understand the associated risks, both financial and reputational. The regulator will continue to monitor the financial viability of providers where there is a reliance on fixed asset sales to support cashflows and reflect its findings in regulatory judgements where appropriate.
Segmentation
5.23 - The data in this report is an aggregation of 199 separate business plans submitted by a diverse range of providers. Forecast financial performance varies markedly between different subsets of providers. In particular, the largest providers as a group exhibit markedly lower levels of interest cover than the sector as a whole. A group of seventeen large providers each managing more than 40,000 units, collectively forecast interest cover of 103% over the first five years compared to 111% for the sector as a whole. This picture is exacerbated for those large providers which have a particular focus on London where a range of cost pressures appear to be having a more significant impact.
5.24 - These providers typically have a wider range of activities and have more scope to refocus activity in order to improve financial performance. It is in these providers where a large proportion of the decrease in development and the increase in the sale of fixed assets noted above can be found.
Changing economic forecasts
5.25 - The business plans on which these forecasts are based will have been prepared in the first quarter of 2024 and have used the economic forecasts that were available at that time to project future performance. Subsequent changes to the economic climate can have a significant impact and will be built into the next round of business plans. For example, the rent increase which will be applied in 2025 was determined by the published rate of inflation in September. The majority of providers have based their plans on an anticipated rate of 2.5%. Inflation has fallen more rapidly than was being forecast at the time these plans were prepared and the September figure was 1.7%[footnote 24].
5.26 - There is still significant uncertainty in the macroeconomic, policy and operating environment. Regardless of the decisions made in the coming year, we expect financial pressures on providers to remain for the foreseeable future. The regulator requires them to have a good understanding of the potential impact of changes to key financial and economic drivers on their plans and to have appropriate mitigations in place to manage their risk exposures.
Conclusions
5.27 - The latest set of financial forecasts shows that whilst there remain sources of financial strength, including a strong liquidity position, the sector’s financial position has continued to weaken. Reduced financial headroom limits the sector’s ability to manage downside risk and means that some providers are making trade-offs in order to reduce their risk exposure and maintain their focus on their existing stock. This can be seen in the reductions in forecast development plans and providers reviewing their stock portfolios and deciding to sell or transfer some of their housing stock.
5.28 - The regulator will continue to engage closely with providers where our analysis suggests that financial performance is weak and will reflect this in regulatory judgements. Where a provider identifies a potential problem with, or threat to its viability, it is incumbent on them to give the regulator early warning.
-
Quoted household interest rates - a visual summary of our data, Bank of England ↩
-
Building Safety Fund: Information for leaseholder and residents, MHCLG, March 2022. ↩
-
Building materials and components statistics: April 2024, Department for Business and Trade ↩
-
Output in the construction industry: all-work summary, Office for National Statistics ↩
-
Housing supply: indicators of new supply, England: Jan to Mar 2024, DLUHC ↩
-
Total number of people on Universal Credit in England, LG Inform ↩
-
Source: Department of Work and Pensions via Stat-Xplore ↩
-
Managed migration: Completing Universal Credit rollout, House of Commons Library, March 2024 ↩
-
RSH sets new standards to drive improvements in social housing, Feb 2024 ↩
-
Total interest costs divided by total debt. ↩
-
Social Housing Decarbonisation Fund Wave 2.1: successful bids, GOV.UK ↩
-
For properties developed for sale, providers do not report the actual expenditure incurred in the year; instead, the cost attributable to the properties sold in the year is reported (the ‘cost of sales’). The expenditure incurred in the year is therefore estimated using the reported cost of sales figures and the movement in the opening and closing value of properties held for sale. ↩
-
PRP social housing stock in England – sector characteristics and stock movements 2023/24 ↩
-
Includes mergers where the acquisition method is used and the units are transferred/acquired during the year. ↩
-
Based on the closing net book value in the 2023 submissions. ↩
-
Earnings before interest, taxation, depreciation and amortisation, including all major repairs expenditure. ↩