Value for money metrics report - annex to Global Accounts 2022 (accessible version)
Updated 7 March 2023
Applies to England

© Crown copyright 2023
This publication is licensed under the terms of the Open Government Licence v3.0 except where otherwise stated. To view this licence, visit nationalarchives.gov.uk/doc/open-government-licence/version/3 or write to the Information Policy Team, The National Archives, Kew, London TW9 4DU, or email: psi@nationalarchives.gov.uk.
Where we have identified any third party copyright information you will need to obtain permission from the copyright holders concerned.
This publication is available at https://www.gov.uk/government/publications/2022-global-accounts-of-private-registered-providers/value-for-money-metrics-report-annex-to-global-accounts-2022-accessible-version
Executive summary
High inflation, rising borrowing costs and increasing demands to invest in both the existing housing stock and new supply mean that the social housing sector is facing financial pressure. It is now essential that Boards make effective decisions ensuring scarce resources are used efficiently and effectively in the delivery of their objectives. The Value for Money Standard therefore expects Boards to be accountable for their decisions on the use of their resources and assets, demonstrating how they arrived at their decisions and how they are delivering against them. To support this objective. the VFM Standard places transparency requirements on providers.
The Standard also requires registered providers to report annually against prescribed VFM measures with the aim of enhancing both transparency and accountability to the sector and addressing relative performance.
Underpinning this process, the regulator annually publishes VFM analysis as part of its ongoing commitment to support stakeholders (including tenants) to assess and interpret the performance of individual organisations, and to assist Boards to compare their own organisational performance against that of their peers.
Over this past year, the continuing effects of Brexit and the COVID-19 pandemic are still being felt, adding to existing and new pressures on the sector, namely:
- the effect of rising inflation and supply chain pressures
- uncertainty around the rent settlement [footnote 1]
- political and environmental imperatives of addressing climate change, and
- the conflict in Ukraine.
Acknowledging these factors, providers have responded by reshaping their business plans, with an impact on their reported VFM performance.
Key highlights of sector results for the year to March 2022:
Shape of the sector
For the first time in the sector’s history, there are 30 providers who own over 30,000 homes, which accounts for just over half the sector’s social housing stock. This shift in ownership is attributable firstly to organic growth, and secondly to a small number of provider mergers undertaken during the year.
Reinvestment has returned to pre-pandemic norms
Reinvestment into existing housing stock and development was 6.5% of the total value of existing stock - an increase from 5.8% in 2021. This reflects the increased rate of investment into capitalised major repairs and maintenance expenditure, as well as new supply and acquisitions since the lifting of COVID-19 restrictions.
Sector remains committed to growth in new homes despite challenging market conditions.
The total number of new social homes added to the sector increased by 12% [footnote 2] compared to the 2021 outturn. The sector delivered 45,542 social housing homes and 5,552 non-social homes. This compares to the period 2019-20, the year preceding the pandemic, when the sector delivered 50,015 social homes and 9,198 non-social homes.
Over half of the sector’s headline costs relate to maintenance and major repairs expenditure on existing social housing stock, which has contributed to an increase in headline social housing costs and reduced operating margins.
The median headline costs increased by 11% to £4,150 per unit. This had an impact on the median operating margin (social housing lettings) which fell from 26.3% in 2021 to 23.3% in 2022.The increase in headline costs was mainly attributable to a record level of expenditure on maintenance and major repairs which includes costs relating to building safety spend, catch-up works delayed from the COVID-19 pandemic and costs related to energy efficiency.
Delivering against VFM targets in challenging times has been difficult and some measures of financial capacity have weakened.
The impacts of both rising inflation and COVID-19 restrictions have highlighted the difference in financial resilience across the sector. The weighted average EBITDA MRI [footnote 3] interest cover fell from 151% in 2021 to 128% in 2022. In contrast, the degree of dependence on debt finance, reflected by the gearing metric has remained relatively constant at 47.0% (weighted average).
Quality of reporting in the accounts
Both on the metrics and the extent to which it met the Standard’s other requirements was mixed. Stronger reports presented a clear set of strategic objectives and suitably aligned, measurable targets, but for some others it was less clear what their organisation was trying to achieve. We also identified instances where providers had adjusted the regulator’s VFM measures, meaning their reporting was not comparable with that of other providers. As the sector continues to face greater scrutiny, it is imperative that providers strengthen reporting on performance, particularly around stock quality and service delivery, to allow tenants, investors, and other stakeholders to hold providers to account.
With the sector under financial pressure as a result of the challenging operating environment, it is more important than ever that Boards have a clear understanding of their organisation’s performance and can take informed, evidence-based decisions about the use of limited resources. In this context, we expect Boards to embed VFM throughout their business plans and improve approaches to VFM initiatives in the delivery of their outcomes for both current and future tenants.
VFM is not a new concept, rather an important means for Boards and management to cost and evaluate options and optimise performance. For example, creating value through more accurate data-driven decision making, through collaboration with other organisations or simply through more effective planning. When VFM principles are firmly embedded and understood, the process becomes an effective tool designed to improve, drive, and demonstrate efficiency.
1. Introduction
1.1 The aim of the VFM Standard is to ensure Boards have a clear strategic view on VFM related to their objectives and how best they use the range of resources available to them to achieve those objectives. Providers who are meeting the Standard will have up-to-date objectives which relate to their business plan; have a clear approach to achieving VFM; and set and monitor progress against measurable targets for those objectives.
1.2 The regulator’s suite of VFM metrics is intended to enhance the consistency, comparability, and transparency of VFM reporting in the sector. This publication supports that aim by reporting performance on the regulator’s standard metrics. In combination with providers’ own published targets – a reporting requirement of the Standard itself – the VFM metrics will allow interested stakeholders to understand how providers perform when compared to the rest of sector.
1.3 This report presents the latest VFM performance data [footnote 4] for the period ended 31 March 2022. The content summarises the metrics data for the sector as a whole and segments of the sector according to some key characteristics such as size, geographical location or supported housing. It also provides commentary on some of the key themes emerging from the analysis.
1.4 A key aim of the report is to help Boards practically assess and frame their thinking about how performance information on VFM could strengthen their understanding of how their organisation compares to the sector and their peers.
1.5 The publication also looks at the quality, transparency and accuracy of VFM reporting in the accounts, based on a sample of providers’ statutory accounts.
1.6 The social housing white paper makes clear that landlords need to be transparent with their tenants on performance. There are a number of dimensions to this, including the requirement to report on new Tenant Satisfaction Measures. Landlords must also be clear to tenants on their wider performance including on financial questions. The VFM metrics contribute to this wider picture.
1.7 As providers prepare to report on the Tenant Satisfaction Measures from April this year, it is an opportunity for us to remind Boards of the requirements set out in both our Economic and Consumer standards and any technical notes that accompany them. Where the regulator requires providers to report on their performance, it is essential that the metrics are calculated on the precise basis required. Inconsistent reporting undermines transparency to tenants and other stakeholders.
1.8 The expectation is that providers will engage with the value for money metrics and present information about their own performance that increases transparency to all stakeholders. While we welcome any additional reporting on VFM performance, providers must make clear which measure they report against, whether it is their own internal measure or the regulator’s.
1.9 The report opens with details on the quality of providers’ reporting in the accounts and addresses the requirements and expectations of the Standard. It is then divided into four further sections:
- Section 3 presents the aggregate metrics results for the whole sector, including the quartile distributions for each metric.
- Section 4 assesses the metric performance for sub-sector groups, following the explanatory factors identified in previous analysis of cost variation in the sector.
- Section 5 assesses VFM performance at a regional level.
- Section 6 sets out our regulatory approach to regulating the VFM Standard.
1.10 To supplement sector-level performance the regulator also publishes providers’ performance on the range of VFM metrics to help organisations benchmark their performance more easily – the benchmarking tool has been enhanced and the data can be found alongside this report.
1.11 It should be noted that in 2022 there was a change in reporting requirements for Low cost home ownership (LCHO) recorded in the Private registered provider social housing stock in England Statistical Data Return. We asked providers to record LCHO units with the maximum share sold (where the maximum share sold was less than 100% of the equity), as LCHO rather than as leasehold homes.
1.12. Overall, based on the estimated additional units of 5,300, and the number of sales of this type of unit, 3,470 homes were reclassified. It is possible that this change in reporting may have had a small impact on individual providers’ New supply metrics. There is no impact to the sector-level performance as a result of this change.
2. Value for Money reporting in the accounts
2.1 This section of the report summarises the quality of reporting drawn from around a quarter of registered providers’ accounts. It reflects a large sample but is not intended to be an exhaustive review. This year we want to draw out some key themes that we think there is scope for further progress on, recognising all the challenges faced by the sector.
2.2 The Standard requires all registered providers to annually publish the following evidence in their statutory accounts:
- Performance against its own VFM targets and any metrics set out by the regulator, and how that performance compares to peers; and
- Measurable plans to address any areas of underperformance, including clearly stating any areas where improvements would not be appropriate and the rationale.
2.3 The Standard is an established part of the regulatory framework. The approach to VFM reporting remains co-regulatory and is not intended to be overly prescriptive in any way. Requirements of the Standard itself are amplified as a part of the VFM Code of Practice.
2.4 Ensuring optimal use of resources and assets is an important expectation of the Standard. Boards must be equipped with the right tools to make the best possible decisions for the long-term resilience of the organisations they govern. This means that Boards need to ensure that there is appropriate oversight of performance by management.
2.5 Performance management and monitoring when combined with the regulator’s VFM benchmarking tool is a helpful bridge – it enables management to develop a better understanding of how their organisation compares to the sector and to their peers, and crucially allows Boards to challenge their organisation’s performance. Being able to measure, evaluate and understand what is driving performance means decisions can be made with a more complete understanding of how stakeholders will be affected by which decisions.
Data quality
2.6 Responsibility for the integrity of reported information rests with Boards. Reported information on performance is not limited to the regulator, it is also an important tool to third parties, including other providers, their tenants and a wide range of stakeholders for benchmarking purposes.
2.7 Reliable and timely information supports Boards and management in making decisions in pursuit of their strategic objectives. It also provides stakeholders with knowledge of how resources are deployed in the business and as a part of an organisation’s broader social value model.
Feedback
2.8 The regulator’s analysis of providers’ published reporting, both on the value for money metrics and the extent to which it met the Standard’s other requirements, was mixed this year. Reports that provided limited assurance did not follow the reporting measures as required in the Value for Money Technical Note. Other areas of limited assurance included reports that did not set out targets measured against actual performance and, where relevant, not being transparent about how performance would be improved in future.
2.9 The Standard gives providers an opportunity to publish supplementary data and narrative to improve the reader’s understanding of the factors influencing performance on the reported metrics. The Standard sets out specific expectations on reporting which are amplified in the VFM Code of Practice. These existing expectations are drawn out in more detail in this section to support improved transparency on reporting in future reports.
Strategic objections and target focus
| When considering your annual report on value for money, is the external picture you portray a fair reflection of performance? |
|---|
Expectations
- Good reporting on VFM starts with a suite of up-to-date strategic priorities which aims to provide stakeholders with an accessible picture of what the organisation is planning to achieve.
- The linkage of VFM metrics to strategic objectives is a key pillar of effective reporting.
- Optimising the use of assets and available resources are central to providers’ strategies – being clear about planned outputs and outcomes and how they will be achieved over time; this includes for example, efficiency gains that will be achieved through improved services, or through partnership arrangements and special purpose vehicles. When set out in this way, stakeholders can appreciate the organisation’s achievements with the resources available to them.
Reporting highlights
- On the whole, most providers articulate and define what they plan to focus on in a clear and unambiguous way. Understandably, some business strategies were adjusted to reflect market conditions over the past couple of years. Good examples of strategy articulation included explaining changes to asset management plans covering building safety, regeneration and sustainability programmes, procurement of services or existing commercial activities where risk exposure had increased.
- For a small minority of providers, it was not always clear whether the targets reported on were up to date and reflected the organisation’s revised strategy especially where changing dynamics and expectations were influencing priorities.
- An effective asset management strategy should be driven by the organisation’s corporate objectives. Where difficult decisions on disposal of fixed assets on a material scale had been taken, it was not always clear to stakeholders how it aligned with their objectives or how proceeds from asset sales are being deployed across the business.
- An increasing number of providers appear to have well-established plans in place towards meeting sustainability and climate change targets, while some other providers have also reported on the value derived from sustainability projects. This includes, for example, reporting on savings generated through improved energy efficiency or climate adaptation schemes.
- In most accounts, providers have reported on their own measures to enhance stakeholders’ understanding of performance in the year. While these can generally be linked to strategic objectives, for a minority of providers the relationship was less clear.
Performance monitoring and reporting
| All providers are reminded to follow the calculations set out in the VFM Technical Note Guidance when reporting on the regulator’s suite of VFM metrics |
|---|
| Benchmarking clubs and data are available to support peer group comparison, this includes the regulator’s VFM benchmarking tool. |
| Reporting should be an effective management and scrutiny tool. |
Expectations
- The Standard requires providers to report performance against targets. Reporting the current year’s targets against outturn helps stakeholders identify what has been achieved or where expected levels of delivery fall short – it puts the current year’s performance into context.
- Acknowledging the impact of different business activities provides a clear picture of performance at a group level and can helpfully account for any material differences when compared to peers. The VFM Code of Practice makes clear that providers who undertake a range of activities in addition to their core social housing activity are expected to report on these also. When considering non-core activities, it may be helpful to set out how surpluses generated are reinvested into core social activities. This might reasonably include investment into regeneration programmes or local communities.
- Providers are reminded that they must include units that meet the legal definitions of social and non-social housing and comply with the regulator’s guidance when accounting for units “owned” and “managed” which are relevant to a small number of VFM measures. The VFM Standard requires providers to report on the basis set out by the regulator. Failing to follow the technical requirements in calculating the VFM metrics means that a provider is not meeting the requirements of the Standard.
Reporting highlights
- Some reports provided a comprehensive review of how they compare to peers and were clear where they differ. Examples include reporting on additional or one-off costs that relate to decisions on sustainability, treasury management, the provision of supported services and community regeneration or costs relating to building safety programmes.
- Benchmarking is critical for strategic and operational decision-making. Boards and their executives must take note that costs associated with types of activities such as the provision of supported housing and regional wage differences can impact a range of measures. While there were some good examples of peer group analysis based on factors such as size, region of operation and business focus, some reports are limited to sector benchmarking only. Other obvious examples of sub-standard benchmarking included organisations who ranked performance ‘best,’ ‘top quartile’ or ‘No.1’ with little regard to the peer group they compared to.
- Many providers had clearly amended their business plans in light of changing market conditions. However, only a small minority of providers made clear that targets were adjusted or revisited to reflect these changes.
- Providers are able to report on their own VFM measures, in addition to the regulator’s required metrics. This allows stakeholders to assess the impact of conditions that may be distinctive to their business or area of expertise. As providers are adapting to new requirements and standards, they are also reporting on a wider range of measures. The link however between these changes and their strategic objectives is not always clearly drawn which makes it difficult for stakeholders to assess what the organisation is trying to achieve.
- In recent years, some providers have diverged from the regulator’s measures as set out in the VFM Technical note, in ways that can appear to enhance performance. Where such cases were identified we are engaging with providers on an individual basis. All providers are reminded to comply with the reporting expectations in future reports.
Addressing areas of underperformance
| Building trust and being transparent about performance is of paramount importance to stakeholders |
|---|
Expectations
-
In meeting the expectations of the Standard, Boards are expected to provide an accurate account of their performance. Understandably, there will always be external factors outside the sector’s control that can impact performance outcomes, such as Government policy and economic downturns which means providers may not meet targets. Where providers have not met targets or where adjustments have been made in-year we expect providers to be clear regarding those changes.
-
Boards currently face a series of very difficult trade-off decisions in the delivery of their organisational objectives. Decision-making around the allocation of resources between different options will differ from one provider to another depending on intended outcomes. Regardless of what decisions are agreed upon, we expect transparency on performance across all aspects of the business including activities that generate lower returns and the rationale for these activities.
Reporting highlights
- Reporting on performance shortfalls often includes activities such as new social housing supply, maintenance and responsive repairs or specialist services, and the impact these have on providers’ own measures such as customer satisfaction and response rate times. Exceptional reports by Boards disclosed the context behind the data presented, but this is limited to a few – a short supporting narrative can put information into context such as explaining what is behind performance trends.
- Reporting in the accounts is also an opportunity for Boards to provide helpful insights into business activities that do not appear to be delivering optimal outcomes and the decisions for maintaining those activities. Where we have identified these issues, we will engage with Boards to understand the operating decisions behind these activities.
- A small number of providers had needed to make difficult business decisions in order to address areas of underperformance, produced clear reports, succinctly highlighting the actions taken by board to address these issues. Examples included decisions to close non-core business streams or strategies to tackle inefficient services through improvements to procurement planning.
3. Sector analysis
3.1 This section presents the distribution of performance on the regulator’s metrics using the upper quartile, lower quartile, median and weighted average. A table summarising the distribution of performance across all metrics 2019-2022 can be found in Annex B. [footnote 5]
Reinvestment and New supply measures
3.2 The impact of events over the past two years has had a significant influence on VFM performance across the sector. In this year’s report we have presented data over a four-year period to reflect performance in the year preceding the COVID-19 pandemic for comparison purposes.
Table 1: Reinvestment and new supply distribution of performance
| VFM measure | 2019 | 2020 | 2021 | 2022 | |
|---|---|---|---|---|---|
| Reinvestment | Upper | 8.7% | 10.0% | 8.2% | 8.6% |
| Median | 6.2% | 7.2% | 5.8% | 6.5% | |
| Lower | 4.2% | 4.9% | 4.0% | 4.7% | |
| Weighted average | 6.4% | 7.6 % | 5.7% | 6.3% | |
| New supply (social) | Upper | 2.5% | 2.4% | 2.0% | 2.1% |
| Median | 1.5% | 1.5% | 1.3% | 1.4% | |
| Lower | 0.6% | 0.7% | 0.5% | 0.7% | |
| Weighted average | 1.6% | 1.8% | 1.4% | 1.6% | |
| New supply (non-social) | Upper | 0.13% | 0.15% | 0.09% | 0.09% |
| Median | 0.00% | 0.00% | 0.00% | 0.00% | |
| Lower | 0.00% | 0.00% | 0.00% | 0.00% | |
| Weighted average | 0.31% | 0.31% | 0.22% | 0.18% |
Key headlines
3.3 The median rate of reinvestment into new and existing housing properties increased from 5.8% in 2021 to 6.5% in 2022. However, the picture over the past four years is less straightforward. While reinvestment performance has fluctuated, partly driven by market conditions and the COVID-19 pandemic, total fixed assets have grown (the denominator of the reinvestment measure), by 14% since 2019 due to revaluations and new housing stock, meaning it has deflated the overall reinvestment performance.
3.4 The sector is committed to reinvesting into existing stock and regenerating local areas. Over the past three years, it has increased its focus on stock quality. The sector reinvestment when split by investment components shows that the weighted average investment into existing housing stock [footnote 7] in 2022 was 1.25% of total fixed assets – an increase from 0.94% in 2021, which reflects the sector’s continued commitment to stock quality, and an increase in activity following the end of pandemic restrictions.
3.5 The sector delivers the vast majority of new social supply and also homes for market rent and market sale. As the sector is largely non-profit, it reinvests surpluses into the delivery of new homes, contributing towards meeting Government targets.
Figure 1: Reinvestment breakdown (weighted average)
| Reinvestment: | Housing properties at cost or valuation | ||
|---|---|---|---|
| Works to existing | Development and other | ||
| 2019 | 1.27% | 5.23% | £150.8bn |
| 2020 | 1.21% | 6.38% | £160.37bn |
| 2021 | 0.94% | 4.79% | £165.64bn |
| 2022 | 1.25% | 5.03% | £172.07bn |
3.6 Despite recent market volatility, the delivery of new homes continued at pace as committed schemes planned during the COVID-19 pandemic completed; the weighted average reinvestment into new development as a percentage of total asset values rose to 5% which is broadly in line with pre-pandemic performance levels. The level of acquisitions of s106 stock also increased with the recovery of the wider construction industry.
Debt based measures
Table 2: Gearing and EBITDA MRI interest cover distribution of performance
| 2019 | 2020 | 2021 | 2022 | ||
|---|---|---|---|---|---|
| Gearing | Upper | 53.9% | 54.7% | 53.3% | 53.1% |
| Median | 43.4% | 44.0% | 43.9% | 44.1% | |
| Lower | 32.6% | 33.0% | 32.9% | 32.1% | |
| Weighted average | 46.7% | 47.7 % | 47.2% | 47.0% | |
| EBITDA MRI interest cover | Upper | 238% | 227% | 248% | 198% |
| Median | 184% | 170% | 183% | 146% | |
| Lower | 139% | 126% | 134% | 107% | |
| Weighted average | 153% | 138% | 151% | 128% |
Key headlines
3.7 Gearing [footnote 8] and EBITDA MRI interest cover are indicative measures of the sector’s ability to take on more debt to support both the delivery of new homes and improvements to existing stock quality, and its ability to cover ongoing finance costs from operating activities.
3.8 Liquidity within the sector remains strong. Over the past year gross debt increased by 3% to £89.2bn - 2022 Global Accounts of private registered providers. The gearing measure indicates the degree of dependence on debt finance and has broadly remained stable over the last 4 years across all quartiles. The median has increased slightly from 43.9% in 2021 to 44.1% in 2022.
3.9 However, the median EBITDA MRI interest cover across the sector has fallen from 170% in 2020. This reflects lower surplus as headline costs increased, particularly reflecting increased expenditure on repairs and maintenance.
Economy based measures
Table 3: Headline social housing cost per unit (£k) distribution of performance
| VFM measure | 2019 | 2020 | 2021 | 2022 | |
|---|---|---|---|---|---|
| Headline social housing cost £k | Upper | £4.69 | £4.86 | £4.76 | £5.18 |
| Median | £3.69 | £3.83 | £3.73 | £4.15 | |
| Lower | £3.18 | £3.34 | £3.21 | £3.70 | |
| Weighted average | £4.12 | £4.25 | £4.15 | £4.60 |
Key headlines
3.10 There is a wide range of performance right across the cost distribution and all quartiles have seen a significant increase in costs per unit. In 2022, the median headline cost increased by £420 per unit to £4,150, driven by economic factors such as wages, shortage of labour and supply of goods, and an increased focus on repairs and maintenance.
3.11 In proportionate terms, the greatest increases were seen in the lowest cost providers. The headline cost per unit in the lower quartile increased by 15% from £3,210 in 2021 to £3,700 in 2022 compared to a 9% increase in the upper quartile. The higher year-on-year increase in headline costs in the lower quartile was primarily driven by capitalised major repairs expenditure.
3.12 The annual change [footnote 9] in expenditure components is shown in figure 2. The largest incremental growth in the year related to major repairs and maintenance costs which increased by 19.5% in the year, from £1,926 to £2,302 per unit as the sector caught up on repairs and maintenance works as COVID-19 restrictions eased. Service charge costs increased by 3.4% over the same period, from £678 to £701 per unit. Management costs account for over a quarter of total headline costs (sector median). But despite upward pressure on wages across the economy [footnote 10], management costs only increased by 2.7% from £1,075 to £1,104 per unit.
3.13. Over the past four years, an increasing proportion of headline social housing cost per unit has been devoted to spend on maintenance and major repairs, rising from 47.7% of the total in 2019 to 50.1% of the total in 2022.
Figure 2: Headline social housing cost per unit weighted average by expenditure component
| Year | Management (£) | Service charges (£) | Maintenance and major repairs (£) | Other (£) |
|---|---|---|---|---|
| 2019 | 1045 | 626 | 1965 | 481 |
| 2020 | 1068 | 662 | 2051 | 468 |
| 2021 | 1075 | 678 | 1926 | 470 |
| 2022 | 1104 | 701 | 2302 | 491 |
Headline social housing costs per unit trajectory
Figure: Weighted average HSHC FVA (2015-2022) and HSHC FFR Forecasts 2019-22 versus 2015 HSHC inflated by CPI
| HSHC per unit (£k) | ||||||
|---|---|---|---|---|---|---|
| 2015-2022 actual | 2019 forecasts | 2020 forecasts | 2021 forecasts | 2015 FVA infl CPI | 2022 forecasts | |
| 2015 | 4.04 | 3.93 | ||||
| 2016 | 4.06 | 4.06 | ||||
| 2017 | 3.79 | 4.15 | ||||
| 2018 | 3.92 | 4.26 | ||||
| 2019 | 4.12 | 4.12 | 4.34 | |||
| 2020 | 4.15 | 4.15 | 4.25 | 4.4 | ||
| 2021 | 4.15 | 4.15 | 4.15 | 4.08 | 4.43 | |
| 2022 | 4.60 | 4.08 | 4.4.1 | 5.82 | 4.62 | |
| 2023 | 4.08 | 4.41 | 4.62 | 5.29 | 5.82 | |
| 2024 | 4.19 | 4.45 | 4.64 | 5.73 | 6.01 | |
| 2025 | 4.53 | 4.69 | 5.94 | 6.09 | ||
| 2026 | 4.79 | 5.94 | 6.23 | |||
| 2027 | 6.06 | 6.33 |
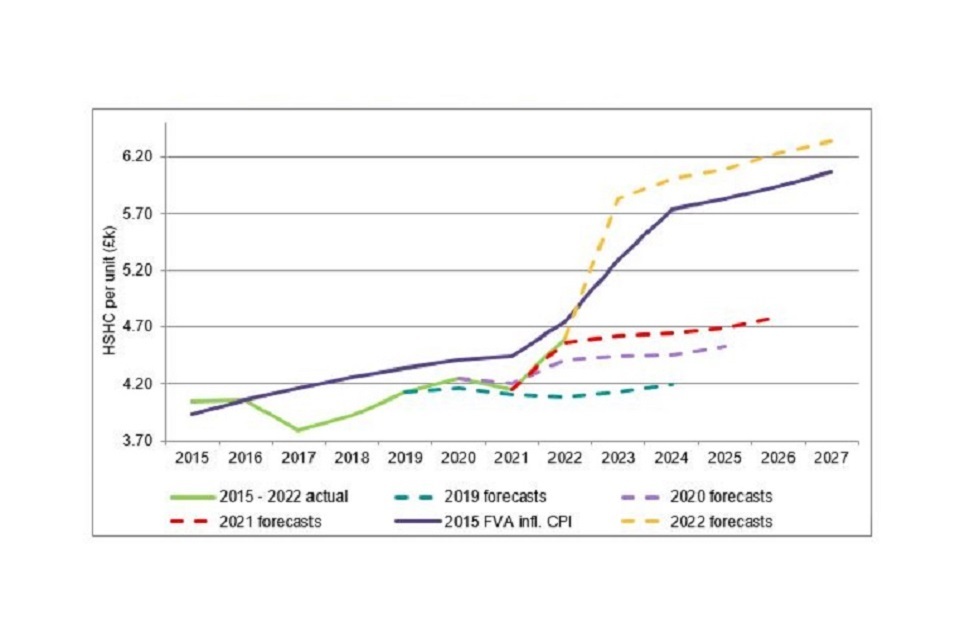
The information shown on this graph is the same as the table above
3.14 The trajectory of headline social housing costs over a longer time frame is shown in figure 3. Between 2016 and 2017 the headline cost per unit fell by 6.4% as providers reduced their cost base to mitigate the loss of rental income following the announcement of the 1% rent reduction. Since then and up to 2021 the outturn shows the pressure on the sector’s cost base from increasing investment into existing stock which has led to above inflation increases each year.
3.15 In 2021, headline costs per unit fell by 2.6% due to restrictions on services during the COVID-19 pandemic. However in 2022, despite an increase of 10.8%, the graph shows that headline costs remain below their 2015 levels in real terms by 3.1%.
3.16 While the outlook remains uncertain, over the next five-year forecast period [footnote 13], costs are expected to rise by 38%, which is above the central inflation forecast of 28% - Bank of England monetary report - but only 4.5% above 2015 levels, in real terms.
3.17 The primary driver in cost growth over the next five years is maintenance and major repairs which account for 59% of the total increase in headline costs. The five-year forecast data reported in figure 3 refers to providers’ business plans submitted in summer 2022 and pre-date subsequent changes to increases in inflation and the recent rent cap announcement. On that basis, we expect providers will be revisiting their business plans.
Figure 4 : Headline social housing costs per unit by total social stock owned and/or managed
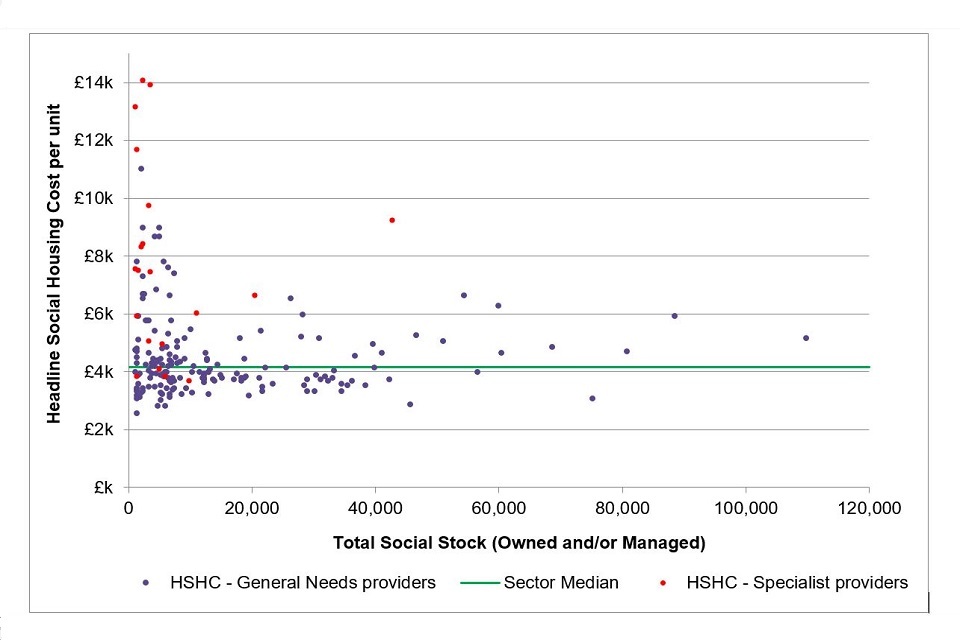
Figure 4 : Headline social housing costs per unit by total social stock owned and/or managed
3.18 There remains significant variation around the headline cost median. The extent of this variation is illustrated in figure 4. It shows the overall spread across different sizes of provider. The weighted average headline social housing cost is £4,600 per unit. This compares to the median cost of £4,150 per unit. The difference between the weighted average and the median is driven by providers operating in high-cost locations or owning high levels of supported housing.
3.19. Providers with the highest headline costs tend to be based in London, while around 80% of supported housing or housing for older people specialists also have costs above the sector median.
Operating margin and return on capital employed measures
Table 4: Operating margin and return on capital employment distribution of performance
| VFM measure | 2019 | 2020 | 2021 | 2022 | |
|---|---|---|---|---|---|
| Operating margin (social housing lettings) | Upper | 34.6% | 32.3% | 32.6% | 28.5% |
| Median | 29.2% | 25.7% | 26.3% | 23.3% | |
| Lower | 23.1% | 20.8% | 22.2% | 17.6% | |
| Weighted average | 30.5% | 27.8% | 28.3% | 25.4% | |
| Operating margin (overall) | Upper | 30.8% | 28.6% | 28.2% | 25.4% |
| Median | 25.8% | 23.1% | 23.9% | 20.5% | |
| Lower | 20.0% | 18.1% | 18.1% | 14.3% | |
| Weighted average | 25.0% | 22.1% | 22.3% | 19.6% | |
| Return on capital employed | Upper | 4.7% | 4.4% | 4.2% | 3.9% |
| Median | 3.8% | 3.4% | 3.3% | 3.2% | |
| Lower | 3.0% | 2.6% | 2.7% | 2.4% | |
| Weighted average | 3.6% | 3.2% | 3.1% | 2.9% |
Key headlines
3.20 Performance on operating margins from social housing activities and return on capital employed is relatively similar to headline costs given cost performance feeds directly into the calculation of both measures. Almost 70% of the sector’s income is generated from core social housing activities, and while turnover increased by 2.2% in the year it was more than offset by an increase in major repairs and maintenance expenditure.
3.21 In 2020 and 2021, the relatively stable performance in operating margin social housing lettings (SHL) was driven by lower levels of operating and capitalised expenditure into existing stock associated with the COVID-19 pandemic restrictions. In 2022, the weighted average operating margin (for SHL) was 25.3%, a decrease compared to the previous year’s margin of 28.3%.
3.22 This compares to the weighted average operating margin (Overall) of 19.6% in 2022. This is generally in line with previous years’ performance and is driven by lower returns from non-social housing activities including, housing built for sale, market rent nursing homes, non-social support services and student accommodation.
Figure 5: Impact on social housing lettings costs on operating margins 2016-22
| SHL Turnover (£bn) | Operating cost SHL (£bn) | Operating margin (SHL) | |
|---|---|---|---|
| 2016 | 15 | 10.2 | 32.1% |
| 2017 | 15.1 | 10 | 34.1% |
| 2018 | 15.4 | 10.3 | 32.8% |
| 2019 | 15.5 | 10.7 | 30.5% |
| 2020 | 15.7 | 11.3 | 27.8 % |
| 2021 | 16.1 | 11.5 | 28.3% |
| 2022 | 16.5 | 12.3 | 25.3% |
3.23 The ROCE measures the amount of pre-tax surplus an organisation can generate from the capital employed in its business and is affected by both changes in the sector’s total asset value and operating surplus. As with operating margins, aside from a plateau during the pandemic, ROCE has fallen over the past four years, driven by a combination of falling operating surpluses and rising asset values.
4. Sub-sector analysis
4.1 A single year’s data inevitably only represents a snapshot of the sector’s activity, but still reveals valuable information about the diversity of the sector. While the depth and severity of the COVID-19 pandemic has had a profound effect on the sector, the impact across different types of providers was borne unequally with, for example, particular impacts on organisations that provide a wide range of care and support services.
4.2 The recovery in investment activity since the end of the pandemic restrictions has been one of the main drivers of year-on-year change across the sector and has also had a differential impact on different cohorts of providers.
Table 5: 2022 - Summary of sub-sector metrics (registered providers owning / managing more than 1,000 homes).
| Quartile data | No of RPs | % of sector (social units owned) | Reinvestment | New supply (social) | New supply (non-social) | Gearing | EBITDA MRI interest rate cover | Headline social housing cost per unit (£K) | Operating margin (social) | Operating margin (Overall) | Return on capital employed | |
|---|---|---|---|---|---|---|---|---|---|---|---|---|
| All returns | Upper quartile | 200 | 100.00% | 8.60% | 2.10% | 0.10% | 53.10% | 197.50% | £5.18 | 28.50% | 25.40% | 3.90% |
| Median | 6.50% | 1.40% | 0.00% | 44.10% | 145.70% | £4.15 | 23.30% | 20.50% | 3.20% | |||
| Lower quartile | 4.70% | 0.70% | 0.00% | 32.10% | 106.70% | £3.70 | 17.60% | 14.30% | 2.40% |
| Provider sub-set | Median | |||||||||||
|---|---|---|---|---|---|---|---|---|---|---|---|---|
| Size (Social units owned) | > 30,000 | 30 | 51.20% | 6.30% | 1.60% | 0.13% | 45.20% | 143% | £4.08 | 28.60% | 21.10% | 3.10% |
| 20,000 - 29,999 | 13 | 11.90% | 6.00% | 1.60% | 0.07% | 46.80% | 107% | £3.87 | 25.30% | 21.40% | 2.50% | |
| 10,000 - 19,999 | 33 | 17.30% | 7.60% | 1.40% | 0.00% | 48.20% | 138% | £3.89 | 21.80% | 19.80% | 3.40% | |
| 5,000 - 9,999 | 53 | 13.10% | 7.20% | 1.60% | 0.00% | 48.80% | 146% | £4.01 | 24.50% | 22.80% | 3.40% | |
| 2,500 - 4,999 | 31 | 4.30% | 6.50% | 1.20% | 0.00% | 45.80% | 158% | £4.42 | 21.60% | 20.40% | 3.20% | |
| < 2,500 | 40 | 2.20% | 4.70% | 0.90% | 0.00% | 32.30% | 194% | £4.96 | 19.50% | 17.40% | 2.40% | |
| Cost factor | LSVT 12 yr | 8 | 3.00% | 12.00% | 1.00% | 0.00% | 30.50% | 48% | £4.43 | 15.20% | 13.30% | 3.00% |
| London | 26 | 10.60% | 5.30% | 1.00% | 0.00% | 43.10% | 92% | £6.76 | 20.30% | 15.00% | 2.20% | |
| SH provider | 15 | 1.50% | 6.10% | 1.20% | 0.00% | 12.50% | 203% | £8.40 | 10.00% | 5.20% | 2.90% | |
| HOP provider | 6 | 3.10% | 4.50% | 1.00% | 0.00% | 43.20% | 146% | £5.77 | 16.10% | 13.40% | 2.60% |
Size and cost factor
4.3 The analysis in this section provides some helpful insights into the differences between types of providers driven by cost factor and size with a primary focus on the following subgroups of providers: * providers of supported housing (SH)[footnote 17] and housing for older people (HOP) [footnote 18] * large scale voluntary transfers (LSVTs) that are less than 12 years old [^19] * registered providers based in London [footnote 20].
4.4 In 2018 the regulator published analysis to explain the relationship between each of the seven value for money metrics and the identifiable explanations for the variation across the sector [footnote 21]. That analysis found that these three factors had the greatest ability to explain variations in performance across the sector.
4.5. The range of performance on New supply (SHL), Reinvestment and Headline costs are shown in figures 6, 7 and 8 and demonstrates how providers’ performance are influenced by geographical location and size. These factors are explained throughout the remainder of this report.
Figure 6: New supply (social) medians by cost factor and size 2019 - 2022
| 2019 | 2020 | 2021 | 2022 | 2002 Upper Quartile | 2022 Median | 2022 Quartile | |
|---|---|---|---|---|---|---|---|
| LSVT < 12 yr | 0.6% | 0.8 % | 0.7% | 0.1 % | 2.1% | 1.8% | 0.7% |
| London | 1.4% | 1.3% | 0.7% | 1.0% | 2.1% | 1.8% | 0.7% |
| SH provider | 0.8% | 0.4% | 1.5% | 1.2% | 2.1% | 1.8% | 0.7% |
| HOP provider | 0 | 0.7% | 1.1% | 1.0% | 2.1% | 1.8% | 0.7% |
| > 30,000 | 1.8% | 1.7% | 1.4% | 1.6% | 2.1% | 1.8% | 0.7% |
| 20,000-29,000 | 1.5% | 1.4% | 1.3% | 1.6% | 2.1% | 1.8% | 0.7% |
| 10,000-19,000 | 1.5% | 1.3% | 1.1% | 1.4% | 2.1% | 1.8% | 0.7% |
| 5,000-9,999 | 1.4% | 1.5% | 1.4% | 1.6% | 2.1% | 1.8% | 0.7% |
| 2,500-4,999 | 1.9% | 1.8% | 1.2% | 1.2% | 2.1% | 1.8% | 0.7% |
| <2,500 | 0.6% | 0.7% | 0.8% | 0.9% | 2.1% | 1.8% | 0.7% |
Figure 7: Reinvestment medians by cost factor and size 2019 – 2022
| 2019 | 2020 | 2021 | 2022 | 2002 Upper Quartile | 2022 Median | 2022 Quartile | |
|---|---|---|---|---|---|---|---|
| LSVT < 12 yr | 14.1% | 14.8% | 13.2% | 12.03% | 8.6% | 6.5% | 4.7% |
| London | 4.8% | 6% | 4.4% | 5.35% | 8.6% | 6.5% | 4.7% |
| SH Provider | 4.2% | 4.4% | 4.1% | 6.1% | 8.6% | 6.5% | 4.7% |
| HOP Provider | 4.9% | 8.6% | 5.9% | 4.54% | 8.6% | 6.5% | 4.7% |
| > 30,000 | 6.3% | 7.6% | 5.1% | 6.35% | 8.6% | 6.5% | 4.7% |
| 20,000-29,999 | 5.5% | 5.9% | 5.2% | 6.04% | 8.6% | 6.5% | 4.7% |
| 10,000-19,999 | 6.8% | 7.3% | 7.1% | 7.58% | 8.6% | 6.5% | 4.7% |
| 5,000-9,999 | 6.9% | 6.7% | 5.9% | 7.24% | 8.6% | 6.5% | 4.7% |
| 2,500-4,999 | 6.7% | 6.7% | 5% | 6.49% | 8.6% | 6.5% | 4.7% |
| < 2,500 | 4.3% | 5.6% | 4.6% | 4.71% | 8.6% | 6.5% | 4.7% |
Figure 8: Headline social housing cost per unit medians by cost factor and size 2019 - 2022
| 2019 | 2020 | 2021 | 2022 | 2002 Upper Quartile | 2022 Median | 2022 Quartile | |
|---|---|---|---|---|---|---|---|
| LSVT < 12 yr | £4.11k | £3.95k | £3.98k | £4.93k | £5.18k | £4.15k | £4.42k |
| London | £6.07k | £6.2k | £6.2k | £6.76k | £5.18k | £4.15k | £4.42k |
| SH Provider | £8.46k | £9.90k | £9.68k | £8.4k | £5.18k | £4.15k | £4.42k |
| HOP Provider | £6.15k | £6.44k | £5.55k | £5.77k | £5.18k | £4.15k | £4.42k |
| > 30,000 | £3.88k | £3.88k | £3.7k | £4.08k | £5.18k | £4.15k | £4.42k |
| 20,000-29,000 | £3.38k | £3.54k | £3.54k | £3.87k | £5.18k | £4.15k | £4.42k |
| 10,000-19,999 | £3.52k | £3.6k | £3.37k | £3.89k | £5.18k | £4.15k | £4.42k |
| 5,000-9,999 | £3.55k | £3.74k | £3.65k | £4.01k | £5.18k | £4.15k | £4.42k |
| 2,500-4,999 | £4.15k | £3.96k | £3.94k | £4.42k | £5.18k | £4.15k | £4.42k |
| < 2,500 | £4.88k | £4.6k | £4.79k | £4.96k | £5.18k | £4.15k | £4.42k |
Size of provider
4.6 The relationship between organisational size and the VFM metrics is complex. Each size band has very distinctive characteristics. Registered providers in the larger groups tend to include traditional and LSVT organisations who have matured beyond 12 years and grown organically or through mergers or acquisitions over the past five years. Figure 9 shows how the provider size groups have changed over the past five years.
Figure 9: Percentage of social stock owned by each size cohort 2018 - 2022
| Year | <2,500 | 2,500-4,999 | 5,000-9,999 | 10,000-1999 | 20,000-29,999 | >30,000 |
|---|---|---|---|---|---|---|
| 2018 | 2.8 | 6 | 15.1 | 23 | 20.4 | 32.7 |
| 2019 | 2.7 | 5.4 | 14.4 | 19.6 | 13.3 | 44.5 |
| 2020 | 2.7 | 5.2 | 13.6 | 18 | 13.2 | 47.3 |
| 2021 | 2.7 | 4.3 | 13.5 | 18.2 | 14 | 47.3 |
| 2022 | 2.2 | 4.3 | 13.1 | 17.3 | 11.9 | 51.2 |
4.7 In 2022, the percentage of stock owned by providers with over 30,000 homes increased to just over 50% for the first time. With the exception of the over 30,000 and the under 2,500 [footnote 22] size groups, the number of providers in all other size groups has remained relatively stable. Providers in the largest group with over 30,000 homes delivered 51% of new supply social units and continue to develop the vast majority of market facing activity including outright sales and market rent. Of the 5,552 non-social supply units delivered in the year, 71% were developed by providers with more than 30,000 homes.
4.8 Performance by providers in the sub-group with between 10,000 and 19,999 homes had a higher than average reinvestment outturn of 7.6% - around a half of providers in this size group are based in the North of England which has a higher proportion of LSVT organisations that are less than 12 years old when compared to other size groups. This means they are still undertaking significant investment in their stock in the early years following transfer from the local authority sector.
4.9 Providers with between 5,000 and 9,999 homes delivered 13% of total new supply social units in the year, in proportion to the size of their existing stockholding. This group has lower than average headline costs which is not surprising given its composition, which includes a lower number of supported housing and housing for older people homes when compared to other size groups. As a result, this group of providers tend to have proportionately higher financial capacity to deliver new homes.
Cost factor
Supported housing and housing for older people
4.10 Registered providers whose primary activity is supported housing and housing for older people have very different reported performance on the metrics compared to the sector as a whole. While there are only a relatively small number of supported housing and housing for older people homes in the sector, compared to the number of general needs homes, they have significant influence on performance, because of the high cost of providing supported housing services. While overall costs fell by 13% to £8,400 per unit (2021: £9,680 per unit) in the year, this was primarily driven by the merger of two specialist providers with a strategic aim of generating greater efficiencies and higher margins.
4.11 The headline social housing cost per unit remains much higher for supported housing providers than other organisations. When compared to supported housing providers, the headline costs associated with housing for older people is 46% lower at £5,770 per unit (2021: £5,550), despite rising inflation. The lower than average increase is primarily driven by a small merger undertaken in the year.
4.12 Operating margins (Overall) are lower for supported housing providers, this is associated with the provision of additional care services that are not classified as social housing. Unsurprisingly, the operating margin (Overall) of 5.2% for supported housing providers is lower than for providers who deliver housing for older people (13.4%). Both categories have lower operating margins than the sector as a whole.
4.13 These low margins mean most supported housing providers have limited financial headroom in which to service debt, and lower levels of gearing compared to the rest of the sector.
4.14 The reinvestment outturn for supported housing providers for the year was 6.1% compared to 4.1% in 2021 and was largely driven by works to existing stock which increased by 73%. This included a mix of capitalised compliance works and component replacement. Similar to Headline costs, reinvestment delivered by the housing for older people sub-group is 4.5% compared to 5.9% in 2021 as a result of the merger referred to above – one of the merged entities had the highest level of reinvestment into existing stock in 2021.
Large scale voluntary transfers – less than 12 years old
4.15 LSVT organisations are characterised by very high levels of reinvestment, low margins and EBITDA MRI interest cover. These organisations are contractually obliged to undertake major improvement and regeneration works to the properties transferred within a certain period of time and therefore have the higher reinvestment levels compared to the rest of the sector.
4.16 The median level of reinvestment into new development and existing stock fell from a peak of 14.8% in 2020 to 12.0% in 2022. This is due to lower levels of reinvestment into existing stock by providers as the organisations mature. There have been no new stock transfers since 2015, so the average age of this group has increased, and some will have now completed the work specified in their transfer agreements.
5. Regional analysis
Overview
5.1 The regional section of this report aims to provide more detailed insight into the difference between performance across regions in England with a key focus on Reinvestment, New supply delivery and Headline cost measures. The supplementary data should also further Boards’ understanding of how their organisation’s performance compares to providers in a similar area of operation. In contrast to the sub-sector analysis, the number of providers across each region of operation has remained broadly constant [footnote 24] over the past three years and provides a more consistent basis on which to compare performance.
5.2 Understanding performance across all regions in England is also complex. Regional performance will be driven to some extent by local social or political policies, or underlying factors such as property values [footnote 25].
5.3 Other factors that impact performance are areas of operation where wages and deprivation [footnote 26] have a significant influence; for example, there is evidence that operating margins for providers with stock in the most deprived areas, which includes some parts of London, are lower when compared to providers with stock in the least deprived areas.
Table 6: Summary of metrics by region
| Median | No of RPs | % of sector (social units owned) | New supply (social) | New supply (non-social) | Gearing | EBITDA MRI interest rate cover | Headline social housing cost per unit (£k) | operating margin (social) | operating margin | ROCE | |
|---|---|---|---|---|---|---|---|---|---|---|---|
| East Midlands | 8 | 2.7% | 7.9% | 2.1% | 0.03% | 48.6% | 168% | £3.76 | 26.6% | 24.3% | 3.2% |
| East of England | 20 | 6.0% | 7.0% | 2.1% | 0.00% | 52.8% | 161% | £3.93 | 28.0% | 26.7% | 3.5% |
| London | 26 | 10.6% | 5.3% | 1.0% | 0.00% | 43.1% | 92% | £6.76 | 20.3% | 15.0% | 2.2% |
| Mixed | 24 | 27.7% | 5.9% | 1.3% | 0.04% | 43.9% | 134% | £5.03 | 23.5% | 20.2% | 2.8% |
| North East | 10 | 5.6% | 6.9% | 1.1% | 0.00% | 43.1% | 222 | £3.72 | 23.8% | 22.3% | 3.7% |
| North West | 36 | 17.0% | 7.9% | 0.9% | 0.00% | 42.3% | 155% | £3.89 | 21.8% | 19.6% | 3.4% |
| South East | 20 | 10.1% | 5.4% | 1.9% | 0.01% | 51.8% | 151% | £4.13 | 28.3% | 27.0% | 3.5% |
| West Midlands | 22 | 8.9% | 7.0% | 1.6% | 0.00% | 46.2% | 141 | £4.07 | 24.4% | 19.4% | 3.4% |
| Yorkshire and the Humber | 16 | 5.7% | 6.7% | 1.1% | 0.00% | 41.6% | 137% | £3.88 | 18.7% | 15.4% | 2.3% |
| England | 200 | 100.0% | 6.5% | 1.4% | 0.00% | 44.1% | 146% | £4.15 | 23.3% | 20.5% | 3.2% |
Figure 10: Reinvestment component and average property values by region 2022
| Reinvestment % | ||||
|---|---|---|---|---|
| Region | Reinvestment median | Existing stock (weighted average) | Development and other (weighted average) | Average property value £k) |
| North East | 6.9% | 2.4% | 4.8% | £31.56 |
| Yorkshire and the Humber | 6.7% | 1.7% | 4.7% | £34.98 |
| North West | 7.9% | 1.92% | 5.6% | £36.55 |
| West Midlands | 7% | 1.2% | 6.3% | £49.10 |
| East Midlands | 7.9% | 1.3% | 6.3% | £49.88 |
| South West | 6.8% | 1.3% | 6% | £53.08 |
| East of England | 7% | 1.3% | 6.5% | £62.98 |
| Mixed | 5.9% | 1.3% | 4.6% | £69.22 |
| South East | 5.4% | 0.8% | 5% | £78.15 |
| London | 5.3% | 0.9% | 4.3% | £121.30 |
5.4 Property values are a key component of the reinvestment metric and will vary by geographical location. This means regions with higher property values must invest more in absolute terms to generate a similar reinvestment outturn to providers in regions where property values are lower.
5.5 There are wide differences between regions with the highest level of new supply (social) and reinvestment into existing housing stock which is demonstrated in figure 10. The East Midlands and the North West have the highest median reinvestment, although this is partly driven by both regions having lower than average property values which inflates their reinvestment metric. Almost 45% of providers in the North West region have reinvestment levels above the sector’s upper quartile of 8.6%.
5.6 The North East region has the highest investment in to existing stock (weighted average). While all providers in the North East region have higher than average investment into existing stock, average property values are 50% lower compared to the sector average which has the effect of inflating investment when measured as a proportion of the existing assets.
5.7 The East of England region has the highest development average of 6.5% (weighted average) contributing to the fact that providers in this region are highly geared at 52.8% when compared to the sector average of 44.1%.
5.8 London has the highest spend per unit on existing stock and development. There is evidence to suggest this is partly driven by higher than average labour costs and by supported housing and housing for older people organisations in the region investing heavily in existing stock. However, London and the South East also have higher than average property values which deflates the overall reinvestment performance. Reinvestment as a percentage of the value of existing assets is therefore lower than in any other regions despite the high level of reinvestment in absolute terms.
New supply
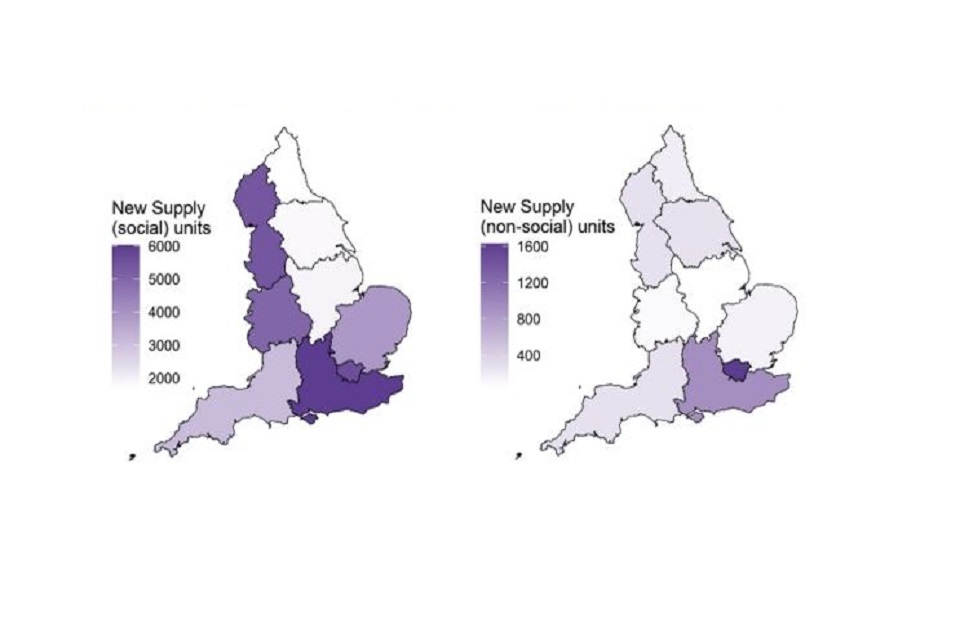
Figure 11: Number of new social and non-social units supplied by region
5.9 The development of new supply social and non-social as a proportion of total stock is variable across each region and intuitively correlates with housing demand - Private registered provider social housing stock and rents in England 2021 to 2022. For example, in the North East we would expect to see less demand as rents in this region are closest to market rent.
5.10 Providers in London, the South-East and Mixed regions [footnote 27] delivered almost half of the sector’s new supply social units and three quarters of the non-social supply units. Meanwhile, the number of new supply social units in the South-East and London increased by 30% and 14% respectively as COVID-19 restrictions eased.
5.11 New supply social grew by 41% in the West Midlands, this compares to a fall of 19% between 2020 and 2021 during the peak of the COVID-19 pandemic. One large provider delivered almost one quarter of the region’s new supply which explains the variance between the new supply social median of 1.6% and the regions weighted average of 2.0%.
Figure 12: New supply (social %) weighted average by region
| Region | weighted average (%) |
|---|---|
| Sector weighted average | 1.6 |
| East Midlands | 2.5 |
| East of England | 2.3 |
| London | 1.8 |
| Mixed | 1.4 |
| North East | 1.1 |
| North West | 1.1 |
| South East | 2.0 |
| South West | 1.9 |
| West Midlands | 2.0 |
| Yorkshire and the Humber | 1.1 |
Headline social housing costs
Figure 13: Median headline social housing cost per unit by region 2021-22 (£k)
| 2021 | 2022 | |
|---|---|---|
| East Midlands | 3.34 | 3.76 |
| East of England | 3.52 | 3.93 |
| London | 6.2 | 6.76 |
| Mixed | 4.44 | 5.03 |
| North East | 3.16 | 3.72 |
| North West | 3.54 | 3.89 |
| South East | 3.93 | 4.13 |
| South West | 3.71 | 4.23 |
| West Midlands | 3.40 | 4.07 |
| Yorkshire and the Humber | 3.30 | 3.88 |
5.12 The headline social housing cost variance across each region broadly follows the difference in underlying regional wages once all factors are taken together.
5.13 Headline costs in the West Midlands increased by almost 20% in the year. The variance between the median headline costs of £4,070 and the sector weighted average of £3,830 is largely driven by the major repairs and maintenance expenditure component.
5.14 Unsurprisingly the North-East region has the lowest median headline cost of £3,720 per unit despite costs rising by almost 18% compared to 2021. In contrast, headline costs in London continue to be higher than any other region although they increased at a lower rate of 9%.
Return on capital employed
5.15 There continues to be a moderate degree of variance in ROCE performance which is influenced by movements in total operating surplus including the gain or loss from disposal of fixed assets, joint ventures, and property values in each region. For example, London has higher property values, and needs higher operating surplus in absolute terms to generate a similar ROCE outturn compared to providers in other regions where property values are lower.
Figure 14: Return on capital employed by region
| region | 2021 ROCE median | 2022 ROCE median | Operating margin (overall) weighted average |
|---|---|---|---|
| East Midlands | 3.6 | 3.2 | 21.7 |
| East of England | 3.6 | 3.5 | 27.1 |
| London | 2.1 | 2.2 | 15.5 |
| Mixed | 3.3 | 2.8 | 19.6 |
| North East | 3.5 | 3.7 | 20.7 |
| North West | 3.7 | 3.4 | 17.5 |
| South East | 3.5 | 3.5 | 24.9 |
| South West | 3.5 | 2.9 | 19.7 |
| West Midlands | 3.9 | 3.4 | 21.5 |
| Yorkshire and the Humber | 3.1 | 2.3 | 11 |
5.16 As expected, ROCE fell across each region with the exception of London and the North East where there was a marginal increase in the year and in the South East where the outturn remained stable at 3.5%. The higher return in the North East region relates to an increase in operating surplus and is unaffected by the change in asset values.
6. Regulatory approach
6.1 The regulator has always made clear that it is for Boards to decide how they run their businesses and assure themselves that they are complying with the regulatory standards. It is important that Boards should understand the range of factors that influence performance in order that they challenge the performance of their own organisation.
6.2 The demands on registered providers are increasing as the expectations from Government and tenant’s change. In considering whether the organisation delivers VFM, Boards must be clear regarding the delivery of their outcomes. The regulator will continue to seek assurance that providers make the best use of their resources and their assets and have clear plans in place to make ongoing improvements to the VFM in their organisations.
6.3 As part of all In-Depth Assessments, the regulator will seek assurance around the robustness of decision-making and Board challenge on key areas of operational performance, and on overall strategic delivery performance. This includes for instance consideration around investment into services or business streams in the delivery of their own strategic objectives.
6.4 The regulator will use the VFM metrics to identify cases which may indicate a lack of assurance on VFM performance. In such cases we may need to engage with registered providers to seek further assurance that the organisation is meeting the requirements of the Standard. Where we evidence material weaknesses, we will reflect this in our regulatory judgements.
Annex A: Summary of value for money metrics and methodology
This publication, along with the VFM metrics dataset, provides registered providers with a useful comparative baseline for annual reporting and monitoring of trends. The dataset includes the metrics for all not-for-profit private registered providers that own or manage more than 1,000 properties and with a financial year end of 31 March 2022 or 31 December 2021. This excludes two providers with non-standard financial year ends. The metrics are provided at both a group and an entity level, however only group level data was used in the analysis. For consistency, the metrics for individual registered providers have been calculated on the basis set out in the regulator’s metrics technical note, using the FVA electronic accounts data submitted by registered providers.
The analysis for 2022 is based on 200 registered providers compared to 208 in 2021 and 210 in 2020, this represents more than 95% of the sector’s stock.
The vast majority of the value for money metrics are set at a group level and take account of registered providers’ core activities, which for most registered providers include the provision of social housing lettings. The metrics also take account of non-social housing activities in unregistered subsidiaries and joint ventures [footnote 28] which provide a comprehensive assessment of registered providers’ performance. The exception to this is the delivery of new non-social housing through joint ventures, which is excluded for consistency reasons.
We encourage registered providers to use the regulator’s published metrics to benchmark and challenge performance against relevant peer groups, both at a sector and sub-sector level. The latest VFM metrics dataset is available on the website with this report.
Quoted quartile ranges apply to performance on individual metrics, so a provider may be in the upper quartile for one metric and the lower quartile for another.
Table 7: The Value for Money metrics
| Metric | Subdivision – consolidated or social housing | Metric description | |
|---|---|---|---|
| 1 | Reinvestment % (in existing homes and new homes) | Consolidated | Scale of investment into existing housing and acquisition or development of new housing in relation to the size of the asset base. |
| 2 | New supply delivered % | Consolidated and social housing | Units acquired or developed in-year as a proportion of existing stock [footnote 29] |
| 3 | Gearing % | Consolidated | Proportion of borrowing in relation to size of the asset base. |
| 4 | EBITDA MRI interest cover | Consolidated | The regulator’s measure of Interest Cover - it measures the ability of registered providers to cover ongoing finance costs. |
| 5 | Heading social housing cost per unit | Social housing only | Social housing operating costs per unit |
| 6 | Operating margin % | Consolidated and social housing | Operating surplus (deficit) divided by turnover (demonstrates the profitability of operating assets) |
| 7 | Return on capital employed % | Consolidated | Surplus/(deficit) plus disposal of fixed assets plus profit /(loss) of joint ventures compared to total assets. |
Table 8: Headline social housing cost regression cost breakdown (2017 prices)
Table 8 highlights the additional headline social housing cost per unit associated with owning or managing a property that meets one of the measurable cost factors. For example, the average supported housing property is associated with costs of £6,700 per unit above a general needs property.
The results are derived from the 2018 regression analysis undertaken by the Regulator of Social Housing with the costs quoted being in 2017 prices. The figures should help to provide useful context for the analysis of headline social housing cost per unit included within the sub-sector analysis section.
| Cost factor | Associated headline social housing cost per unit £ |
|---|---|
| Baseline [footnote 31] | £3,300 |
| Supported housing unit | +£6,700 |
| Housing for older people unit | +£1,400 |
| ASHE wage – London vs England average | +£1,900 |
| LSVT <7 years | +£1,100 |
| LSVT 7-12 years | +£100 |
| Indices of multiple deprivation – Most deprived 1% of areas vs median [footnote 32] | +£350 |
Annex B: Tables to complement figures
Table 9: Summary of sector trends (2019 - 2022: Providers owning / managing more than 1,000 homes)
| VFM metric | Reinvestment | New supply (social) [footnote 33] | New supply (non-social) | Gearing | EBITDA MRI interest cover | Headline social housing cost per unit (£K) | Operating margin (social) | Operating margin | Return on capital employed | |
|---|---|---|---|---|---|---|---|---|---|---|
| Upper quartile | 2022 | 8.60% | 2.10% | 0.09% | 53.10% | 198% | £5.18 | 28.50% | 25.40% | 3.90% |
| 2021 | 8.20% | 2.00% | 0.09% | 53.30% | 248% | £4.76 | 32.60% | 28.20% | 4.20% | |
| 2020 | 10.00% | 2.40% | 0.15% | 54.70% | 227% | £4.86 | 32.30% | 28.60% | 4.40% | |
| 2019 | 8.70% | 2.50% | 0.13% | 53.90% | 238% | £4.69 | 34.60% | 30.80% | 4.70% | |
| Median | 2022 | 6.50% | 1.40% | 0.00% | 44.10% | 146% | £4.15 | 23.30% | 20.50% | 3.20% |
| 2021 | 5.80% | 1.30% | 0.00% | 43.90% | 183% | £3.73 | 26.30% | 23.90% | 3.30% | |
| 2020 | 7.20% | 1.50% | 0.00% | 44.00% | 170% | £3.83 | 25.70% | 23.10% | 3.40% | |
| 2019 | 6.20% | 1.50% | 0.00% | 43.40% | 184% | £3.69 | 29.20% | 25.80% | 3.80% | |
| Lower quartile | 2022 | 4.70% | 0.70% | 0.00% | 32.10% | 107% | £3.70 | 17.60% | 14.30% | 2.40% |
| 2021 | 4.00% | 0.50% | 0.00% | 32.90% | 134% | £3.21 | 22.20% | 18.10% | 2.70% | |
| 2020 | 4.90% | 0.70% | 0.00% | 33.00% | 126% | £3.34 | 20.80% | 18.10% | 2.60% | |
| 2019 | 4.20% | 0.60% | 0.00% | 32.60% | 139% | £3.18 | 23.10% | 20.00% | 3.00% | |
| Weighted average | 2022 | 6.30% | 1.60% | 0.18% | 47.00% | 128% | £4.60 | 25.30% | 19.60% | 2.90% |
| 2021 | 5.70% | 1.40% | 0.22% | 47.20% | 151% | £4.15 | 28.30% | 22.30% | 3.10% | |
| 2020 | 7.60% | 1.80% | 0.31% | 47.70% | 138% | £4.25 | 27.80% | 22.10% | 3.20% | |
| 2019 | 6.40% | 1.60% | 0.31% | 46.70% | 153% | £4.12 | 30.50% | 25.00% | 3.60% |
Table 10: Sector-level reinvestment broken down by investment type
| Sector | |||||
|---|---|---|---|---|---|
| Reinvestment (median) | Reinvestment (weighted average) | Works to existing (weighted average) | Development and other (weighted average) | Housing properties at cost or valuation (£bn) | |
| 2022 | 6.49% | 6.28% | 1.25% | 5.03% | £172.07 |
| 2021 | 5.77% | 5.72% | 0.94% | 4.79% | £165.54 |
| 2020 | 7.22% | 7.58% | 1.21% | 6.38% | £160.37 |
| 2019 | 6.24% | 6.40% | 1.27% | 5.13% | £150.80 |
| 2019 - 2022 % change | 4.00% | -1.90% | -1.70% | -2.00% | 14.10% |
| 2021 - 2022 % change | 12.40% | 9.60% | 33.20% | 5.00% | 3.90% |
Table 11: Sector-level headline social housing cost per unit by cost type
| Weighted average | ||||||
|---|---|---|---|---|---|---|
| 2019 | 2020 | 2021 | 2022 | 2019-22 % change | 2021-22 % change | |
| Management | £1,045 | £1,068 | £1,075 | £1,104 | 5.6% | 2.7% |
| Service charges | £626 | £662 | £678 | £701 | 12.0% | 3.4% |
| Maintenance and major repairs | £1,965 | £2,051 | £1,926 | £2,302 | 17.2% | 19.5% |
| Other | £481 | £468 | £470 | £491 | 2.1% | 4.4% |
| HSHC | £4,118 | £4,249 | £4,150 | £4,599 | 11.7% | 10.8% |
Table 12: Summary of sector trends (2019-2022) by region
| Medians | England | East Midlands | East of England | London | Mixed | North East | North West | South East | South West | West Midlands | Yorkshire and the Humber | |
|---|---|---|---|---|---|---|---|---|---|---|---|---|
| Reinvestment | 2022 | 6.50% | 7.90% | 7.00% | 5.30% | 5.90% | 6.90% | 7.90% | 5.40% | 6.80% | 7.00% | 6.70% |
| 2021 | 5.80% | 8.70% | 6.70% | 4.40% | 4.60% | 5.70% | 6.80% | 4.90% | 5.60% | 5.70% | 5.40% | |
| 2020 | 7.20% | 8.30% | 8.20% | 6.00% | 6.50% | 7.90% | 7.30% | 7.60% | 8.70% | 5.40% | 6.90% | |
| 2019 | 6.20% | 7.20% | 8.20% | 4.80% | 4.60% | 5.80% | 6.00% | 6.50% | 6.80% | 6.00% | 7.10% | |
| New supply (social) | 2022 | 1.40% | 2.10% | 2.10% | 1.00% | 1.30% | 1.10% | 0.90% | 1.90% | 1.90% | 1.60% | 1.10% |
| 2021 | 1.30% | 2.20% | 1.80% | 0.70% | 1.30% | 0.90% | 0.80% | 1.50% | 1.90% | 1.30% | 1.00% | |
| 2020 | 1.50% | 2.20% | 2.40% | 1.30% | 1.50% | 1.20% | 0.80% | 2.40% | 1.70% | 1.60% | 1.70% | |
| 2019 | 1.50% | 2.30% | 2.50% | 1.40% | 1.50% | 0.60% | 0.70% | 2.20% | 1.90% | 1.90% | 1.40% | |
| Headline social housing cost per unit (£k) | 2022 | £4.15 | £3.76 | £3.93 | £6.76 | £5.03 | £3.72 | £3.89 | £4.13 | £4.23 | £4.07 | £3.88 |
| 2021 | £3.73 | £3.34 | £3.52 | £6.20 | £4.44 | £3.16 | £3.54 | £3.93 | £3.71 | £3.40 | £3.30 | |
| 2020 | £3.83 | £3.44 | £3.56 | £6.20 | £4.52 | £3.40 | £3.65 | £3.84 | £3.64 | £3.49 | £3.48 | |
| 2019 | £3.69 | £3.16 | £3.41 | £6.07 | £4.53 | £3.37 | £3.50 | £3.61 | £3.44 | £3.40 | £3.53 | |
| Operating margin (social) | 2022 | 23.30% | 26.60% | 28.00% | 20.30% | 23.50% | 23.80% | 21.80% | 28.30% | 21.70% | 24.40% | 18.70% |
| 2021 | 26.30% | 26.90% | 33.00% | 23.70% | 24.90% | 26.00% | 25.40% | 34.40% | 28.30% | 27.20% | 22.90% | |
| 2020 | 25.70% | 29.10% | 30.90% | 23.70% | 23.60% | 26.10% | 23.30% | 34.80% | 25.50% | 31.70% | 22.40% | |
| 2019 | 29.20% | 29.90% | 33.60% | 26.30% | 25.80% | 25.70% | 25.90% | 38.00% | 31.50% | 33.20% | 22.80% | |
| Return on capital employed | 2022 | 3.20% | 3.20% | 3.50% | 2.20% | 2.80% | 3.70% | 3.40% | 3.50% | 2.90% | 3.40% | 2.30% |
| 2021 | 3.30% | 3.60% | 3.60% | 2.10% | 3.30% | 3.50% | 3.70% | 3.50% | 3.50% | 3.90% | 3.10% | |
| 2020 | 3.40% | 4.10% | 3.80% | 2.40% | 3.10% | 3.90% | 3.60% | 3.30% | 3.40% | 4.30% | 3.10% | |
| 2019 | 3.80% | 4.10% | 4.00% | 2.80% | 3.50% | 3.60% | 4.40% | 3.80% | 3.90% | 4.70% | 3.00% |
Table 13: Reinvestment with component breakdown and average property values by region 2022
| Reinvestment | |||||||||
|---|---|---|---|---|---|---|---|---|---|
| Median | Weighted average | Existing stock (weighted average) | Development and other (weighted average) | Reinvestment per unit | Existing stock | Development and other (per unit) | Average property value (£k) | ||
| Regions | East Midlands | 7.90% | 7.60% | 1.30% | 6.30% | £3.81 | £0.64 | £3.16 | £49.88 |
| East of England | 7.00% | 7.80% | 1.30% | 6.50% | £4.94 | £0.81 | £4.12 | £62.98 | |
| London | 5.30% | 5.20% | 0.90% | 4.30% | £6.32 | £1.09 | £5.23 | £121.30 | |
| Mixed | 5.90% | 5.90% | 1.30% | 4.60% | £4.05 | £0.90 | £3.15 | £69.22 | |
| North East | 6.90% | 7.20% | 2.40% | 4.80% | £2.27 | £0.77 | £1.50 | £31.56 | |
| North West | 7.90% | 7.50% | 1.90% | 5.60% | £2.76 | £0.69 | £2.06 | £36.55 | |
| South East | 5.40% | 5.80% | 0.80% | 5.00% | £4.50 | £0.62 | £3.88 | £78.15 | |
| South West | 6.80% | 7.30% | 1.30% | 6.00% | £3.87 | £0.67 | £3.20 | £53.08 | |
| West Midlands | 7.00% | 7.50% | 1.20% | 6.30% | £3.68 | £0.59 | £3.09 | £49.10 | |
| Yorkshire and the Humber | 6.70% | 6.40% | 1.70% | 4.70% | £2.25 | £0.60 | £1.66 | £34.98 | |
| England | 6.50% | 6.30% | 1.20% | 5.00% | £3.92 | £0.78 | £3.14 | £62.44 |
Table 14: New supply (social) by region
| Region of operation | New Supply (social) units | Total social units owned | New supply (social %) - median | New supply (social %) - weighted average | % Change in new supply (social) units 2021-2022 |
|---|---|---|---|---|---|
| East Midlands | 1,911 | 77,310 | 2.10% | 2.50% | 21% |
| East of England | 3,867 | 169,250 | 2.10% | 2.30% | 19% |
| London | 5,622 | 318,023 | 1.00% | 1.80% | 14% |
| Mixed | 11,056 | 798,414 | 1.30% | 1.40% | -9% |
| North East | 1,683 | 157,558 | 1.10% | 1.10% | 26% |
| North West | 5,397 | 483,743 | 0.90% | 1.10% | 22% |
| South East | 6,024 | 295,408 | 1.90% | 2.00% | 30% |
| South West | 3,111 | 162,587 | 1.90% | 1.90% | 4% |
| West Midlands | 5,049 | 249,691 | 1.60% | 2.00% | 41% |
| Yorkshire and the Humber | 1,822 | 161,812 | 1.10% | 1.10% | 5% |
| England | 45,542 | 2,873,796 | 1.40% | 1.60% | 12% |
Table 15: New supply (non-social) by region
| Region of operation | New supply (non-social) units | Total units owned | New supply (non-social %) - median | New supply (non-social %) - weighted average |
|---|---|---|---|---|
| East Midlands | 51 | 79,102 | 0.03% | 0.06% |
| East of England | 154 | 174,784 | 0.00% | 0.09% |
| London | 1,627 | 346,561 | 0.00% | 0.47% |
| Mixed | 1,676 | 859,753 | 0.04% | 0.19% |
| North East | 184 | 158,706 | 0.00% | 0.12% |
| North West | 281 | 496,931 | 0.00% | 0.06% |
| South East | 928 | 306,851 | 0.01% | 0.30% |
| South West | 285 | 165,788 | 0.00% | 0.17% |
| West Midlands | 97 | 256,216 | 0.00% | 0.04% |
| Yorkshire and the Humber | 269 | 163,749 | 0.00% | 0.16% |
| England | 5,552 | 3,008,441 | 0.00% | 0.18% |
Table 16: Headline social housing cost per unit by region
| Region of operation | Headline social housing cost - median (£K) | Headline social housing cost - weighted average (£k) | % Change in headline social housing cost - median (£k) |
|---|---|---|---|
| 2021-2022 | |||
| East Midlands | £3.76 | £4.24 | 12.50% |
| East of England | £3.93 | £4.16 | 11.60% |
| London | £6.76 | £6.66 | 9.10% |
| Mixed | £5.03 | £4.98 | 13.40% |
| North East | £3.72 | £3.64 | 17.80% |
| North West | £3.89 | £4.13 | 9.80% |
| South East | £4.13 | £4.30 | 5.00% |
| South West | £4.23 | £4.08 | 14.10% |
| West Midlands | £4.07 | £3.83 | 19.70% |
| Yorkshire and the Humber | £3.88 | £4.04 | 17.50% |
| England | £4.15 | £4.60 | 11.30% |
Annex C: Regional characteristics
Table 17 outlines the number of providers in each region and includes information on contextual factors that can help to explain some of the differential regional performances seen in the Regional analysis section.
Table 17: Providers by region
| Medians | No. of providers | % of sector (social units owned) | Supported housing provider | Housing for older people provider | > 30,000 | 20,000 - 29,999 | 10,000 - 19,999 | 5,000 - 9,999 | 2,500 - 4,999 | < 2,500 | LSVT < 12 Years |
|---|---|---|---|---|---|---|---|---|---|---|---|
| East Midlands | 8 | 2.70% | 1 | 1 | 0 | 1 | 1 | 4 | 0 | 2 | 0 |
| East of England | 20 | 6.00% | 0 | 0 | 1 | 0 | 4 | 8 | 5 | 2 | 0 |
| London | 26 | 10.60% | 3 | 0 | 3 | 0 | 1 | 7 | 3 | 12 | 0 |
| Mixed | 24 | 27.70% | 5 | 4 | 13 | 1 | 2 | 1 | 4 | 3 | 0 |
| North East | 10 | 5.60% | 1 | 0 | 1 | 2 | 3 | 1 | 1 | 2 | 1 |
| North West | 36 | 17.00% | 1 | 0 | 3 | 3 | 12 | 12 | 3 | 3 | 5 |
| South East | 20 | 10.10% | 0 | 1 | 3 | 2 | 2 | 10 | 1 | 2 | 1 |
| South West | 18 | 5.70% | 2 | 0 | 2 | 0 | 2 | 4 | 7 | 3 | 1 |
| West Midlands | 22 | 8.90% | 2 | 0 | 2 | 3 | 3 | 4 | 5 | 5 | 0 |
| Yorkshire and the Humber | 16 | 5.70% | 0 | 0 | 2 | 1 | 3 | 2 | 2 | 6 | 0 |
| England | 200 | 100.00% | 15 | 6 | 30 | 13 | 33 | 53 | 31 | 40 | 8 |
Annex D: Cost factor and size cohort sizes (2019-2022)
Table 18 outlines the number of providers included in each cost factor and size cohort in each of the years 2019 to 2022 which provides some context as to how the cohorts have changed over time.
Table 18: Number of providers included in each cost factor and size cohort (2019-2022)
| No. of providers | |||||
|---|---|---|---|---|---|
| 2019 | 2020 | 2021 | 2022 | ||
| Cost factor | LSVT < 12 yr. | 17 | 12 | 9 | 8 |
| London | 28 | 27 | 26 | 26 | |
| SH provider | 17 | 16 | 16 | 15 | |
| HOP provider | 7 | 7 | 7 | 6 | |
| Size (Social units owned) | > 30,000 | 25 | 27 | 27 | 30 |
| 20,000 - 29,999 | 14 | 14 | 15 | 13 | |
| 10,000 - 19,999 | 37 | 34 | 35 | 33 | |
| 5,000 - 9,999 | 55 | 53 | 54 | 53 | |
| 2,500 - 4,999 | 38 | 37 | 31 | 31 | |
| < 2,500 | 48 | 45 | 46 | 40 |
-
This report is based on the annual maximum rent increase of CPI +1% for most properties as at September 2020 (CPI was 0.5%), and does not reflect the rent settlement for 2023/24. Rent increases will be capped at 7% for one year from March 2023 for most social and Affordable rented homes. The restriction does not apply to supported housing, or where social or affordable rent homes are first let or re-let, where rents can be increased by CPI plus 1%. ↩
-
The VFM metrics are restricted to data derived from registered providers’ Annual Accounts regulatory returns (FVA), New Supply developed by Joint Ventures are therefore excluded from the New Supply (Non-social) measure. ↩
-
This is the regulator’s measure of Interest Cover - Earnings Before Interest Tax Depreciation and Amortisation inclusive of all major repair costs. ↩
-
The analysis is based on 200 large, registered providers’ accounts (and excludes For-profit providers and Local Authorities). ↩
-
Summary of trends table see Annex B table 9. ↩
-
Includes development of new properties, newly built properties acquired, schemes completed (capitalised interest costs. ↩
-
The works to existing properties includes the amount of expenditure incurred which relates to an improvement, which is defined as an increase in the net rental stream, or the life of a property has been capitalised. ↩
-
A measure of net debt as a percentage of the total asset base. ↩
-
Annual changes in performance on HSHC can be found in Annex B. ↩
-
Maintenance and major repairs include capitalised repairs ↩
-
‘Other’ includes: Lease costs, Other (social housing letting) costs, Development services (Operating expenditure), Community /neighbourhood services (Operating expenditure), Other social housing activities: Other (Operating expenditure), Charges for support services (Operating expenditure) ↩
-
Business plans are commercially sensitive. The 2022 business plans are representative of economic and policy factors as at June 2022 and as such are likely to change significantly. ↩
-
The y-axis has been truncated at £15k to increase resolution. Above this there are four data points between £22k and £28k. These are three supported housing providers and one housing for older people provider ↩
-
Social rent reduction under WRWA was in 2015. Introduction of the rent policy statement in 2021. ↩
-
This excludes all For-profit registered providers and registered providers with year ends other than 31 March 2022 ↩
-
The transfer of housing stock form Local Authorities to registered providers ↩
-
Commentary on providers based in London is discussed under regional analysis ↩
-
Regression analysis is a standard statistical method used to explain the relationship between the VFM metrics and the explanatory variables. The additional cost associated with providing a unit of Supported housing and/ or Housing for older people should not be used by registered providers as a basis for setting rents. Rents must be set in accordance with the Government’s Policy Statement on Rents for Social Housing 2022. ↩
-
The number of providers in this size group has reduced by six providers all of whom had higher than average headline costs in 2021. ↩
-
Registered providers are assigned to a region based on where most of its social housing stock owned is located – that is 50% of stock in a single region. Most providers operate mainly in one region. Providers who have less than 50% of stock in any one region are defined as mixed providers. ↩
-
The number of providers in each region is further explained in Annex C table 17. ↩
-
Total tangible fixed assets (not market valuations) ↩
-
Mixed – 29% of this cohort have at least one quarter of their stock on London. ↩
-
The VFM metrics are restricted to data derived from registered providers’ Annual Accounts regulatory returns (FVA) – New supply developed by joint ventures are therefore not included in the New supply (Non-social) metric. ↩
-
The VFM metrics are restricted to data derived from registered providers’ Annual Accounts regulatory returns – FVA – New supply developed by joint ventures is therefore not included in the new supply (non-social) metric. ↩
-
The costs associated with owning or managing a social housing unit are based on 2017 values. Nevertheless, the Regulator anticipates that the same cost factors associated with additional costs set out in table 12 remain relevant. ↩
-
This is based on a traditional provider with the median number of units all of which are general needs, operating in an area with average deprivation and wages. It is composed of the regression intercept (£2,900) plus the effect of average neighbourhood deprivation and stock holding. ↩
-
Provider level IMD deprivation score calculated by averaging IMD deprivation scores across the seven domains of deprivation, at a Lower Super Output Area level to obtain a LSOA deprivation score, and then mapping providers onto LSOAs using CORS letting data. ↩
-
New supply (social) is a measure of the number of new social units developed or acquired in the year divided by the total number of social units (including leasehold) owned. ↩