Value for Money metrics report - annex to Global Accounts 2020
Updated 13 May 2021
Applies to England

© Crown copyright 2021
This publication is licensed under the terms of the Open Government Licence v3.0 except where otherwise stated. To view this licence, visit nationalarchives.gov.uk/doc/open-government-licence/version/3 or write to the Information Policy Team, The National Archives, Kew, London TW9 4DU, or email: psi@nationalarchives.gov.uk.
Where we have identified any third party copyright information you will need to obtain permission from the copyright holders concerned.
This publication is available at https://www.gov.uk/government/publications/2020-global-accounts-of-private-registered-providers/value-for-money-metrics-report-annex-to-global-accounts-2020
Executive summary
1.1 As registered providers begin to adapt and consider the impact of a post-pandemic environment and other competing pressures, boards will be required to make difficult and often sensitive decisions in pursuit of existing or emergent strategies. During these uncertain times, it is imperative for boards to make effective decisions around the use of their assets and resources to achieve the strategic objectives of the business.
1.2 The VFM Standard requires providers to annually report on their performance against a suite of measures defined by the regulator. The requirements are amplified in the VFM Code of Practice. The regulator publishes this information annually in order that boards and other stakeholders can assess performance on these metrics and see how individual providers compare to other organisations.
1.3 The operating performance of the sector remains robust despite a backdrop of political and economic uncertainty and the demand for better quality homes. Over the past three years the sector’s performance has been affected by a combination of factors including the ongoing 1% rent reduction in England as well as increasing amounts of building safety expenditure.
The analysis for 2020 has shown the following at a sector level:
-
in comparison to previous years, reinvestment in to existing and new social housing stock has risen to its highest level across all quartiles;
-
the efficiency performance indicators show that the overall median operating margin and the operating margin from social housing lettings have fallen to 23% and 26% respectively, while the average Return on Capital Employed also fell slightly to 3.4% down from 3.8% compared to the previous year;
-
the average Headline Social Housing cost continues to increase across all quartiles – the median cost per unit has increased by 4% to £3,830 per unit;
-
while the sector remains committed to future growth, some areas of the country have seen a slowdown in market sales which means providers have increased borrowing to deliver new social housing supply. The median rate of New Supply (Social), is consistent with previous years at 1.5% while the weighted average rate of New Supply (Non-social) remained static at 0.3%.
1.4 The publication also provides additional analysis at a sub-sector level to provide more detailed insights into different types of registered providers. The analysis shows that there continues to be material differences in reported performance between different sub-groups. These differences tend to be influenced by factors such as geographical location, specialist care and support providers as well as Large Scale Voluntary Transfer organisations.
1.5 As registered providers were preparing their annual reports in 2020, they were also planning and responding to the demands of the coronavirus pandemic. In a move to support the sector during this difficult period, the regulator took a proportionate approach to reduce the regulatory burden on providers particularly around forward-looking VFM performance commentary. On that basis, this report does not comment on providers’ reporting in the accounts.
1.6 The impact of Covid-19 on registered providers businesses is not reflected in this report. We expect any additional costs incurred as a result of the pandemic will be recognised in the published accounts 2020/21.
1.7 The regulator adopts a co-regulatory approach. In the value for money context this means that it seeks assurance from providers as to how they are meeting the requirements of the Standard in terms of decision making and strategic approach. Reporting can provide valuable additional assurance of how effective this is in practice, as well as making the sector more transparent and accountable to its tenants and to other stakeholders.
Introduction
2.1 The unprecedented impact of Covid-19 along with a growing range of competing requirements have all increased demands on social housing providers. This means that boards will need to navigate an extremely difficult business environment, pivot quickly in response to emerging scenarios and think beyond the immediate challenges.
2.2 It is crucial that boards monitor progress against their organisations’ strategic objectives and targets. It is the responsibility of the board to evaluate and challenge its organisation’s performance to help determine whether its strategic goals are being met.
2.3 Reporting on performance in the accounts is a valuable platform that allows registered providers to demonstrate the value for money that their organisation delivers with the assets and resources that are available to them. It also enables stakeholders to assess the strategies and objectives adopted by providers and their potential to succeed.
2.4 Registered providers are required to measure their performance on value for money against their statutory objectives and priorities which are measured through a range of targets. Registered providers’ performance cannot be wholly judged by a set of performance measures alone and it is for this reason that they outline their broader achievements and also being clear where they fell short of their targets against their corporate priorities.
2.5 Making good decisions and being clear about priorities requires good information. One of the regulator’s key objectives in defining a set of standard metrics is to support transparency and allow providers and stakeholders to analyse their performance alongside that of their peers. These metrics, and their calculation, are summarised in Annex A below.
2.6 This publication summarises the metrics data for the sector as a whole and segments of the sector according to some of its characteristics (such as supported housing stock, housing for older people stock, stock transfer status and geographical location). It also provides commentary on some of the key themes emerging from the data. This summary information is intended to help registered providers and other interested stakeholders to contextualise the performance of individual providers and to benchmark organisations with particular characteristics.
2.7 The publication is divided into five discrete sections:
- Section 3 sets out our regulatory approach.
- Section 4 considers how providers should address the wider reporting requirements of the Standard, beyond the standard metrics.
- Section 5 presents the aggregate metrics results for the whole sector, including the quartile distributions for each metric.
- Section 6 looks at the metric performance for sub-sector groups, following the explanatory factors identified in previous analysis of cost variation in the sector.
- Section 7, this concluding section is a new addition to the report and looks at value for money performance at a regional level.
2.8 To supplement sector level performance the regulator also publishes providers’ performance on the range of VFM metrics to help organisations benchmark their performance more easily which can also be found with the Global Accounts.
2.9 The regulator does not have required benchmarks or targets for the standard VFM metrics. Some of them work against each other, and no provider is likely to be in the “best” quartile on all measures. The expectation is that providers will engage with the VFM metrics and present information which increases transparency and understanding.
Regulatory approach
3.1 The regulator has always made clear that it is for boards to decide how they run their businesses and assure themselves that they are complying with the regulatory standards. It is important that boards should understand the range of factors that influence performance in order that they challenge the performance of their own organisation.
3.2 The demands on registered providers are increasing as the expectations from government and tenants rise. In considering whether the organisation delivers value for money, boards must be clear regarding the delivery of their outcomes. The regulator will continue to seek assurance that providers make the best use of their resources and their assets and have clear plans in place to make ongoing improvements to the value for money in their organisations.
3.3 As part of all In-Depth Assessments, the regulator will seek assurance around the robustness of decision making and board challenge on key areas of operational performance, and on overall strategic delivery performance. This includes for instance consideration around investment into particular services or business stream in the delivery of their own strategic objectives.
3.4 The regulator will use the value for money metrics to identify cases which may indicate a lack of assurance on value for money performance. In such cases we may need to engage with registered providers to seek further assurance that the organisation is meeting the requirements of the Standard.
3.5 Registered providers must ensure that VFM reporting undertaken in the accounts meets all the reporting requirements of the Standard. Where we identify year-on-year performance reporting weaknesses, we will reflect this in our regulatory judgements.
Reporting in the accounts
4.1 The demand for disclosing business performance is growing. At the heart of the Social Housing White Paper is the Charter for Social Housing Residents. The Charter promises a range of measures and reforms which aims to improve accountability, quality and a more transparent relationship with tenants. Other external stakeholders also want better information on how organisations are performing against their strategies and objectives. This section seeks to address important issues on VFM reporting that the regulator has identified since the Standard was introduced to support boards to inspire stakeholder confidence in the future.
4.2 In a response to feedback that stakeholders have regarding value for money reporting in the accounts, the regulator does not have a set format for reporting against the requirements of the Standard. Registered providers are encouraged to use whichever format would best aid transparency. Decisions on what to report on lies with boards, including how much detail to include.
4.3 As long as the report captures all relevant reporting requirements including where a provider falls short of the requirements – providers should not feel obliged to follow any one reporting model. It is important that the information provided in the accounts is meaningful and that it provides stakeholders with a real understanding of an organisation’s performance.
4.4 All registered providers are required to comply with the reporting requirements of the Standard. The review must, to the extent necessary for an understanding of the development and performance of an organisation’s value for money achievements include:
I. the regulator’s suite of VFM metrics and any additional VFM measurements that would aid understanding of the organisation’s performance against a relevant peer group;
II. analysis on actual performance, previous years’ performance and targets against current and future forecasts;
III. where appropriate an explanation of underlying factors influencing performance, which must be factual and concise;
IV. where relevant provide information to the extent that sets out clear plans to address areas of underperformance [^1].
4.5 Registered providers are reminded that they are free to report on any additional measurements and information that they consider would help aid transparency to stakeholders outside of the accounts.
4.6 Despite the reduced requirements around commentary of providers’ value for money performance last year, it was good to see that registered providers are making a virtue of reporting the measures that are critical to an understanding of business performance and delivery against their chosen strategy.
4.7 Given the diverse range of activities that registered providers perform, the choice of reporting and measures used to monitor performance will be unique to each organisation. Over the past three years, the value for money statements that have provided the most valuable assurance have established relevant measures to assess progress against stated strategies and objectives.
4.8 Other areas of assurance that have been helpful to stakeholders include:
- Publishing information that allows stakeholders to track performance over time. This includes performance against each VFM measure when compared to the previous year, the actual target for the reporting year and forecast targets over the short term;
- Choosing a relevant peer group allows boards and stakeholders to make comparisons to other similar organisations including size of provider, area of operations or relevant business activities. Being transparent about who is in the peer group and why the peer group has been chosen also provides stakeholders with a real understanding of performance. There are a wide range of benchmarking clubs that providers can use including the VFM data that accompanies this publication to construct peer groups;
- Reports that align with an organisation’s strategic approach to asset management accompanied with related current and future targets on for example, types of new supply delivered, investment into existing stock, including costs related to building safety and Decent Homes compliance;
- Reports that explain and communicate plans to address shortfalls in performance. The absence of an explanation on performance could suggest poor governance arrangements.
4.9 Registered providers must report value for money performance at a group level. However, some providers should also consider whether it may aid understanding to report separate measures for different business segments if aggregation hides significant variation. For example, where registered providers have leasehold or supported housing activities it may be more informative to report these separately rather than combining them with core activities.
4.10 Strategies and objectives change over time which means that it may be inappropriate to continue reporting on the same measures or against the same targets as in previous periods. Where changes are made to measurements and targets these should be clearly explained.
4.11 Value for money statements that fall short of the regulator’s reporting expectations can reflect weak internal reporting frameworks. Where such instances are identified they will be followed up through routine engagement with registered providers.
Sector analysis
Table 1: Summary of sector trends (2018-2020. Providers owning / managing more than 1,000 homes) [^2]
| VFM metric | Reinvestment | New supply(social) [^3] | New supply (Non social) | Gearing | EBITDA MRI interest cover | Headline social housing CPU (£K) | Operating margin (social) | Operating margin(overall) | ROCE | |
|---|---|---|---|---|---|---|---|---|---|---|
| Upper quartile | 2020 | 10.0% | 2.4% | 0.15% | 54.7% | 227% | £4.86 | 32.3% | 28.6% | 4.4% |
| 2019 | 8.7% | 2.5% | 0.13% | 53.9% | 238% | £4.69 | 34.6% | 30.8% | 4.7% | |
| 2018 | 8.7% | 2.3% | 0.07% | 53.1% | 263% | £4.50 | 37.1% | 34.1% | 5.4% | |
| Median | 2020 | 7.2% | 1.5% | 0.00% | 44.0% | 170% | £3.83 | 25.7% | 23.1% | 3.4% |
| 2019 | 6.2% | 1.5% | 0.00% | 43.4% | 184% | £3.69 | 29.2% | 25.8% | 3.8% | |
| 2018 | 6.0% | 1.2% | 0.00% | 42.9% | 206% | £3.40 | 32.1% | 28.9% | 4.1% | |
| Lower quartile | 2020 | 4.9% | 0.7% | 0.00% | 33.0% | 126% | £3.34 | 20.8% | 18.1% | 2.6% |
| 2019 | 4.2% | 0.6% | 0.00% | 32.6% | 139% | £3.18 | 23.1% | 20.0% | 3.0% | |
| 2018 | 3.9% | 0.5% | 0.00% | 33.1% | 154% | £3.01 | 25.5% | 22.7% | 3.3% | |
| Weighted average | 2020 | 7.6% | 1.8% | 0.31% | 47.7% | 138% | £4.25 | 27.8% | 22.1% | 3.2% |
| 2019 | 6.4% | 1.6% | 0.31% | 46.7% | 153% | £4.12 | 30.5% | 25.0% | 3.6% | |
| 2018 | 6.2% | 1.5% | 0.23% | 45.8% | 174% | £3.92 | 32.8% | 27.6% | 4.0% |
Key themes from analysis
5.1 Table 1 demonstrates the distribution of performance on the regulator’s metrics [^4] showing the sector median and upper and lower quartiles for each of the metrics over the past three years. It is possible to identify several broad trends across the metrics suite as a whole which are set out in the remainder of this report.
5.2 There is limited evidence of any material change in the distribution of performance across the sector. In proportionate terms, there has also been little change in the distribution of performance as measured by the interquartile range on most of the measures. The gap between the providers with the highest and lowest costs has neither significantly narrowed nor widened over the last three years but the gap between those with the largest and smallest margins has slightly narrowed.
5.3 The median Headline Social Housing Cost metric has increased by 3.8% to £3,830 per unit. Over the last three years, capitalised major repairs, total repairs and maintenance costs increased by 15% to £5.7bn. Overall, more than half of the sector reported an increase in repairs and maintenance spend of greater than 5%. The increase in maintenance and repairs costs is partially attributable to building safety spend and health and safety compliance costs.
5.4 There has also been a significant increase in investment into existing and new social stock, with material uplifts in the weighted averages of both the reinvestment and new supply (social) metrics over the past three years. Total reinvestment in new or existing social housing properties for rent increased from £9.6bn in 2019 to £12.2bn in 2020.
Reinvestment and new supply
5.5 Table 1 shows that in the three years to 2020, sector performance on the delivery of reinvestment (which includes both investment in the existing stock and new supply), has noticeably increased. The number of new affordable homes for rent and for market sale has increased while investment in to existing social housing stock have also seen a substantial rise.
5.6 There continues to be significant variance in new supply delivery, with the lower quartile delivering homes equivalent to 0.7% of their existing stock in 2020 compared to 2.4% for the upper quartile.
5.7 Providers who are in the lower quartile tend to be organisations who provide specialist care and support and have relatively tight revenue margins from which they can invest in new units compared to their traditional counterparts.
Table 2: Sector level reinvestment broken down by investment type
| Sector | |||||
|---|---|---|---|---|---|
| Reinvestment (Median) | Reinvestment (weighted average) | Works to existing [^5] (weighted average) | Development and other [^6] (weighted average) | Housing properties at cost or valuation | |
| 2020 | 7.22% | 7.58% | 1.21% | 6.38% | £160bn |
| 2019 | 6.24% | 6.40% | 1.27% | 5.13% | £151bn |
| % Change | 15.7% | 18.5% | -5.1% | 24.4% | 6.3% |
5.8 Table 2 shows that the reinvestment median has increased by 15.7% and the weighted average by 18.5% compared to the previous year. The increase in growth has been driven by investment in the development of new social properties – the weighted average increased by 24.4% to 6.38%.
5.9 Works to existing social properties has increased in nominal terms from £1.91bn in 2019 to £1.93bn in 2020 (0.9%) but due to a 6.3% increase in the value of the tangible fixed assets (housing properties), the percentage figure has reduced from 1.27% to 1.21%. This is still significantly higher when compared to 2018 which was 1.16%.
5.10 The weighted average delivery of new social homes as a percentage of total stock owned has increased from 1.5% in 2018 to 1.8% in 2020. The median reinvestment has also increased from 6.0% to 7.2% over the same period.
Debt based metrics
5.11 The debt-based metrics show some indication of a registered provider’s financial capacity. In the year to 2020, interest payable increased by 2% as providers took on more debt to fund development programmes. Table 1 shows that interest cover across the population fell by an average of 35% over the last three years. The reduction reflects the fall in margins as costs per unit rose, while income fell over the rent reduction period. Despite the fall in the EBITDA MRI interest cover, overall, the financial capacity in the sector remains strong.
5.12 Over the past year gross debt increased by 8% to £83.1bn compared to £76.9bn in 2019. Gearing, which measures net debt as a percentage of the total asset base, indicates the degree of dependence on debt finance. It shows a wide range of performance between the upper quartile and lower quartile. Gearing in the upper quartile has grown over the last three years, reflecting increasing levels of debt taken on for development. In contrast, the lower quartile has remained relatively constant over the same period indicating that some of these providers may be restricted by lending covenants or the capacity to service new loans limiting them from taking on new debt.
Efficiency-based metrics
Table 3: Sector level headline social housing cost (HSHC) per unit by cost type
| Weighted average | |||||
|---|---|---|---|---|---|
| 2020 | 2019 | 2018 | 19-20 % change | 18-20 % change | |
| Management | £1,068 | £1,045 | £1,016 | 2.1% | 5.1% |
| Service charges | £662 | £626 | £599 | 5.8% | 10.7% |
| Maintenance and major repairs | £2,051 | £1,965 | £1,828 | 4.4% | 12.2% |
| Other | £468 | £481 | £477 | -2.8% | -2.0% |
| HSHC | £4,249 | £4,118 | £3,919 | 3.2% | 8.4% |
5.13 Overall, the movement in headline social housing cost is generally consistent across the distribution, with the median increasing by £140 per unit and the upper and lower quartiles by £170 and £150 respectively. Table 3 shows the sector’s weighted average Headline Social Housing Cost per unit has increased by 8.4% since 2018. It is not surprising that a significant proportion of the increase relates to maintenance and major repairs expenditure, which increased by 12.2% or £223 per unit and accounts for 68% of the total increase in headline social housing costs over the past three years. Additional analysis on maintenance and major repairs is provided in subsequent sections of this report.
5.14 While management costs per unit have increased by 5.1% since 2018, in real terms, that is allowing for inflation, they have risen by 2.2% over the past three years. The accounting period covered by the metrics is up to April 2020 and as such is not impacted materially by the pandemic which suggests that costs continued to be influenced by upward pressure on wages and low unemployment. The latest quarterly data shows that unemployment between January and March 2020 was 4.0% [^7], compared to a recorded low of 3.8% in 2019. This has helped to support continued increases in real wages to the end of the financial year. Annual growth in total weekly earnings was 2.4% in the three months to March 2020, 0.7% in real terms [^8]. For those organisations with a significant number of staff at or near the minimum wage, real costs of labour are likely to have risen by a higher proportion due to real terms increases in the Living Wage rate. The rate stood at £8.21 between April 2019 and March 2020, 4.9% above the previous year.
5.15 Over the same period, costs associated with providing services has increased by 10.7% to £662 per unit. Despite this increase it is generally accepted that service charge expenditure should reflect service charge income – an area which was not covered by the rent reduction.
5.16 The data shows a wide range of performance across each of the metrics with significant variation around the median for each metric. To illustrate the extent of the variation figure 1 shows the overall spread of costs across different size of providers. The mean [^9] headline social housing cost per unit is £4,250. This compares to the median average cost per unit which is £3,830 and is denoted by the red line. The difference between the median and the mean is driven by measurable factors such as location and specialism which are discussed in more detail in section 6.
5.17 The regulator’s regression analysis has repeatedly shown that not all this variation can be explained by measurable factors, and much of the variation will stem from the business decisions taken by providers themselves.
Figure 1: Headline social housing cost per unit by total social stock owned and/or managed [^10]
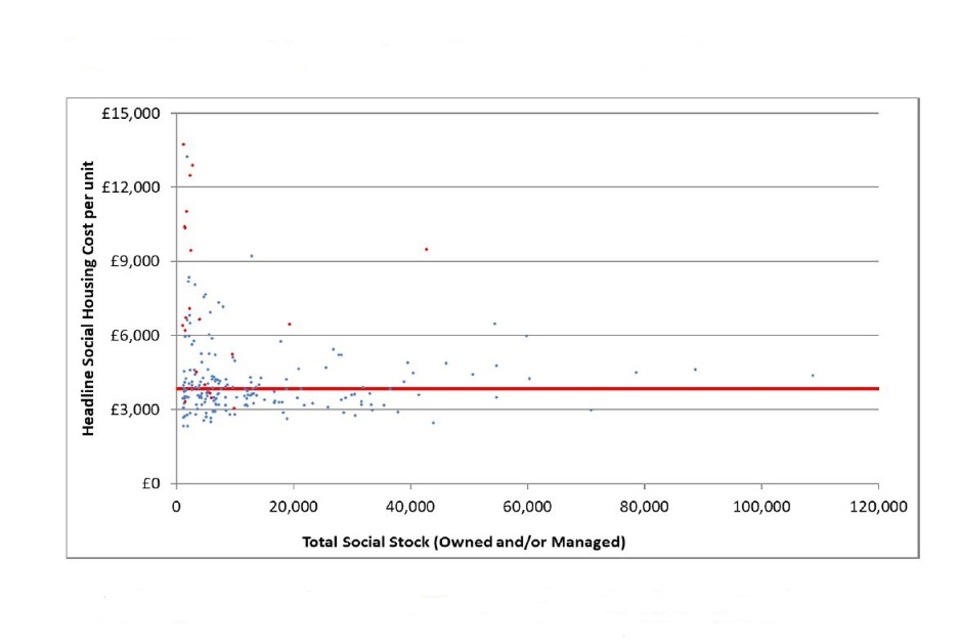
graph shows headline social housing cost per unit by total social stock owned and/or managed
5.18 The latest forecasts [^11] show that costs across the sector will continue to rise over the next five years primarily due to increasing costs of maintaining existing social housing stock to an appropriate standard.
Figure 2: HSHC FFR Forecasts 2015-2020 versus actual FVA data (2015-2025) [^12]
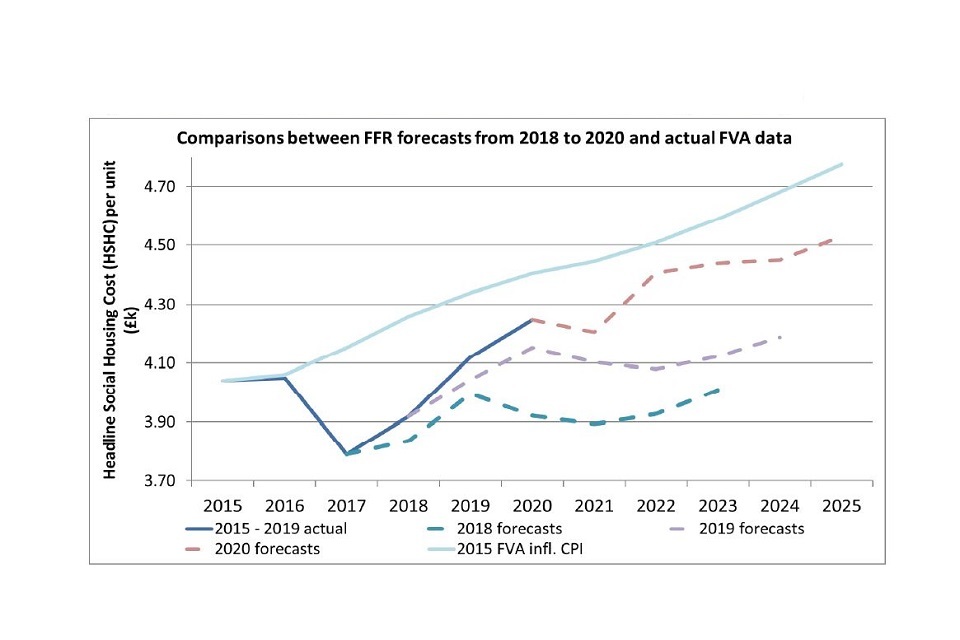
graph showing HSHC FFR Forecasts 2015-2020 versus actual FVA data (2015-2025)
5.19 Figure 2 shows that the Headline social housing cost fell by 6.7% between 2016 and 2017 as providers reduced their cost base to mitigate the loss of rental income from the rent reductions. In 2017, costs were as much as 8.7% below the 2015 headline social housing cost per unit inflated by CPI.
5.20 The outturn since then shows that the pressure on the sector’s cost base has led to above inflation increases in headline social housing costs per unit (2018: 3.4%, 2019: 5.1% and 2020: 3.2%), which demonstrates progressive convergence with 2015 business plans.
5.21 The 1% rent reduction continues to have an impact on the sector’s operating margin from its social housing lettings activity, which is illustrated in figure 3. Over the last five years, the margin fell from 32.1% in 2016 to 27.8% in 2020. Meanwhile, expenditure has increased from £10.2bn to £11.3bn compared to an increase in turnover of just £0.7bn.
Figure 3: Impact of the rent reduction on operating margin – social housing lettings (2016-2020)
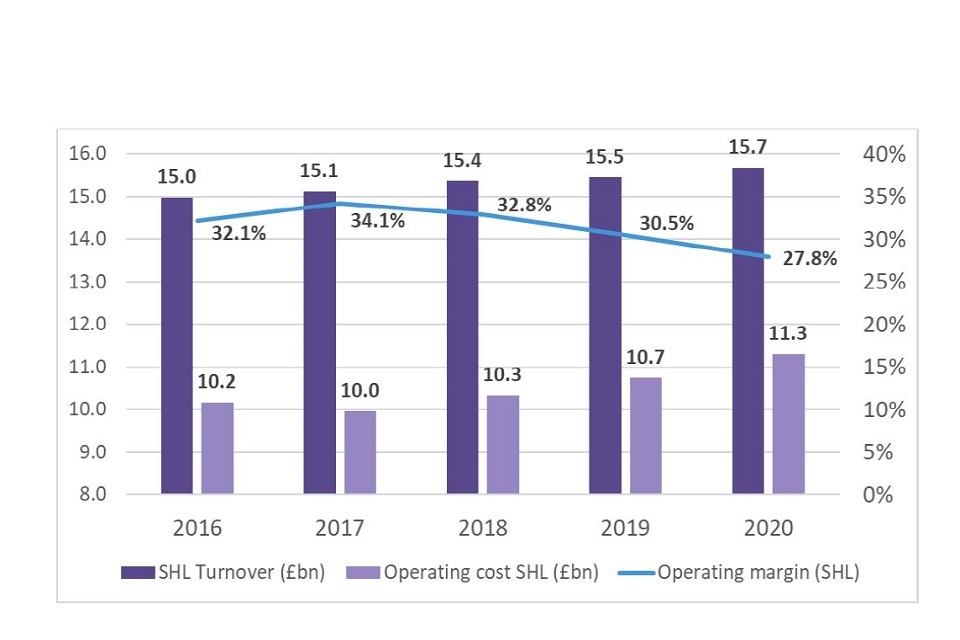
Graph showing Impact of the rent reduction on operating margin – social housing lettings (2016-2020)
| SHL Turnover £bn | Operating cost SHL £bn | Operating margin SHL | |
|---|---|---|---|
| 2016 | 15.0 | 10.2 | 32.1% |
| 2017 | 15.1 | 10.0 | 34.1% |
| 2018 | 15.4 | 10.3 | 32.8% |
| 2019 | 15.5 | 10.7 | 30.5% |
| 2020 | 15.7 | 11.3 | 27.8% |
5.22 In 2020, the operating margin (overall), across all quartiles is two percentage points lower than the operating margin from social housing activities. This demonstrates that the margins across most non-social housing activities are lower compared to provider’s core business.
5.23 The ROCE metric assesses the efficiency of investment of capital resources and compares the operating surplus to total asset values. The weighted average ROCE has fallen by 19.8% over the last three years. This can be explained by the fall in operating surplus outlined above and an increase of 10.5% in asset values.
Sub-sector analysis
Table 4: 2020 -Summary of sub-sector metrics (Registered providers (RPs) owning / managing more than 1,000 homes) [^17]
| Quartile Data | No. of RPs | Reinvestment | New supply(Social) | New supply(Non social) | Gearing | EBITDA MRI interest cover | Headline social housing cost per unit (£K) | Operating margin(Social) | Operating margin(Overall) | Return on Capital Employed | ||
| All returns | Upper quartile | 210 | 100.0% | 10.0% | 2.4% | 0.15% | 54.7% | 227% | £4.86 | 32.3% | 28.6% | 4.4% |
|---|---|---|---|---|---|---|---|---|---|---|---|---|
| Median | 7.2% | 1.5% | 0.00% | 44.0% | 170% | £3.83 | 25.7% | 23.1% | 3.4% | |||
| Lower quartile | 4.9% | 0.7% | 0.0% | 33.0% | 126% | £3.34 | 20.8% | 18.1% | 2.6% | |||
| Provider sub set | ||||||||||||
| Size (Social units owned) | > 30,000 | 27 | 47.3% | 7.6% | 1.7% | 0.15% | 46.0% | 145% | £3.90 | 30.8% | 23.0% | 3.4% |
| 20,000 - 29,999 | 14 | 13.2% | 5.9% | 1.4% | 0.32% | 45.0% | 138% | £3.54 | 24.6% | 20.6% | 3.1% | |
| 10,000 - 19,999 | 34 | 18.0% | 7.3% | 1.3% | 0.00% | 49.8% | 147% | £3.60 | 25.1% | 22.2% | 3.8% | |
| 5,000 - 9,999 | 53 | 13.6% | 8.1% | 1.5% | 0.00% | 46.3% | 174% | £3.74 | 27.0% | 24.4% | 3.8% | |
| 2,500 - 4,999 | 37 | 5.2% | 6.7% | 1.8% | 0.00% | 44.1% | 188% | £3.96 | 24.5% | 23.5% | 3.5% | |
| < 2,500 | 45 | 2.7% | 5.6% | 0.7% | 0.00% | 34.5% | 199% | £4.60 | 23.9% | 20.3% | 3.0% | |
| Cost factor | < yrs. [^13] | 12 | 4.4% | 14.8% | 0.8% | 0.00% | 32.1% | 128% | £3.95 | 22.4% | 21.2% | 4.4% |
| London [^14] | 27 | 11.3% | 6.0% | 1.3% | 0.00% | 38.7% | 121% | £6.20 | 23.7% | 18.6% | 2.4% | |
| SH provider [^15] | 16 | 1.5% | 4.4% | 0.4% | 0.00% | 14.2% | 259% | £9.90 | 10.4% | 6.5% | 3.1% | |
| HOP provider [^16] | 7 | 3.1% | 8.6% | 0.8% | 0.00% | 38.7% | 162% | £6.44 | 19.8% | 16.8% | 4.2% |
6.1 Table 4 shows that there is a notable difference in performance on the VFM metrics across the range of size bands and cost factor. The influence of size on reported performance is complex, but some size bands show material divergence from sector averages – some of which can be explained by the differing prevalence of providers with the characteristics outlined above. The key variances are explained in the commentary that follows in this section.
6.2 Figures 4, 5 and 6 below illustrate the range of performance for these different groups for three of the key VFM performance measures which include reinvestment, housing supply (social) and headline social housing cost per unit.
Figure 4: Reinvestment (medians) by cost factor and size [^18]
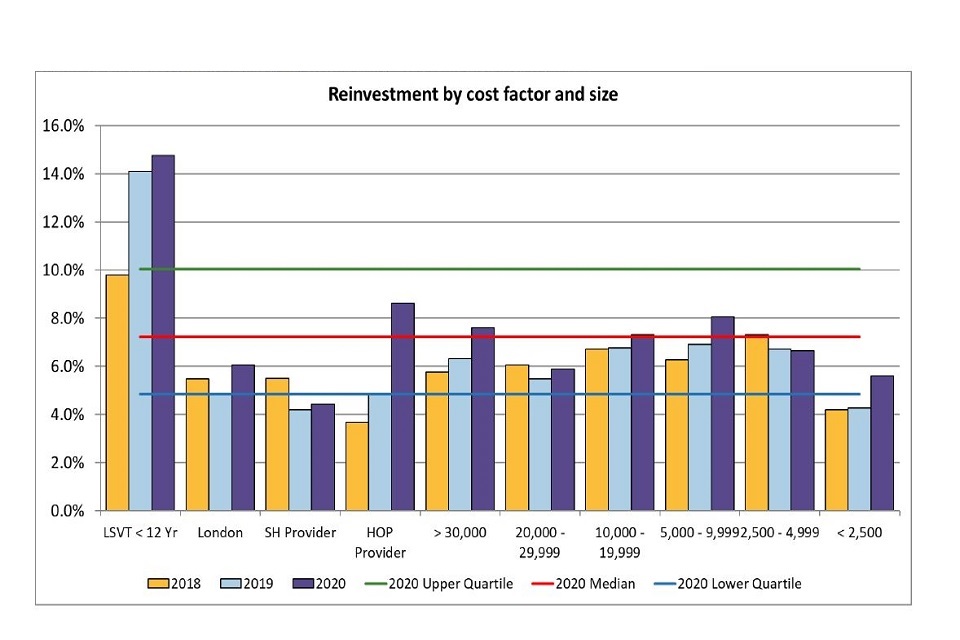
graph showing reinvestment (medians) by cost factor and size
Figure 5: New supply (social) medians by cost factor and size [^19]
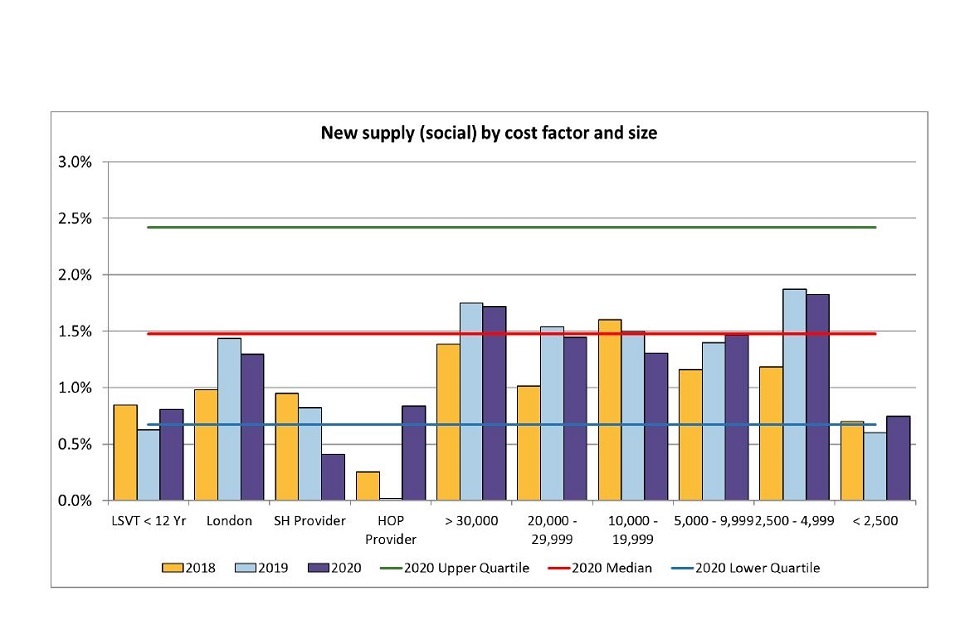
graph showing New supply (social) medians by cost factor and size
Figure 6: Headline social housing cost per unit medians by cost factor and size [^20]
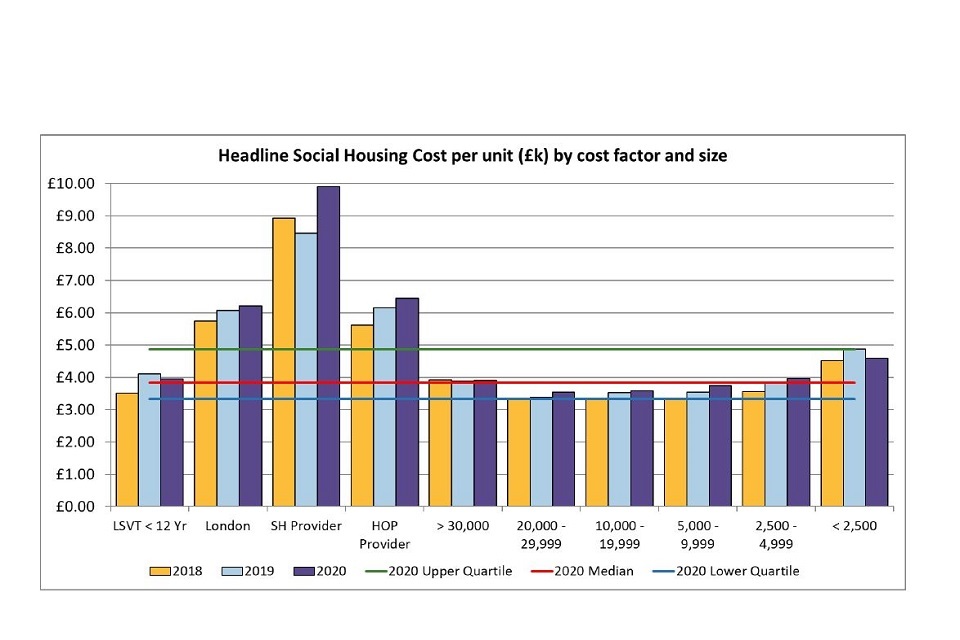
Headline social housing cost per unit medians by cost factor and size
Cost Factor
Supported housing and housing for older people
6.3 Most registered providers own and or manage some supported housing or housing for older people units. But there are a minority of providers where this activity forms a material part of their business. Supported housing and housing for older people providers [^21] account for 11% of all registered providers (4.6% of social stock owned in the sector), with more than 1,000 units.
6.4 These providers are associated with having higher costs [^22] and lower margins due to the range of services that they provide. The median headline social housing cost has increased from £8,460 per unit in 2019 to £9,900 across supported housing providers. This is primarily driven by a small reduction of providers in the sub-group. The median headline cost across the Housing for Older people sub-group also increased from £6,150 per unit in 2019 to £6,440 in 2020. These higher costs and lower margins tend to mean that these organisations are less able to support debt to finance investment activity.
6.5 The supported housing sub-group includes a small but growing number of lease-based registered providers who have a distinctive business model in that they own little or no housing stock and have low levels of debt. The low asset values (the denominator of the reinvestment metric), mean that providers often have very high reinvestment measures and the low debt levels lead to high EBITDA MRI Interest rate and ROCE metrics.
6.6 There have also been significant increases in reinvestment and new supply (social) across housing for older people providers which generally reflects the lumpy composition of provider’s development programmes. The median new supply (social) increased from 0% in 2019 to 0.8% in 2020 – all but one provider in this sub-group developed new social units. The average reinvestment has also increased from 4.9% to 8.6%.
Large scale voluntary transfers less than 12 years old
6.7 Over the past three years the composition of this sub-group has significantly changed with half of the providers included in 2018 maturing and passing 12 years since transfer (beyond which point LSVTs tend to have similar characteristics with traditional providers). This sub-group now accounts for only 4.4% of the sectors social housing stock owned compared to 8.4% in 2018.
6.8 Overall performance of this sub-group is broadly in line with previous years. This group of providers have commitments in place which means that they have higher reinvestment and headline social housing unit costs compared to the sector average as they fulfil post-transfer agreements on their existing housing stock – on average capitalised major repair costs are c.£250 per unit higher compared to traditional providers.
6.9 This sub-group of providers tend to generate lower operating margins compared to the sector median due to lower levels of rental income and higher repairs costs. Their high level of investment into existing stock precludes them from investing in new supply. The lower operating margins can be further explained due to regional differences -around 75% of LSVT providers less than 12 years old are based in the North East or North West of the country, where average operating margins are lower than the sector average.
Size of providers
6.10 There is no direct relationship between size and performance on the VFM metrics after controlling for other factors. Each size band in table 4 contains a range of different providers who have distinctive characteristics, particularly the very largest providers (those with more than 30,000 properties), and the very smallest (those with fewer than 2,500 units). However, much of the difference can be explained by other factors rather than size, in particular, the amount of stock owned in London, and the prevalence of supported housing.
6.11 Over the past three years there have been notable changes in the metrics particularly for the very largest providers. This is in part driven by a small number of mergers. Providers with more than 30,000 units own 47% of the sector’s total social housing stock compared to 36% in 2018. In addition, 89% of providers within the sub-group with more than 30,000 units have grown predominately as a result of a Transfer of Engagement or an amalgamation or indeed a series of both over the past decade.
6.12 Almost 23% of social housing stock owned by providers with over 30,000 units is in London (compared to only 11% of stock owned by providers with between 1,000 units and 30,000 units), where average costs are £6,200 compared to the median of £3,830. However, with higher rental levels it is not surprising that the social housing lettings operating margin for this sub-group is significantly higher at 30.8% compared to a sector median of 25.7%.
6.13 The largest providers also tend to provide a wider range of diverse activities. In particular, market facing development is very much led by the larger providers. Providers with over 30,000 units developed almost 60% of the total number of non social units, although this compares to the previous outturn of 68% in 2019 which generally reflects slower market sales activity in 2020.
6.14 There is a very notable range of performance by providers with between 20,000 and 29,999 units which is driven by geographical factors. Most notably, providers in this size band are concentrated in the North East, North West, or Yorkshire & Humber where margins tend to be squeezed as a result of lower rental income but have costs that are relatively similar to some other regions in England. The median EBITDA MRI interest cover for this sub-group was 138% compared to the sector median of 170%. There is also some evidence that suggests this sub-group may have less capacity in which to invest compared to the rest of the sector. This sub-group also has lower reinvestment in new stock and new supply (social) metrics due to lower housing demand in large parts of these areas. Around a third of providers in this cohort had reinvestment levels of below 5%. Investment into existing stock was on average £680 per unit compared to the sector average of £710 per unit.
6.15 Providers with between 5,000 and 9,999 units have reported significantly higher reinvestment metrics compared to all other size bands, with a median reinvestment of 8.1%. The most influential factor driving this is reported property valuations which are £52,300 per unit – significantly below the sector average of £59,000 meaning this subgroup will have a higher reinvestment metric with the same level of investment into new and existing stock. This is further demonstrated, comparing the weighted average figure of 7.7% which is in line with the sector average of 7.6%.
6.16 The sub-group of providers with between 2,500 to 4,999 units is quite diverse but their performance can also be explained by geographical factors and characteristic type. Compared to the rest of the sub-groups, this cohort has fewer providers based in the North East and the North West of England. They have average levels of supported housing and housing for older people stock and are evenly split between traditional social housing providers and LSVT organisations that are greater than 12 years old. This suggests that this sub-group has greater financial capacity which allows them to invest more in new social supply. This sub-group has the highest level of new supply (social), with a median of 1.8%, this compares to the sector median of 1.5%.
6.17 The other size category with distinctive average metrics is the group of providers with fewer than 2,500 units. The reported performance of this group is significantly affected by registered providers with a high proportion of supported housing and housing for older people stock, this includes leased-based providers which account for around a quarter of this sub-group. Notably, however, the weighted average investment in existing stock is £750 per unit this compares to a sector average of £710 per unit, indicating that smaller providers are actively investing in the homes they own.
Regional analysis
7.1 The regional analysis section sets out the regulator’s metrics suite and analyses of performance by region across England [^23]. It has been introduced this year to further boards understanding of how their organisation’s performance compares to other organisations in their region of operation. Commentary on the metrics in this section has been limited to a core number of VFM metrics only. There is a wide range of performance across each of the ten regions.
7.2 An important aspect of regional performance is understanding the relative importance of the underlying factors that will affect each region. For example, in London and the South East of the country, labour costs are higher compared to the rest of the country, leading to higher costs. Higher property valuations in London will lead to lower reinvestment, gearing and return on capital employed measures as the higher property values result in higher denominators across each of the three metrics. This means for example that a London based provider will have to invest significantly more, compared to a provider in a region with lower property values, to achieve the same reinvestment metric. This compares to the North East and North West regions where private sector rents are lower than the rest of the country. This means demand is lower for existing and new social housing supply. It is for these presenting reasons that care should be taken when interpreting the data provided in this section.
7.3 Each registered provider is assigned to a region on the basis of where the majority of its social housing stock is owned. For the purposes of this report that is 50% of stock in a single region. Providers who have less than 50% of stock in any one region are defined as mixed providers. The regional characteristics data can be found in Annex B.
Table 5: Summary of metrics by region
| Medians | No of providers | % of sector (social units owned) | Reinvestment | New Supply(social) | New Supply(non social) | Gearing | EBITDA MRI Interest Rate Cover | Headline Social Housing CPU (£K) | Operating Margin (social) | Operating Margin | Return on capital employed |
|---|---|---|---|---|---|---|---|---|---|---|---|
| East Midlands | 8 | 2.7% | 8.3% | 2.2% | 0.14% | 50.3% | 185% | £3.44 | 29.1% | 27.0% | 4.1% |
| East of England | 22 | 6.2% | 8.2% | 2.4% | 0.02% | 54.3% | 187% | £3.56 | 30.9% | 29.7% | 3.8% |
| London | 27 | 11.3% | 6.0% | 1.3% | 0.00% | 38.7% | 121% | £6.20 | 23.7% | 18.6% | 2.4% |
| Mixed | 27 | 27.8% | 6.5% | 1.5% | 0.00% | 44.1% | 131% | £4.52 | 23.6% | 19.8% | 3.1% |
| North East | 11 | 5.6% | 7.9% | 1.2% | 0.00% | 41.6% | 201% | £3.40 | 26.1% | 24.0% | 3.9% |
| North West | 37 | 16.5% | 7.3% | 0.8% | 0.00% | 40.0% | 183% | £3.65 | 23.3% | 18.5% | 3.6% |
| South East | 21 10.0% | 7.6% | 2.4% | 0.05% | 50.8% | 164% | £3.84 | 34.8% | 29.8% | 3.3% | |
| South West | 19 | 6.0% | 8.7% | 1.7% | 0.00% | 40.6% | 191% | £3.64 | 25.5% | 23.2% | 3.4% |
| West Midlands | 22 | 8.4% | 5.4% | 1.6% | 0.00% | 48.2% | 156% | £3.49 | 31.7% | 24.5% | 4.3% |
| Yorkshire & the Humber | 16 | 5.7% | 6.9% | 1.7% | 0.00% | 38.8% | 180% | £3.48 | 22.4% | 19.9% | 3.1% |
| England | 210 | 100.0% | 7.2% | 1.5% | 0.00% | 44.0% | 170% | £3.83 | 25.7% | 23.1% | 3.4% |
Table 6: Summary of sector trends (2018-2020) by region
| Medians | Sector | East Midlands | East of England | London | Mixed | North East | North West | South East | South West | West Midlands | Yorkshire & the Humber | |
|---|---|---|---|---|---|---|---|---|---|---|---|---|
| Reinvestment | 2020 | 7.2% | 8.3% | 8.2% | 6.0% | 6.5% | 7.9% | 7.3% | 7.6% | 8.7% | 5.4% | 6.9% |
| 2019 | 6.2% | 7.2% | 8.2% | 4.8% | 4.6% | 5.8% | 6.0% | 6.5% | 6.8% | 6.0% | 7.1% | |
| 2018 | 6.0% | 7.3% | 8.1% | 5.5% | 5.6% | 4.4% | 5.9% | 5.9% | 6.1% | 6.3% | 6.0% | |
| New Supply (social) | 2020 | 1.5% | 2.2% | 2.4% | 1.3% | 1.5% | 1.2% | 0.8% | 2.4% | 1.7% | 1.6% | 1.7% |
| 2019 | 1.5% | 2.3% | 2.5% | 1.4% | 1.5% | 0.6% | 0.7% | 2.2% | 1.9% | 1.9% | 1.4% | |
| 2018 | 1.2% | 2.2% | 1.6% | 1.0% | 0.9% | 0.6% | 0.8% | 2.0% | 1.2% | 1.8% | 1.3% | |
| Headline Social Housing CPU (£K) | 2020 | £3.83 | £3.44 | £3.56 | £6.20 | £4.52 | £3.40 | £3.65 | £3.84 | £3.64 | £3.49 | £3.48 |
| 2019 | £3.69 | £3.16 | £3.41 | £6.07 | £4.53 | £3.37 | £3.50 | £3.61 | £3.44 | £3.40 | £3.53 | |
| 2018 | £3.40 | £3.13 | £3.28 | £5.75 | £4.41 | £2.92 | £3.33 | £3.31 | £3.34 | £3.31 | £3.10 | |
| ROCE | 2020 | 3.4% | 4.1% | 3.8% | 2.4% | 3.1% | 3.9% | 3.6% | 3.3% | 3.4% | 4.3% | 3.1% |
| 2019 | 3.8% | 4.1% | 4.0% | 2.8% | 3.5% | 3.6% | 4.4% | 3.8% | 3.9% | 4.7% | 3.0% | |
| 2018 | 4.1% | 4.4% | 4.0% | 3.2% | 4.0% | 4.0% | 4.9% | 4.2% | 4.3% | 5.0% | 3.4% |
7.4 Table 5 and Table 6 highlight that there is considerable variation across each region but that the pattern of performance has remained relatively consistent over the past three years. Where there are unusual year on year movements across a particular region, these are explained in more detail below.
Reinvestment
Table 7: Reinvestment by region of operation
| Median | Weighted Average | Existing stock (Weighted Average) | Develop. & Other (Weighted Average) | Per unit (£k) | Existing stock (per unit)(£k) | Develop.& Other (per unit)(£k) | Avg. property value (£k) | |
|---|---|---|---|---|---|---|---|---|
| East Midlands | 8.3% | 9.1% | 1.1% | 7.9% | £4.23 | £0.52 | £3.70 | £46.68 |
| East of England | 8.2% | 8.3% | 1.0% | 7.3% | £5.05 | £0.63 | £4.41 | £60.46 |
| London | 6.0% | 7.3% | 0.8% | 6.5% | £8.35 | £0.94 | £7.41 | £114.25 |
| Mixed | 6.5% | 7.1% | 1.3% | 5.8% | £4.63 | £0.86 | £3.77 | £65.34 |
| North East | 7.9% | 7.8% | 2.7% | 5.1% | £2.30 | £0.80 | £1.51 | £29.44 |
| North West | 7.3% | 8.0% | 1.9% | 6.1% | £2.53 | £0.59 | £1.94 | £31.74 |
| South East | 7.6% | 8.0% | 0.8% | 7.2% | £5.95 | £0.60 | £5.35 | £74.78 |
| South West | 8.7% | 8.8% | 1.2% | 7.7% | £4.48 | £0.59 | £3.89 | £50.70 |
| West Midlands | 5.4% | 7.6% | 1.1% | 6.5% | £3.38 | £0.48 | £2.90 | £44.67 |
| Yorkshire & the Humber | 6.9% | 7.0% | 1.9% | 5.0% | £2.28 | £0.64 | £1.64 | £32.75 |
| England | 7.2% | 7.6% | 1.2% | 6.4% | £4.47 | £0.71 | £3.76 | £58.99 |
7.5 As previously set out, the reinvestment metric is affected by geographical location in that property values are a key driver of this metric. The average property valuation in London is £114,250 and is almost four times higher compared to the North East where an average property is £31,740. This means that providers based in London must invest over three times more in absolute terms to achieve the same reinvestment metric result as providers in the North of the country.
7.6 Providers based in London have a lower reinvestment median of 6.0% compared to the sector average of 7.2%. This is driven by higher property values rather than providers in this region investing less into existing stock or new supply. This sub-group of providers have invested 87% more in absolute terms into existing social housing stock and new supply compared to the sector average on a per unit basis.
7.7 There is a notable level of investment into existing stock in the North East and North West compared to other regions. This in part is driven by the increased number of young LSVT’s in these regions who are committed to investing in existing stock as a part of their transfer agreement with tenants.
7.8 At a regional level reinvestment into existing stock is broadly consistent. The average expenditure is between £600 and £800 per unit across most regions. However, the exceptions are the East Midlands and West Midlands where investment averages £520 and £480 per unit respectively. These lower costs can be partially explained by the small amount of social housing stock located in the East Midlands.
7.9 In the West Midlands performance is primarily driven by a significant minority of providers where reinvestment as a percentage of existing stock is lower than 5.0%. Almost all providers in this sub-group are non-specialist with less than 5,000 units. The weighted average reinvestment for providers operating in the West Midlands is 7.6% which is in line with the sector weighted average. This means that larger providers in this region who have higher operating margins and can support higher levels of debt are investing more compared to smaller organisations in the area.
New supply
7.10 The development of new supply (social) as a proportion of existing stock varies considerably across England. At a regional level, investment in new social housing stock is delivered where demand for housing is greatest, with providers in London (£7,410 per unit), and the South East (£5,350 per unit) [^24], investing significantly more than the sector average of £3,760 per unit. This correlates with rent levels in the private rental sector where the median rent in London is £1,495 per month compared to an England median of £695 per unit [^25].
7.11 The mixed sub-group shown in table 5 is quite distinguished in that its performance is quite similar to the national average. This is unsurprising given that providers in this cohort have a wider geographic spread all close to the national distribution.
Table 8: New supply – Social by region of operation
| Region of operation | New supply (social) units | Total social units owned | New supply (Social ) median | New supply (Social)weighted average |
|---|---|---|---|---|
| East Midlands | 1,619 | 74,547 | 2.2% | 2.2% |
| East of England | 4,644 | 173,862 | 2.4% | 2.7% |
| London | 6,224 | 331,700 | 1.3% | 1.9% |
| Mixed | 13,696 | 788,453 | 1.5% | 1.7% |
| North East | 1,683 | 154,232 | 1.2% | 1.1% |
| North West | 4,684 | 461,192 | 0.8% | 1.0% |
| South East | 6,762 | 283,955 | 2.4% | 2.4% |
| South West | 3,947 | 167,949 | 1.7% | 2.4% |
| West Midlands | 4,413 | 230,426 | 1.6% | 1.9% |
| Yorkshire and the Humber | 2,343 | 159,886 | 1.7% | 1.5% |
| England | 50,015 | 2,826,202 | 1.5% | 1.8% |
7.12 Registered providers in the North East and North West of England continue to deliver the lowest levels of new supply (social). The median level of development for each region is 1.2% and 0.8% of existing stock respectively, compared to the sector median of 1.5%. A possible explanation for this is that housing in these regions tends to be more affordable and therefore demand is likely to be lower compared to the rest of England.
7.13 There continues to be a large gap between the median (1.3%), and weighted average (1.9%) for London based providers. This indicates that larger providers are continuing to develop, proportionally, more units than their smaller counterparts. This suggests that higher costs of development in the capital may be acting as a barrier to smaller providers.
7.14 Surprisingly, the average new supply for providers based in Yorkshire and the Humber has materially increased from 1.5% to 1.7%. This has been driven by a small number of providers who collectively increased new supply by 144% in 2020. The weighted average for social development in this region is 1.5% and remains significantly below the sector average of 1.8%.
Table 9: Non-social housing supply by region of operation
| Region of operation | New Supply(non social) units | Total Units Owned | New Supply (non social) Median | New Supply (non social) Weighted Average |
|---|---|---|---|---|
| East Midlands | 333 | 76,182 | 0.14% | 0.44% |
| East of England | 594 | 180,189 | 0.02% | 0.33% |
| London | 2,658 | 359,863 | 0.00% | 0.74% |
| Mixed | 2,846 | 853,219 | 0.00% | 0.33% |
| North East | 224 | 155,180 | 0.00% | 0.14% |
| North West | 565 | 473,791 | 0.00% | 0.12% |
| South East | 1,196 | 297,856 | 0.05% | 0.40% |
| South West | 238 | 172,189 | 0.00% | 0.14% |
| West Midlands | 234 | 236,645 | 0.00% | 0.10% |
| Yorkshire and the Humber | 310 | 162,277 | 0.00% | 0.19% |
| England | 9,198 | 2,967,391 | 0.00% | 0.31% |
7.15 New supply non-social includes development on the provider’s balance sheet and therefore excludes new units delivered through joint ventures. Given the comparatively limited level of non-social units reported in registered vehicles these have not been broken down by region.
7.16 Similar to social supply there are large regional variations, with providers based in London delivering over seven times the level of new non-social supply compared to providers in the West Midlands.
7.17 Our analysis suggests that new supply non-social is delivered in areas where property prices are above the national average – with providers based in London, the South East and the East of England all delivering more than the sector average.
Headline social housing unit costs
7.18 Intuitively, providers with higher headline social housing costs tend to be based in London and have an average cost of £6,200 per unit, which is 62% above the England median of £3,830. The higher costs in London are driven by high levels of building safety spend and wage levels which on average are 27% [^26] higher when compared to the rest of the England. Providers who are in the mixed region sub-group also have higher costs primarily due to their stock profile – around 15% of mixed provider’s stock is in London.
7.19 Interestingly, over the past three years the difference between London and the rest of the sector median has narrowed – in 2018 the regional difference stood at 69% compared to 62% in 2020. This suggest that costs have risen faster outside of the capital.
Table 10: Headline social housing cost by region of operation
| Region of Operation | Headline Social Housing Cost Median (£K) | Headline Social Housing Cost Weighted Average (£K) |
|---|---|---|
| East Midlands | £3.44 | £3.80 |
| East of England | £3.56 | £3.72 |
| London | £6.20 | £6.11 |
| Mixed | £4.52 | £4.71 |
| North East | £3.40 | £3.43 |
| North West | £3.65 | £3.80 |
| South East | £3.84 | £3.95 |
| South West | £3.64 | £3.68 |
| West Midlands | £3.49 | 3.36 |
| Yorkshire & the Humber | £3.48 | £3.58 |
| England | £3.83 | £4.25 |
7.20 Across the rest of the regions, costs are relatively consistent, with each other. Costs in the South East for example average £3,840 per unit and are only 13% higher than the least expensive region, which is the North East, where average costs are £3,400 per unit.
7.21 The weighted average Headline Social housing cost of £4,250 is materially higher than the sector median. This reported difference is affected by the distribution of specialist providers who have costs significantly above the sector median.
Return on capital employed
7.22 There continues to be a moderate degree of variance in ROCE performance which is underpinned by movements in operating surplus including joint ventures and property values in each region. In London for example ROCE is driven by higher valuations, rather than lower surplus from operating activities where returns generated from joint venture activities are high compared to any other region.
7.23 In the East Midlands there has been relatively modest increase year on year which can be explained by the very low level of providers operating out of this region which means that the median can be sensitive to changes across a small number of providers.
7.24 The largest regional fall in ROCE was recorded in the North West, where the median fell from 4.9% to 3.6% between 2020. In part this can be explained by the 1% rent cut and its impact on turnover. In the North West of the country, 87% of income is generated through social housing lettings activities which is higher than any other region, and significantly above the sector average of 74%.
7.25 In contrast, ROCE increased by 8% in the North East region between 2019 and 2020 which was driven by an increase in operating surplus by one provider. The weighted average ROCE in the region fell from 4.0% in 2019 to 3.7% in 2020.
Annex A: Summary of Value for Money metrics and methodology
7.27 This publication, along with the VFM metrics dataset, provides registered providers with a useful comparative baseline for annual reporting and monitoring of trends. The dataset includes the metrics for all registered providers with more than 1,000 properties at both a group and an entity level with a period ended 31 March 2020. For consistency, the metrics for individual registered providers have been calculated on the basis set out in the regulator’s metrics technical note, using the FVA electronic accounts data submitted by registered providers.
7.28 Registered providers who have a period ending other than the 31 March will be added to the dataset once the FVA has been submitted.
7.29 Most of the metrics are set at a group level and take account of registered providers’ core activity, which for most registered providers is the provision of social housing lettings. It also takes account of non-social housing activities in unregistered subsidiaries and joint ventures [^28] which provides a comprehensive assessment of registered providers’ performance. The exception to this is the delivery of new non social housing through joint ventures, which is excluded for consistency reasons.
7.30 We encourage registered providers to use the regulator’s published metrics to benchmark and challenge performance against relevant peer groups, both at a sector and sub sector level. The latest VFM metrics dataset is available on the website with this report.
7.31 The analysis for 2020 is based on 210 registered providers compared to 217 in 2019 and 230 in 2018. The number of registered providers has reduced due to an increased number of mergers and group restructures that have taken place over the last three years. This also means that the number of very large registered providers (greater than 30,000 units), has increased and they now represent just over 47% of the total stock owned and or managed in the sector.
7.32 Quoted quartile ranges apply to performance on individual metrics, so a provider may be in the upper quartile for one metric and the lower quartile for another.
Table 11: The Value for Money metrics
| Metric | Subdivision – consolidated, social housing or both | Metric description | |
|---|---|---|---|
| 1 | Reinvestment % (in existing homes and new homes) | Consolidated | Scale of investment into existing housing and acquisition or development of new housing in relation to the size of the asset base. |
| 2 | New supply delivered % | Consolidated and social housing | Units acquired or developed in year as a proportion of existing stock. [^30] |
| 3 | Gearing % | Consolidated | Proportion of borrowing in relation to size of the asset base. |
| 4 | Earnings Before Interest, Tax, Depreciation, Amortisation, Major Repairs, Included Interest cover % | Consolidated | Key indicator for liquidity and investment capacity. |
| 5 | Headline social housing cost per unit | Social housing only | Social housing costs per unit |
| 6 | Operating margin % | Consolidated and social housing | Operating surplus (deficit) divided by turnover (demonstrates the profitability of operating assets). |
| 7 | Return on capital employed % | Consolidated | Surplus/(deficit) plus disposal of fixed assets plus profit /(loss) of joint ventures compared to total assets. |
Table 12: Headline Social Housing Cost regression cost breakdown (2017 prices)
Table 12 highlights the additional headline social housing cost per unit associated with owning or managing a property that meets one of the measurable cost factors. For example, the average supported housing property is associated with costs of £6,700 per unit above a general needs property. The results are derived from the 2018 regression analysis undertaken by the Regulator of Social Housing with the costs quoted being in 2017 prices. The figures should help to provide useful context for the analysis of headline social housing cost per unit included within the Sub-sector analysis section.
| Cost factor | Associated Headline social housing cost per unit £ |
|---|---|
| Baseline [^31] | £3,300 |
| Supported Housing unit | £6,700 |
| % Housing for Older People unit | +£1,400 |
| ASHE Wage London Vs England Avg | +£1,900 |
| LSVT <7 years | +£1,100 |
| LSVT 7 12 Years | +£100 |
| IMD Deprivation Most deprived vs median | +£350 |
Annex B: Regional characteristics
Table 13 outlines the number of providers in each region and also includes information on contextual factors that can help to explain some of the differential regional performance seen in the Regional analysis section.
Table 13: Providers by region
| Regions | No of providers | % of sector (social units owned) | SH Provider | HOP Provider | SH or HOP Specialist (Comb*) | Lease based** Provider | >30,000 units | 20,000 - 29,999 | 10,000 - 19,999 | 5,000 - 9,999 | 2,500 - 4,999 | < 2,500 | LSVT < 7 Years | LSVT < 12 Years |
|---|---|---|---|---|---|---|---|---|---|---|---|---|---|---|
| East Midlands | 8 | 2.7% | 1 | 1 | 2 | 0 | 0 | 1 | 1 | 3 | 1 | 2 | 0 | 0 |
| East of England | 22 | 6.2% | 0 | 0 | 0 | 0 | 1 | 0 | 3 | 9 | 7 | 2 | 0 | 0 |
| London | 27 | 11.3% | 3 | 1 | 6 | 0 | 3 | 0 | 2 | 6 | 6 | 10 | 0 | 0 |
| Mixed | 27 | 27.8% | 6 | 4 | 10 | 3 | 12 | 2 | 2 | 1 | 3 | 7 | 0 | 0 |
| North East | 11 | 5.6% | 1 | 0 | 1 | 0 | 1 | 2 | 3 | 1 | 1 | 3 | 1 | 3 |
| North West | 37 | 16.5% | 1 | 0 | 1 | 0 | 3 | 2 | 12 | 12 | 5 | 3 | 1 | 6 |
| South East | 21 | 10.0% | 0 | 1 | 1 | 0 | 2 | 3 | 2 | 10 | 1 | 3 | 0 | 1 |
| South West | 19 | 6.0% | 2 | 0 | 2 | 0 | 2 | 0 | 3 | 4 | 6 | 4 | 1 | 2 |
| West Midlands | 22 | 8.4% | 2 | 0 | 2 | 1 | 1 | 3 | 4 | 4 | 5 | 5 | 0 | 0 |
| Yorkshire & the Humber | 16 | 5.7% | 0 | 0 | 0 | 0 | 2 | 1 | 2 | 3 | 2 | 6 | 0 | 0 |
| England | 210 | 100% | 16 | 7 | 25 | 4 | 27 | 14 | 34 | 53 | 37 | 45 | 3 | 12 |
Annex C: Cost factor and size cohort sizes (2018-2020)
Table 14 outlines the number of providers included in each cost factor and size cohort in each of the years 2018 to 2020 which provides some context as to how the cohorts have changed over time. Most notably the number of providers owning more than 30,000 units has increased from 17 to 27 in the last three years whilst the number of LSVTs within the first 12 years after transfer has halved from 24 to 12.
Table 14: Number of providers included in each cost factor or size cohort (2018-2020)
| No. of providers | ||||
|---|---|---|---|---|
| 2018 | 2019 | 2020 | ||
| Cost Factor | LSVT < 12 Yr | 24 | 17 | 12 |
| London | 30 | 28 | 27 | |
| SH Provider | 16 | 17 | 16 | |
| HOP Provider | 9 | 7 | 7 | |
| Size (Social units owned) | > 30,000 | 17 | 25 | 27 |
| 20,000 -29,999 | 21 | 14 | 14 | |
| 10,000 -19,999 | 43 | 37 | 34 | |
| 5,000 -9,999 | 58 | 55 | 53 | |
| 2,500 -4,999 | 42 | 38 | 37 | |
| < 2,500 | 49 | 48 | 45 |
© RSH copyright 2021
This publication is licensed under the terms of the Open Government Licence v3.0 except where otherwise stated. Where we have identified any third party copyright information you will need to obtain permission from the copyright holders concerned.
Any enquiries regarding this publication should be sent via enquiries@rsh.gov.uk or call 0300 124 5225 or write to:
Regulator of Social Housing
1st floor – Lateral
8 City Walk
Leeds LS11 9AT