2020-based population projections: a GAD technical bulletin
Published 14 January 2022

© Crown copyright 2022
This publication is licensed under the terms of the Open Government Licence v3.0 except where otherwise stated. To view this licence, visit nationalarchives.gov.uk/doc/open-government-licence/version/3 or write to the Information Policy Team, The National Archives, Kew, London TW9 4DU, or email: psi@nationalarchives.gov.uk.
Where we have identified any third party copyright information you will need to obtain permission from the copyright holders concerned.
This publication is available at https://www.gov.uk/government/publications/2020-based-population-projections-a-gad-technical-bulletin/2020-based-population-projections-a-gad-technical-bulletin
Introduction
The Office for National Statistics (ONS) published its 2020-based interim national population projections on 12 January 2022. These projections provide an indication of how the population size and age structure of the UK and its constituent countries may develop in the future. This bulletin summarises some of the key findings and considers how GAD uses the population projections.
2020-based interim population projections
ONS produced a principal projection based on assumptions for future levels of fertility, mortality and migration. The projections are based on long-term assumptions considered to best reflect recent demographic patterns. It is important that projections are not viewed as predictions or forecasts, but as an indication of the future if past demographic trends continue.
All population projections are subject to uncertainty. There is currently additional uncertainty as to the lasting effects of the COVID-19 (Coronavirus) pandemic and how the UK leaving the EU might affect long-term international migration. The projections are based on population estimates covering the period up to 30 June 2020. Therefore, the starting point of the projections only includes some of the impacts on the UK population from the early part of the COVID-19 pandemic.
The 2020-based projections are described as ‘interim’ because of the uncertainty in projecting long-term demographic trends following the onset of the pandemic and the fact they do not incorporate forthcoming Census 2021 data. ONS are currently planning to publish 2021-based projections in 2023, including updated census data.
Adjusting for the COVID-19 pandemic
The 2020-based projections are calculated using a similar methodology to the 2018-based projections. However, some adjustments are made to the short-term mortality assumptions methodology to reflect the impact of the COVID-19 pandemic.
A panel of mortality experts were asked to give their views on future mortality rates, including the impact of the COVID-19 pandemic on changes to mortality rates in the short term (up to 2024). Whilst these changes may be positive or negative we describe them as ‘improvements’ in this bulletin. There was no consensus as to the size of the overall improvement by age group. The projections assume that there will not be a step change in future mortality improvement rates as a result of COVID-19. After 2022, improvements will be in line with those projected assuming COVID-19 had not occurred. However, various detailed adjustments were made between 2019 and 2024 to allow for estimated deaths in 2021 and an averaging of the experts’ views on the estimated improvements by age group over this period.
Further information is available on the mortality assumptions underlying the 2020-based projections. Other supporting publications include details of the methodology used, a blog and the datasets for the national population projections.
Summary results
A statistical bulletin summarises the main results, including:
- a population increase - the UK population is projected to increase from an estimated 67.1 million in mid-2020 to 69.2 million in mid-2030 and 71.0 million in mid-2045
- an ageing population - the number of people aged 85 years and over is projected to almost double in the next 25 years, from 1.7 million in 2020 to 3.1 million by 2045
- an increased old-age-dependency ratio - for every 1,000 people of working age, there will be 341 people of pensionable age by mid-2045, up from 280 in mid-2020
- slower population growth - with 1.8 million fewer people in the UK population by mid-2045 (71.0 million), compared to the previous 2018-based projections (72.8 million)
The chart below shows the projected age structure of the UK population in mid-2020 and mid-2030. Interactive population pyramids are available on the ONS website.

ONS Fig. 3 Older People
Life expectancy
Life expectancies are still projected to increase over time, but less quickly than in the 2018-based projections. This is a consequence of the slower increases in life expectancy in recent years and the projected impact of the COVID-19 pandemic. The long-term assumption that annual rates of mortality improvement will converge, after 25 years, to 1.2% a year for ages under 90 remains unchanged, as does the assumption of lower long-term rates of improvements for ages over 90 years.
The overall effect is that, compared to the 2018-based projections, cohort life expectancies (which allow for future mortality improvements) are lower as shown in the following table:
| Cohort life expectancies in 2022 | 2020-based projections | 2018-based projections | difference |
|---|---|---|---|
| At birth | |||
| Males | 87.6 years | 88.1 years | -0.5 years |
| Females | 90.4 years | 90.7 years | -0.3 years |
| At age 65 | |||
| Males | 19.9 years | 20.2 years | -0.3 years |
| Females | 22.2 years | 22.4 years | -0.2 years |
Source: ONS, National population projections
The chart below shows the historical trend and principal projection of period life expectancies (which do not allow for future mortality improvements) at birth for females - showing changes between the 2012-based and 2020-based projections. The impact of the COVID-19 pandemic on mortality rates in 2020 is clearly shown by the dip in the line for the 2020-based projections. The pattern for males is similar.
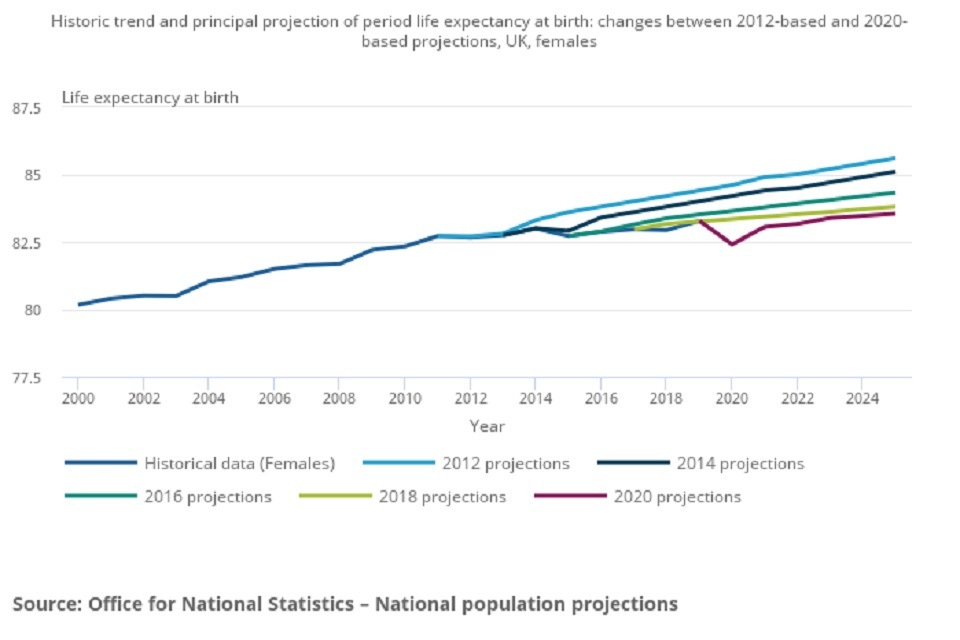
ONS Fig 6b Mortality Rates
How GAD uses the population projections
The projections are used across the public sector to help with modelling and decision-making, both in the short and long-term. GAD’s work often involves consideration of how long individuals are expected to live. Therefore, the mortality assumptions used in the projections are of most relevance to GAD’s work. Examples include:
Pension scheme valuations: When valuing a pension scheme, we typically allow for scheme-specific current mortality rates combined with an assumption about how mortality rates might improve in the future.
Actuarial factors for pension schemes: The mortality assumptions underlying the projections are also often used to determine actuarial factors used in the calculation of member benefits. For example, for both public service schemes and many of the funded pension schemes we advise, these assumptions are used when calculating how to adjust the pension payable if the member retires early or late.
National Insurance Fund: GAD’s analysis of the National Insurance Fund (NIF) makes use of the population projections, including the underlying migration and fertility assumptions as well as the mortality assumptions. Our 2021 annual uprating report analyses the impact of the benefit and contribution-related uprating legislation, using the 2018-based projections.
Quinquennial review: GAD is due to publish this five-yearly review of the NIF in 2022 to help the government understand the potential risks to the sustainability of the NIF. The review considers the projected contributions due to be received and the benefits due to be paid out over the next 65 years. The amount of benefits paid out will rely heavily on how long people are expected to live for.
State Pension age (SPa) review: The second SPa review was launched in December 2021 and must be published by 7 May 2023. The Government Actuary will provide a report which must assess the age of entitlement in legislation by analysing the latest life expectancy projections.
GAD will be reviewing our standard mortality assumptions in light of the publication of the 2020-based population projections. If you would like to discuss any of these issues in more detail or have any questions about the implications for our work for you, please get in touch with your usual GAD contact.