Police powers and procedures: Stop and search and arrests, England and Wales, year ending 31 March 2022
Published 27 October 2022
Applies to England and Wales

© Crown copyright 2022
This publication is licensed under the terms of the Open Government Licence v3.0 except where otherwise stated. To view this licence, visit nationalarchives.gov.uk/doc/open-government-licence/version/3 or write to the Information Policy Team, The National Archives, Kew, London TW9 4DU, or email: psi@nationalarchives.gov.uk.
Where we have identified any third party copyright information you will need to obtain permission from the copyright holders concerned.
This publication is available at https://www.gov.uk/government/statistics/police-powers-and-procedures-stop-and-search-and-arrests-england-and-wales-year-ending-31-march-2022/police-powers-and-procedures-stop-and-search-and-arrests-england-and-wales-year-ending-31-march-2022
Frequency of release: Annual
Forthcoming releases: Home Office statistics release calendar
Home Office responsible statistician: Jodie Hargreaves
Press enquiries: pressoffice@homeoffice.gov.uk
Telephone: 0300 123 3535
Public enquiries: policingstatistics@homeoffice.gov.uk
Privacy information notice: Home Office Crime and Policing Research and Annual Data Requirement (ADR) data – Privacy Information Notices
1. Introduction
1.1 Key findings
There were 526,024 stop and searches conducted under section 1 PACE by police in England and Wales (including British Transport Police). This is a decrease of 179,888 (25%) compared with the previous year, and 8% below the level of stop and search in the year ending March 2020 (the year preceding the pandemic). The increased level of stop and search in the year ending March 2021 was partly due to proactive policing during COVID-19 lockdowns.
Of those 526,024 searches under section 1 PACE (and associated legislation), 66,772 led to an arrest. While the volume of arrests is 18% lower than the previous year, the arrest rate increased from 11% to 13%.
Two thirds (66%) of stop and searches in the year ending March 2022 were of males aged between 15 and 34, while this cohort comprises 13% of the overall population. Males aged 15-19 had the highest rate of stop and search, at 70 stop and searches per 1,000 population in the year ending March 2022.
There were 663,036 arrests carried out by territorial police forces in England and Wales, an increase of 3% compared to the previous year in which there were 645,225 arrests, but down 2% from the year preceding the pandemic (ending March 2020).
The change in the number of arrests in the latest year varied across different offence groups. Arrests for sexual offences increased by almost a third (32%), whereas arrests for drug offences fell by 17%. The overall volume increase in arrests was driven by a 12% increase (32,100) in arrests for violence against the person offences, the largest arrest type.
The pattern across forces was mixed, with 26 forces showing an increased number of arrests compared with last year while 17 police forces made fewer arrests.
1.2 Police Powers and Procedures statistics release
Prior to October 2021, statistics on stop and search and arrests were published as part of the annual ‘Police powers and procedures’ statistical bulletin, which covered other topics including the use of other police powers under the Police and Criminal Evidence Act 1984, fixed penalty notices and other outcomes for motoring offences, breath tests, pre-charge bail, released under investigation and detentions under the Mental Health Act. Given the volume and variety of topics covered, a decision was made in 2021 to split the release into two separate statistical bulletins.
This release is therefore the first of the two to be published on police powers in 2022 and contains statistics on the use of the powers of stop and search and arrest by the police in England and Wales up to the year ending 31 March 2022.
The second release, which is due to be published on 17 November 2022, will contain statistics on the use of other police powers under the Police and Criminal Evidence Act 1984, fixed penalty notices and other outcomes for motoring offences, breath tests, pre-charge bail, released under investigation and detentions under the Mental Health Act. It will also contain new data on the use of police powers to conduct a strip search.
1.3 Contents of this release
The stop and search section of this release contains information provided by the 43 territorial police forces in England and Wales, and the British Transport Police (BTP). It presents statistics on the:
- change in the use of stop and search throughout the years ending March 2021 and March 2022
- number of stop and searches carried out under a range of legislative powers, including:
- section 1 of the Police and Criminal Evidence Act 1984 (PACE) and associated legislation
- section 60 of the Criminal Justice and Public Order Act 1994
- section 47A (previously section 44) of the Terrorism Act 2000
- reason for conducting a search
- outcomes following stop and search
- weapons found from stop and search
- ethnicity, sex and age of persons searched
- hotspot analysis of stop and search locations in different parts of England
- relationship between stop and search and deprivation
The arrests section contains information provided by the 43 territorial police forces in England and Wales on a financial-year basis. It includes statistics on the:
- number of arrests for notifiable offences
- reason for which persons were arrested
- ethnicity, sex and age of those arrested
Key findings can be found at the start of each chapter.
1.4 Stakeholder engagement and new analysis in this release
For the first time in the year ending March 2021, the Home Office collected incident-level data on stop and search from police forces, meaning that each row of data relates to a single incident of stop and search. This publication contains data from the second year of the incident-level data collection.
The improved method of data collection, as well as the additional data collected, allows for more in-depth analysis of stop and search in England and Wales than was previously possible. More information on the change to the data collection is available in the year ending March 2021 release.
Furthermore, in light of this improved collection, and in response to the Commission for Race and Ethnic Disparities report, Home Office officials have worked with force representatives, stakeholders, and users of this publication to understand what more could be done to improve this release, which has led to additional analysis and outputs.
Moreover, analysts have developed a stop and search data tool to query the open data tables. This allows users with beginner Excel skills to produce customised data tables more easily.
Additionally, for the first time, data on stop and searches at Community Safety Partnership level is being published as part of this release. Those data can be found in the summary data tables.
Findings from an engagement survey conducted in Spring 2022 showed that most people who accessed these statistics did so as they had interest in policing in their local area. Additionally, the majority of respondents indicated that they found it easy to access and use the data tables that accompany the publication.
In line with the Code of Practice for Statistics and as part of our commitment to continuous development and improving the statistics, we invite users to provide feedback on the statistics and analysis presented in this bulletin and associated data tables. Users can contact Home Office statisticians at policingstatistics@homeoffice.gov.uk
1.5 National Statistics status
These statistics have been assessed by the UK Statistics Authority to ensure that they continue to meet the standards required to be designated as National Statistics. This means that these statistics meet the highest standards of trustworthiness, impartiality, quality and public value, and are fully compliant with the Code of Practice for Statistics. While the new method of data collection at the incident-level has yet to be specifically assessed, the source of the data (police stop and search records) remains the same and it is only the format in which the Home Office receives the data that has changed.
The Home Office worked closely with the UK Statistics Authority to improve information on the quality and limitations of the various datasets, and the ways in which the Home Office engages with users of the statistics. This is documented in the User Guide, which is published alongside this release.
Given the known issues around the quality of the data, statistics in this release on outcomes and whether the outcome was linked to the reason for the search (formerly referred to as ‘Best Use of Stop and Search’ data) are designated as Official Statistics, and not National Statistics.
2. Stop and search
Record-level data on stop and search from police forces, which means that each row of data relates to a single incident of stop and search, has been collected for searches since April 2020 This expansion of the data collection also covers information on the age and sex of the person searched, details on whether a weapon was found, the date and time information of the search, and the precise geographic location (using X-Y coordinates) of where the search was recorded.
Greater Manchester Police (GMP) were only able to provide robust data for part of the year ending March 2020. Their stop and search data has been removed from long-term year-on-year comparisons, to provide a consistent time series. However, they are included in comparisons using data solely from the year ending March 2021 and year ending March 2022.
Key results
In the year ending March 2022:
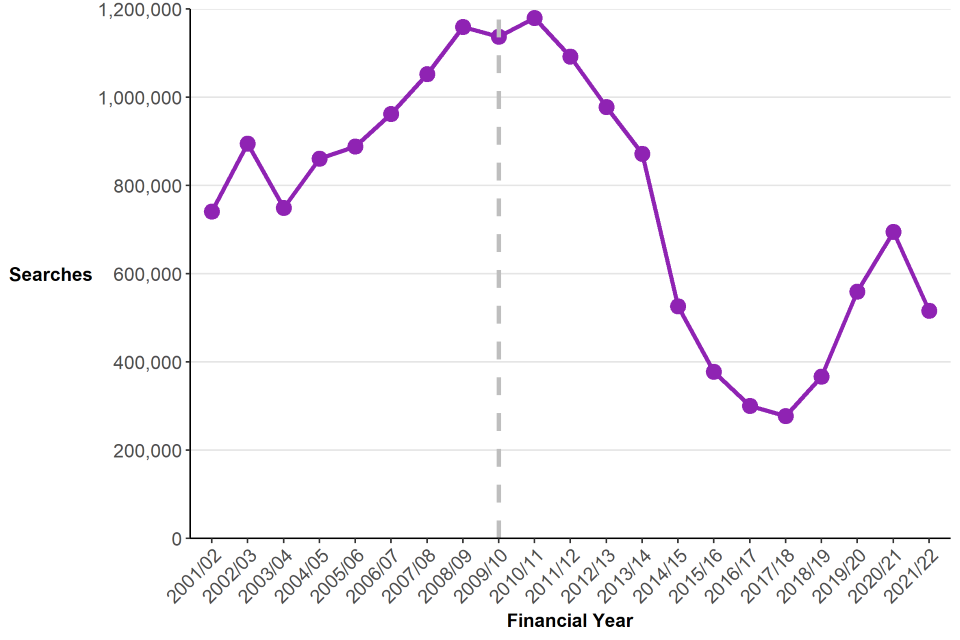
There were 526,024 stop and searches conducted under section 1 PACE by police in England and Wales (including British Transport Police). This is a decrease of 179,888 (25%) compared with the previous year, and 8% below the level of stop and search in the year ending March 2020 (the year preceding the pandemic). The increased level of stop and search in the year ending March 2021 was partly due to proactive policing during COVID-19 lockdowns.
Figure 2.1: Number of stop and searches under section 1 PACE and associated legislation, England and Wales, year ending March 2002 to March 2022
Source: Stop and Search table SS_02, Home Office
Notes:
- Data prior to the year ending March 2010 do not include the British Transport Police (BTP). Data from the year ending March 2010 onwards includes the BTP but excludes GMP. Due to this, stop and search data before the year ending March 2010 are not directly comparable with more recent years. BTP usually account for between 1.0% and 2.0% of all and search across England and Wales per year.
The decrease was driven by a 30% reduction in the number of searches for drugs, which fell from 484,917 in the year ending March 2021 to 339,662 in the year ending March 2022. The number of drugs searches in the latest year was only 5% below the number in the year ending March 2020 though. There were smaller decreases in searches for offensive weapons (down 5%) and firearms (down 4%), and a small increase in the number of criminal damage searches (up 1%).
Although overall searches under section 1 PACE (and associated legislation) are down by 8% in the year ending March 2022 compared with the year ending March 2020 (the year preceding the pandemic), 23 out of 43 police forces (including British Transport Police, but excluding Greater Manchester Police) saw an increase in the use of stop and search over that two-year period.
Of those 526,024 searches under section 1 PACE (and associated legislation), 66,772 led to an arrest. While the volume of arrests is 18% lower than the previous year, the arrest rate increased from 11% to 13% (since the decrease in the number of arrests is smaller than the fall in stop and searches). In 71% of stop and searches the outcome was recorded as needing ‘No further action’, similar to the previous year.
Police in England and Wales carried out 4,341 stop and searches under section 60 of the Criminal Justice and Public Order Act in anticipation of violence, a decrease of 52% compared with the number of searches under the same power in the year ending March 2021 (down from 9,002 to 4,341).
In total, police in England and Wales carried out 530,365 stop and searches, a decrease of 26% compared with the previous year (down 184,549 from 714,914 to 530,365). This is also 10% lower than the total number of stop and searches carried out in the year ending March 2020 (the year preceding the pandemic).
Two thirds (66%) of stop and searches in the year ending March 2022 were of males aged between 15 and 34, while this cohort comprises 13% of the overall population. Males aged 15-19 had the highest rate of stop and search, at 70 stop and searches per 1,000 population in the year ending March 2022.
Based on self-defined ethnicity, individuals from a black or black British background were searched at a rate 6.2 times higher than that of those from a white ethnic group (compared with 7.0 times in the previous year), across England and Wales. Individuals identifying as Asian or Asian British were searched at a rate 2.1 times that of those from a white ethnic group (compared with 2.4 in the previous year). Individuals identifying as mixed ethnicity were searched at a rate 2.3 times that of those from a white ethnic group (compared with 2.4 in the previous year). People from other ethnic groups were searched at a rate 2.7 times higher than that of those from a white ethnic group, the same as the previous year. These differences do not account for different likelihoods of being either a suspect or a victim of crime.
2.1 Introduction
This section presents the latest statistics on stop and searches conducted by the territorial police forces in England and Wales (as well as the British Transport Police) under three different legislative powers. These are:
- section 1 of the Police and Criminal Evidence (PACE) Act 1984 and associated legislation[footnote 1]
- section 60 of the Criminal Justice and Public Order Act (CJPOA) 1994
- section 47A (previously section 44) of the Terrorism Act (TACT) 2000
These powers allow police to search persons and vehicles without a warrant in specific situations. Details of the above legislation and the legislation associated with section 1 of PACE are included in the User Guide.
This section includes statistics on the:
- change in the use of stop and search throughout the last two years
- number of stop and searches, and subsequent arrests carried out under different legislation
- reason for the stop and search
- ethnicity of persons stopped
- sex of persons stopped
- age of persons stopped
- day-of-week and time-of-day trends in stop and search
- stop and search hotspots
- an exploration of the relationship between stop and search activity and deprivation
Missing data
Following the transition from a legacy IT system to a new force system, Greater Manchester Police (GMP) were unable to provide data returns to the Home Office, including stop and search, for the full year ending March 2020. Data for the first quarter of the year ending March 2020 was collected prior to these issues, and is included in stop and search open data tables accompanying this publication. Work is ongoing to rectify and improve the information held on their system, and GMP have provided full data for the years ending March 2021 and March 2022. However, given ongoing improvement work, the data should be interpreted with caution, and is likely to be revised in future editions of these statistics. Additionally, as the force were only able to provide robust data for part of the year ending March 2020, Greater Manchester’s stop and search data has been removed from long-term comparisons in this chapter, to provide a consistent time series. However, their data is included in comparisons of the latest two years of data only.
2.2 Two-year trend in stop and search and the impact of COVID
Since the year ending March 2021, the Home Office collected information on the exact date on which stop and searches took place, enabling more insightful seasonal analysis on the data.
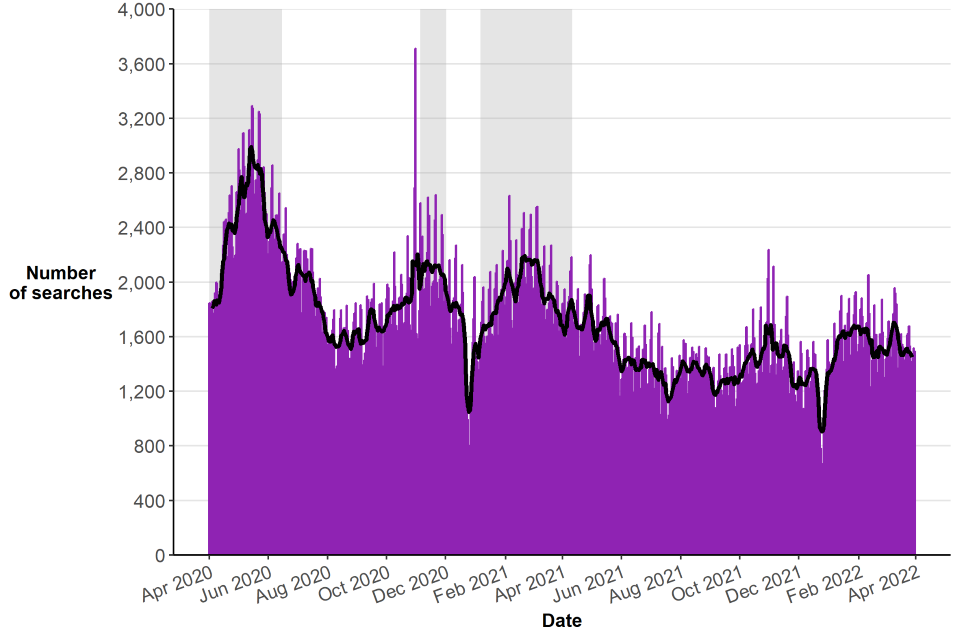
Figure 2.2 shows the daily and rolling 7-day average number of searches in the two years from 1 April 2020 to 31 March 2022, with periods in lockdown highlighted in grey. Whilst it is difficult to define exactly what constitutes a “national lockdown” given differing rules in different areas, and also when lockdowns start and finish, in this analysis “national lockdown” refers to dates when the majority of “non-essential retail” was closed.
Figure 2.2: Daily number and rolling 7-day average number of searches, year ending March 2021 and year ending March 2022
Source: Stop and Search table SS_37, Home Office
Notes:
- 7-day rolling average is calculated by taking the average of the number of searches on the three days prior to a certain date, the date itself, and the three following days.
In the year ending March 2022, using the 7-day rolling average measure, the number of stop and searches peaked at 1,904 on 28 April 2021. By contrast, the 7-day rolling average had a much higher peak in the year ending March 2021, at 2,990 on 14 May 2020.
In the year ending March 2021, the peak number of searches in May 2020 coincided with the middle of the first national lockdown. During this period, persons or vehicles travelling against regulations were more visible, and may have been more likely to be stopped and searched. Police forces reported that engagement with people may have started in relation to lockdown movement restrictions, but then led to a stop and search, for example due to suspicion that the person was in possession of drugs. On average, there were 2,148 searches per day during lockdowns, compared with 1,755 during non-lockdown periods.
In the year ending March 2022, the day with the most searches was 31 October 2021, on which 2,237 searches took place. In the year ending March 2021, the day with the most searches was 31 October 2020, on which 3,713 searches took place. This shows the heightened level of policing activity during Halloween gatherings and celebrations.
In the year ending March 2022, the day with the fewest searches was 25 December 2021, on which only 401 searches took place. This date is the same low point in the year to March 2021 (518 searches on 25 December 2020). This reflects the fact that more people are likely to be at home on Christmas day, and there may also be fewer police officers on duty.
2.3 Section 1 PACE and associated legislation
In this section we refer to ‘section 1 PACE’ searches which includes other legislation such as searches conducted under section 23 Misuse of Drugs Act (1971). For examples of other legislation included under section 1 searches see the User Guide.
In the year ending March 2022 there were 526,024 stop and searches conducted under section 1 PACE by police in England and Wales (including British Transport Police). This reverses the trend from the last three years, in which the number of stop and searches had been increasing. The number of searches under section 1 PACE in the year ending March 2022 was down by 179,888 (or 25%) compared with the year ending March 2021 (705,912).
Given the unique circumstances of policing during the year ending March 2021, the following section compares the year ending March 2022 with the year ending March 2020, which was largely unaffected by the pandemic. Greater Manchester Police (GMP) were unable to provide complete data in the year ending March 2020, and are therefore excluded from this section.
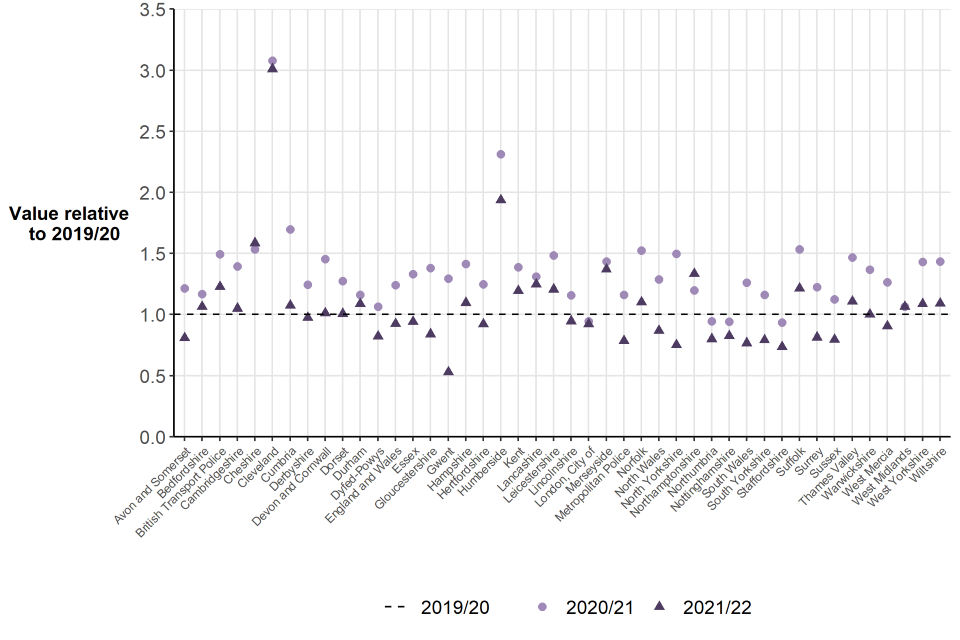
Excluding Greater Manchester Police, there were 516,642 stop and searches in the year ending March 2022, a fall of 8% compared with the year ending March 2020, in which there were 559,201 stop and searches under section 1 PACE. The change over this period has been driven by a reduction in stop and searches undertaken by the Metropolitan Police (down 22% from 268,384 to 210,347). Excluding Greater Manchester Police and Metropolitan Police, the number of stop and searches under section 1 PACE increased by 5% between the year ending March 2020 and year ending March 2022. Overall, 23 police forces in England and Wales have seen an increase in the use of stop and search over that two-year period, and 20 have seen a decrease (Figure 2.3). Cleveland had the largest relative increase in their use of stop and search between the year ending March 2020 and year ending March 2022, with stop and search at levels about 3 times higher now than they were then (from 2,063 in 2020 to 6,210 in 2022). This increase has been attributed to an increase in officer numbers, and increased training and confidence in their use of stop and search powers.
Figure 2.3: Number of searches under section 1 PACE and associated legislation, relative to the year ending March 2020
Source: Stop and Search open data tables, Home Office
Notes:
-
Values shown for each PFA are relative to the number of stop and searches that took place in the year ending March 2020, which is represented by a value of 1.0.
-
Excludes Greater Manchester Police, as they were unable to provide complete data in the year ending March 2020.
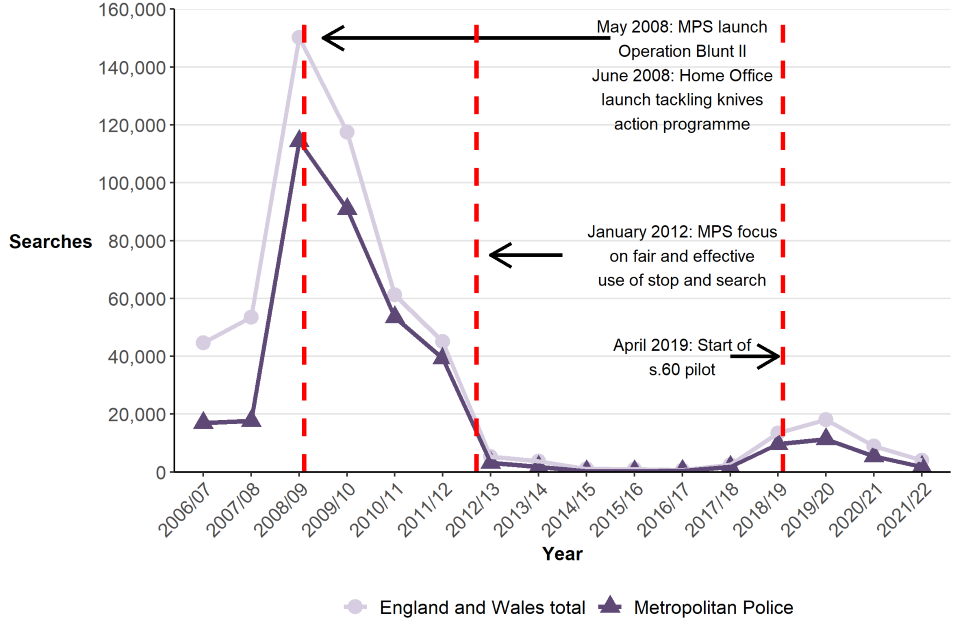
Looking at longer term changes, the number of stop and searches conducted in the year ending March 2022 was 57% below the peak recorded in the year ending March 2011 (when there were 1,229,324). The rate of reduction between the year ending March 2011 and the year ending March 2018 in stop and searches accelerated following the then Home Secretary’s decision in 2014 to re-focus the use of such powers. This trend reversed the three years between the year ending March 2019 and year ending March 2021. This was in part thought to reflect willingness to make greater use of such powers as part of the operational response to a rise in knife crime, and encouragement to the police from the current Home Secretary to use stop and search powers.
Furthermore, the Government’s pledge to recruit an additional 20,000 officers by March 2023, of which 13,566 had been recruited by March 2022, may have an impact on these figures. However, in the year ending March 2022, the number of stop and searches decreased to a figure below the number of stop and searches in the years ending March 2020 and March 2021. The fall in stop and search has been driven by a decrease in the Metropolitan Police Service (MPS) force area, which accounted for 56% of the total decrease in England and Wales in the year ending March 2022.
Figure 2.4: Number of stop and searches under section 1 PACE and associated legislation, England and Wales, year ending March 2002 to March 2022

Source: Stop and Search table SS_02, Home Office
Notes:
- Data prior to the year ending March 2010 do not include the British Transport Police (BTP). Data from the year ending March 2010 onwards includes the BTP but excludes GMP. Due to this, stop and search data before the year ending March 2010 are not directly comparable with more recent years. BTP usually account for between 1.0% and 2.0% of all and search across England and Wales per year.
Forty one of the 44 forces showed a decrease in stop and searches in the year ending March 2022 compared with the previous year, with most of the decreases in the range of 15% to 35%. Three forces showed small increases in the latest year with Northamptonshire Police showing the largest percentage rise (up 11% from 2,835 in the year ending March 2021 to 3,156 in the year ending March 2022).
In the year ending March 2021, several police forces reported that a reduction in demand for other calls to service, such as response to crime, during periods in which there were restrictions imposed due to the COVID-19 pandemic, gave increased capacity for proactive policing. In the year ending March 2022, with the easing of COVID-19 restrictions, several police forces reported that police activity was close to pre-lockdown normality, with lessened opportunity for proactive policing.
Arrests following stop and search
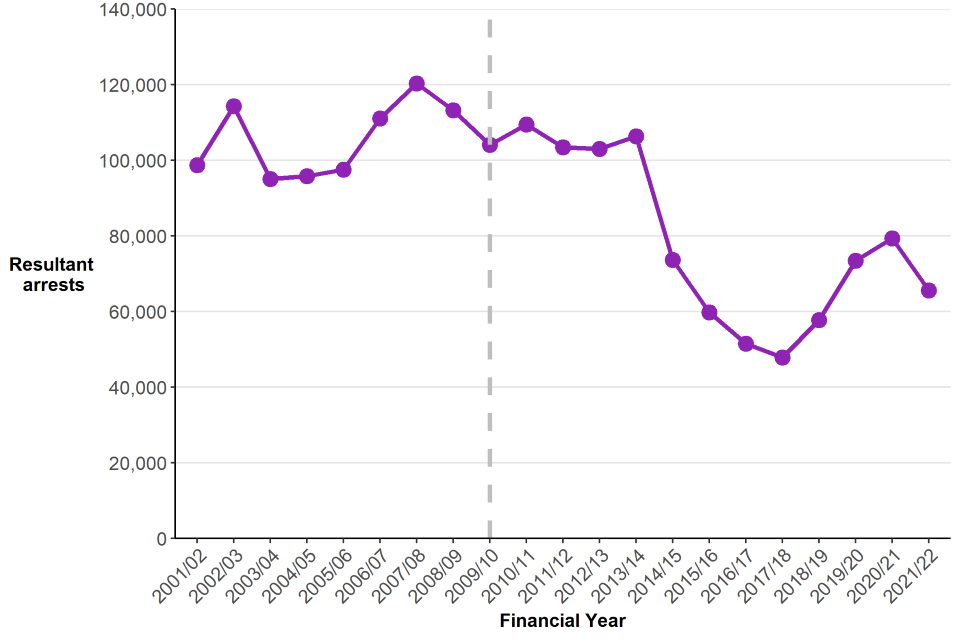
The number of resulting arrests following a stop and search decreased by 18% compared with the previous year. As Figure 2.5 shows, the number of arrests following a stop and search generally follows a similar pattern to the total number of stop and searches (Figure 2.4 above). However, arrest numbers remained fairly flat while there was a large fall in the number of searches between the years ending March 2011 and 2014, suggesting improved targeting of the power during this period.
Figure 2.5: Number of resultant arrests under section 1 PACE and associated legislation, England and Wales, year ending March 2002 to March 2022
Source: Stop and Search table SS_02, Home Office
Notes:
- Data prior to the year ending March 2010 do not include the British Transport Police (BTP). Data from the year ending March 2010 onwards includes the BTP but excludes GMP. Due to this, stop and search data before the year ending March 2010 are not directly comparable with more recent years. BTP usually account for between 1.0% and 2.0% of all and search across England and Wales per year.
Arrest rate – the proportion of stop and searches resulting in an arrest
While the number of arrests following a section 1 PACE search fell by 18% in the latest year (down from 80,940 to 66,772), this was a smaller decrease than the fall in the total number of section 1 PACE searches over the same time period (down 25%). This led to a rise in the arrest rate, up from 11% in the previous year to 13% in the latest (Figure 2.6). The lower arrest rate in the year ending March 2021 may be partly due to the increased number of searches in that year as a result of proactive policing during lockdowns. The arrest rate in the latest year has returned to a level in line with policing prior to the pandemic.
Figure 2.6: Arrest rate under section 1 of PACE, England and Wales, year ending March 2002 to March 2022
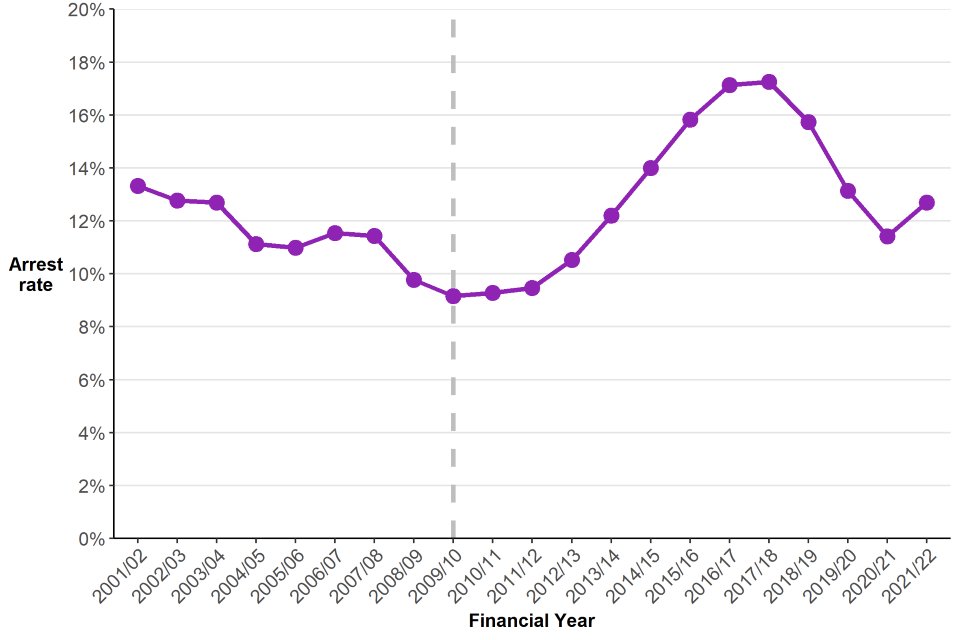
Source: Stop and Search table SS_02, Home Office
Notes:
1.Data prior to the year ending March 2010 do not include the British Transport Police (BTP). Data from the year ending March 2010 onwards includes the BTP but excludes GMP. Due to this, stop and search data before the year ending March 2010 are not directly comparable with more recent years. BTP usually account for between 1.0% and 2.0% of all and search across England and Wales per year.
Arrest is just one possible outcome following a stop and search. Data on other outcomes resulting from stop and search can be found in section 2.7 - Stop and search outcomes.
Reason for search
There are several reasons why the police may carry out a section 1 PACE stop and search, such as having reasonable grounds to suspect that an individual is carrying drugs or a weapon. Any subsequent arrests resulting from a PACE search may not be related to the initial reason for the search; for example, an officer may suspect that an individual is carrying drugs but arrest them if they are found to be carrying a weapon. As a result, while arrest rates give an overall picture of the number of searches leading to arrests, they do not give insight into arrest rates for specific offence categories. More information on how frequently arrests (and other outcomes) are linked to the initial reason for the search can be found in the link between search reason and outcome section. The Data Quality section also includes information on data collected on reason for arrest.
Year ending March 2022 compared with year ending March 2020
As stated in the section above, the police were operating in unprecedented circumstances during the year ending March 2021, therefore the following analysis compares the year ending March 2022 with the year ending March 2020, which was largely unaffected by the pandemic. GMP were unable to provide complete data in the year ending March 2020, and are therefore excluded from this section.
With the exception of criminal damage searches (up 32%) and firearm searches (up 2%), the number of searches for all other objects under section 1 PACE was lower in the year ending March 2022 than the year ending March 2020 (Figure 2.7).
Figure 2.7 PACE stop and searches by reason for search, England and Wales (excluding Greater Manchester Police), the year ending March 2020 compared with the year ending March 2021 and year ending March 2022
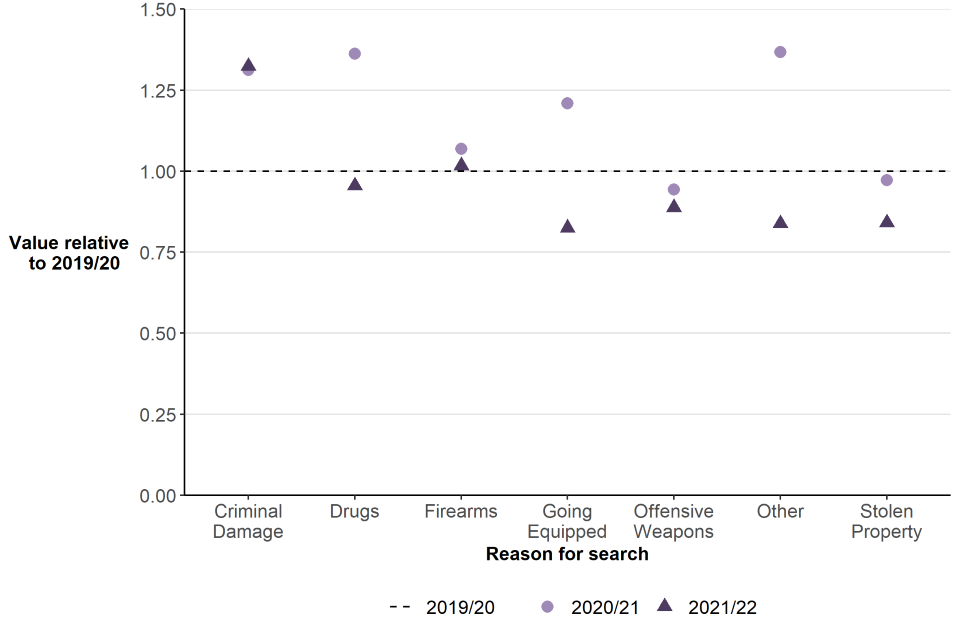
Source: Stop and Search open data tables, Home Office
Notes:
-
Values shown for each PFA are relative to the number of stop and searches that took place in the year ending March 2020, which is represented by a value of 1.0.
-
Excludes Greater Manchester Police, as they were unable to provide complete data in the year ending March 2020.
The change over this period has been driven by a reduction in stop and searches undertaken by the Metropolitan Police (down 22% from 268,384 to 210,347). Excluding Greater Manchester Police and Metropolitan Police, the number of stop and searches increased across additional search types between the year ending March 2020 and year ending March 2022, including offensive weapon searches (up 23%) and drug searches (up 5%) (Figure 2.8).
Figure 2.8 PACE stop and searches by reason for search, England and Wales (excluding Metropolitan Police and Greater Manchester Police), the year ending March 2020 compared with the year ending March 2021 and year ending March 2022
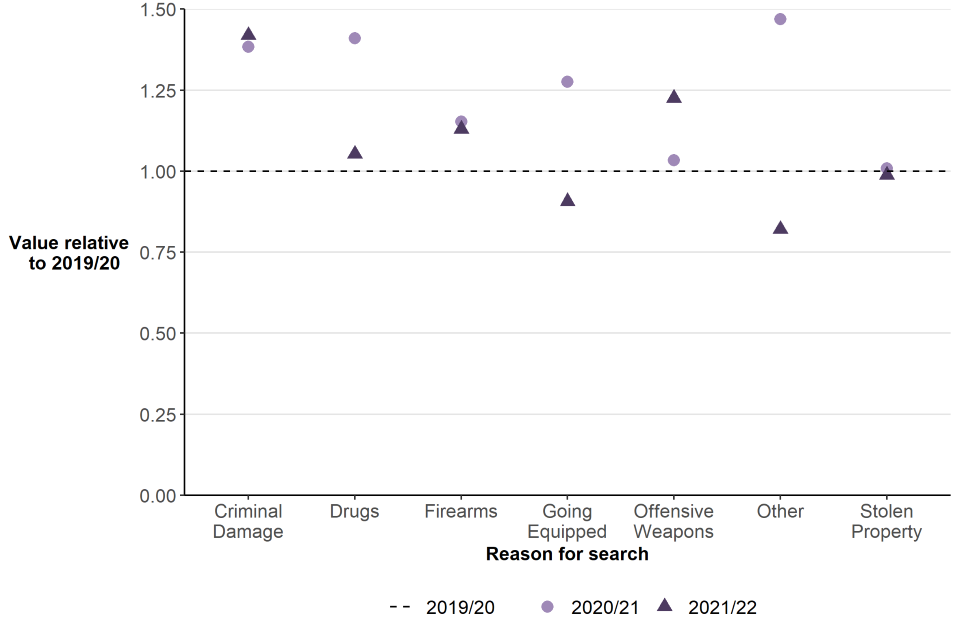
Source: Stop and Search open data tables, Home Office
Notes:
-
Values shown for each PFA are relative to the number of stop and searches that took place in the year ending March 2020, which is represented by a value of 1.0.
-
Excludes Greater Manchester Police, as they were unable to provide complete data in the year ending March 2020.
As in previous years, the most common reason for carrying out a PACE stop and search was on suspicion of drug possession. These accounted for 65% of all stop and searches in the latest year, a lower proportion than the previous one (69%) (Table 2.1). The proportion and volume of drugs searches steadily increased between the year ending March 2018 and year ending March 2021. That peak in the year ending March 2021 may have been impacted by proactive searches for drugs during lockdowns. In the latest year, the proportion of searches for drugs has fallen to a level closer to that from before the pandemic.
The proportion of searches on people suspected to be in possession of offensive weapons, articles to commit criminal damage or stolen property all increased in the latest year.
Table 2.1: Proportion of PACE stop and searches, England and Wales, years ending March 2020, March 2021 and year ending March 2022
| Reason for search | Proportion in year ending March 2020 | Proportion in year ending March 2021 | Proportion in year ending March 2022 |
|---|---|---|---|
| Drugs | 63 | 69 | 65 |
| Offensive weapons | 16 | 12 | 16 |
| Stolen property | 10 | 8 | 9 |
| Going equipped | 7 | 7 | 7 |
| Other | 2 | 2 | 2 |
| Criminal damage | 1 | 1 | 1 |
| Firearms | 1 | 1 | 1 |
Source: Stop and Search table SS_03, Home Office
Notes:
-
The ‘other’ search category includes searches under section 43 of the Terrorism Act 200 and for reasons such as fireworks.
-
Due to rounding, percentages may not sum to 100.
Apart from searches for articles to commit criminal damage, which rose slightly by 1%, the number of searches conducted in the latest year decreased across all other search reasons (Figure 2.9). The largest volume decrease was in the number of searches for drugs, which decreased by 30% from 484,917 in the year ending March 2021 to 339,662 in the year ending March 2022. The decrease in stop and searches for drugs matches trends observed in police recorded crime data, where there was an decrease in drug offences, which reflects that these offences are often discovered through stop and search.
Figure 2.9: PACE stop and searches by reason for search, England and Wales, the year ending March 2021 compared with the year ending March 2022
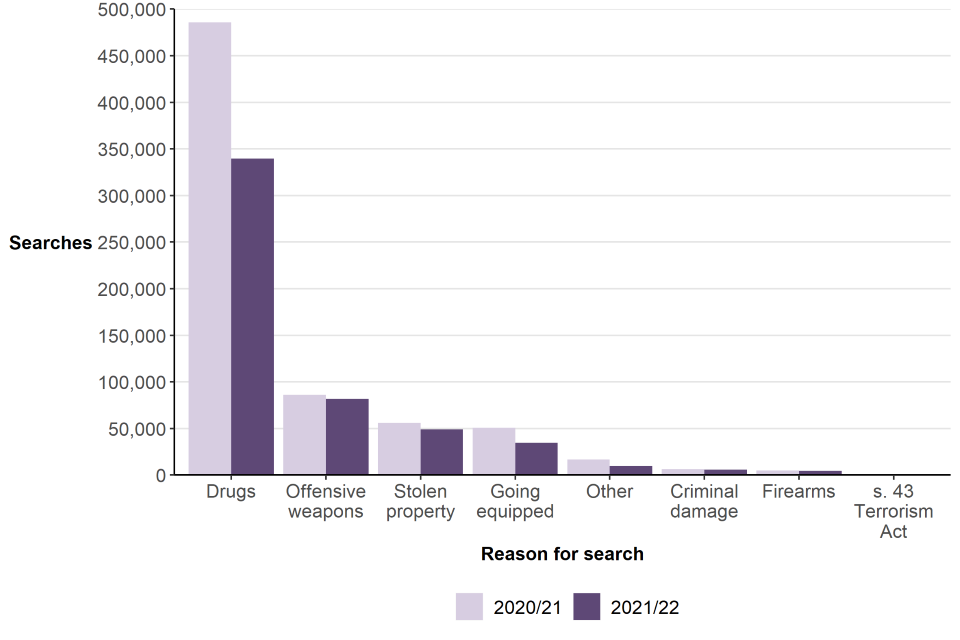
Source: Stop and Search table SS_03, Home Office
Notes:
- The ‘other’ search category includes searches for reasons such as fireworks.
Trends in the levels of stop and search across England and Wales overall are largely driven by the policing activity of the Metropolitan Police Service (MPS). Excluding MPS from year-on-year comparisons, there was a 19% increase in the number of searches for offensive weapons in the year ending March 2022 compared with the previous year. 32 police forces had a higher number of searches for offensive weapons in the year ending March 2022 compared with the previous year, with many of those reporting that they have renewed their focus on driving down serious violence.
2.4 Section 60 of the Criminal Justice and Public Order Act
Section 60 of the Criminal Justice and Public Order Act (CJPOA) 1994 enables officers to conduct ‘no suspicion’ stop and searches for dangerous instruments or offensive weapons for a limited time within a specified area, in anticipation of violence occurring in that area. This will often follow a major incident or from intelligence gathered by the police. Further details can be found in the User Guide.
From April 2019, under a pilot scheme agreed by the then Home Secretary, some changes were made to the conditions under which a section 60 search could be carried out. The changes aimed to make it easier for the police to use such powers when they judged it necessary to do so and included:
- reducing the rank of authorising officer from senior officer to inspector
- relaxing the grounds from a reasonable belief that serious violence will take place to a belief that it may take place
A phased approach was taken with 7 forces joining the pilot from 1st April 2019 whilst the remaining 37 forces joined from August 2019. Three further changes were made at that time:
- increasing the length of time the initial Section 60 order can be in place from 15 to 24 hours
- reducing the rank of officer who can extend the order for up to a further 24 hours from senior officer to superintendent
- removing the requirement for forces to communicate to local communities in advance, where practicable, where a Section 60 order is in place
In July 2021, as part of the Beating Crime Plan, the then Home Secretary announced a permanent relaxation of all five voluntary conditions outlined above.
In the year ending March 2022, police in England and Wales carried out 4,341 stop and searches under section 60 CJPOA, a decrease of 52% compared with the previous year (when 9,002 such searches were undertaken). This is the second consecutive decrease in the number of searches under section 60, following three years of increases between the year ending March 2018 and the year ending March 2020 (Figure 2.10).
The decrease in the latest year was driven by a reduction in stop and searches conducted by the Metropolitan Police Service, which decreased by 67% from 5,395 to 1,760. Other forces, including Merseyside and Thames Valley also saw large decreases in the number of searches under section 60 CJPOA in the latest year. However, some forces conducted more section 60 searches in the latest year, including West Midlands, West Yorkshire and Greater Manchester Police.
Figure 2.10: Stop and searches under section 60 CJPOA, England and Wales, year ending March 2007 to March 2022
Source: Stop and Search open data tables, Home Office
Notes:
- Data from the year ending March 2010 onwards includes the British Transport Police (BTP) but excludes Greater Manchester Police. Prior to this data are not directly comparable with more recent years.
The number of forces making at least one stop and search under section 60 powers decreased from 20 to 18 of the 44 forces in England and Wales (including BTP) in the latest year. As in previous years, most section 60 stops took place in London with the MPS accounting for more than two-fifths (41%) of all section 60 searches in England and Wales. This was followed by Kent Police and West Midlands Police, each of which accounted for 12% of the total number of section 60 searches.
The proportion of section 60 searches that resulted in an arrest in the latest year was 3.4%, down slightly from the previous year (3.7%).
Between the year ending March 2003 and the year ending March 2016, the arrest rate fluctuated between 2% and 6% then, in the year ending March 2017 the arrest rate peaked at 12% (72 of 622 searches resulted in arrest). However, since then, the arrest rate has steadily declined to 8% in the year ending March 2018, 5% in the year ending March 2019 and 4% in the years ending March 2020 and March 2021. As in previous years, the arrest rate for section 60 searches (3.4%) was much lower than those under section 1 of PACE (13%).
2.5 Section 47A (previously section 44) of the Terrorism Act 2000
Section 47A (as amended by the Protection of Freedoms Act 2012) of the Terrorism Act 2000 (TACT) allows the police to exercise stop and search powers when there is reasonable suspicion an act of terrorism will take place, and only when such powers are considered necessary to prevent such an act taking place. This must be authorised by a senior officer, at least at the rank of Assistant Chief Constable, and the area and duration of the authorisation must be no greater than is necessary to prevent such an act. Section 47A of TACT stop and search powers replaced similar powers under section 44 of TACT on 18 March 2011. Further information on these searches can be found in the User Guide.
In the last four years, stop and search powers under section 47A of TACT were not used. In year ending March 2018, there were 149 stop and searches under section 47A of TACT, details of which can be found in the bulletin from that year.
2.6 Stop and search by Police Force Area
The MPS continued to account for a large proportion of all stop and searches[footnote 2] conducted in England and Wales (40% in the year ending March 2022), though this is down slightly on the previous year, in which the MPS accounted for 44% of the total number of searches.
When examining the use of stop and search amongst different police forces, a traditional approach is to express rates of stop and search per head of resident population, using population figures produced by the Office for National Statistics (ONS). This allows for more meaningful comparisons between areas than solely using the volume of searches in that area. However, calculating the rate based on the resident population has several limitations, such as not accounting for the volume of commuters and tourists in areas with substantial influx of non-residents. Additionally, looking at the rate across the Police Force Area (PFA) as a whole masks variation within the area (see section 2.11 - hotspot analysis). Lastly, looking at the overall population within a PFA ignores the fact that stop and search is particularly concentrated on young men (see section 2.9 – Age of sex of persons stopped and searched).
PFA analysis to compare overall rates per 1,000 population and disparity rates for each ethnic group compared with the white group can be found in section 2.8 (Ethnicity of persons searched).
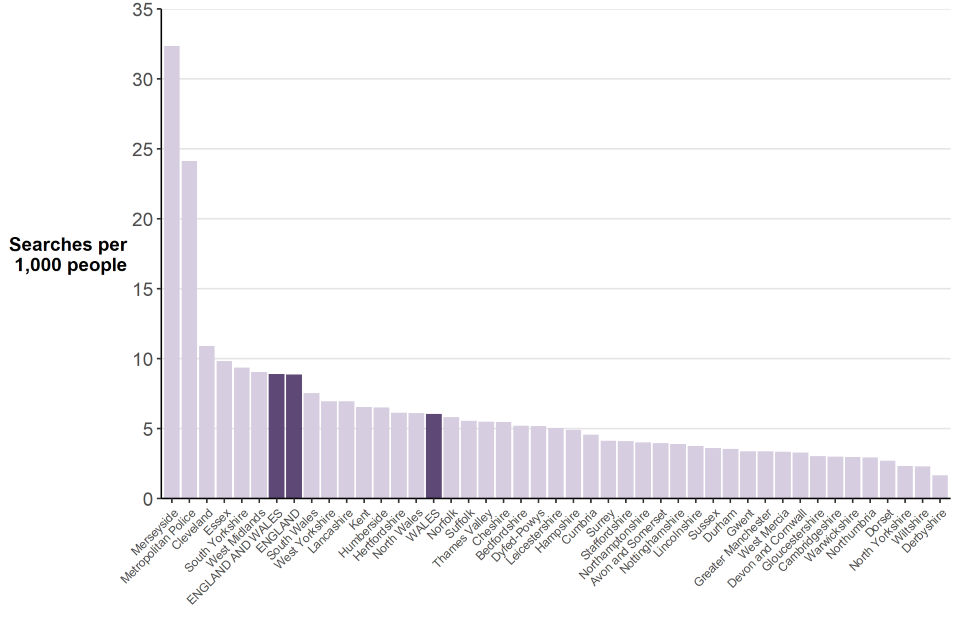
In England and Wales there were 9 stop and searches per 1,000 population in the year ending March 2022. Merseyside PFA had the highest rate at 32 per 1,000 population[footnote 3], followed by Metropolitan Police Service PFA, which had a rate of 24 per 1,000 population (Figure 2.11).
Figure 2.11: Stop and search per 1,000 population, England and Wales, year ending March 2022
Source: Stop and Search table SS_21, Home Office
Notes:
- Includes stop and searches under section 1 of PACE and associated legislation, and section 60 of the Criminal Justice and Public Order Act 1994.
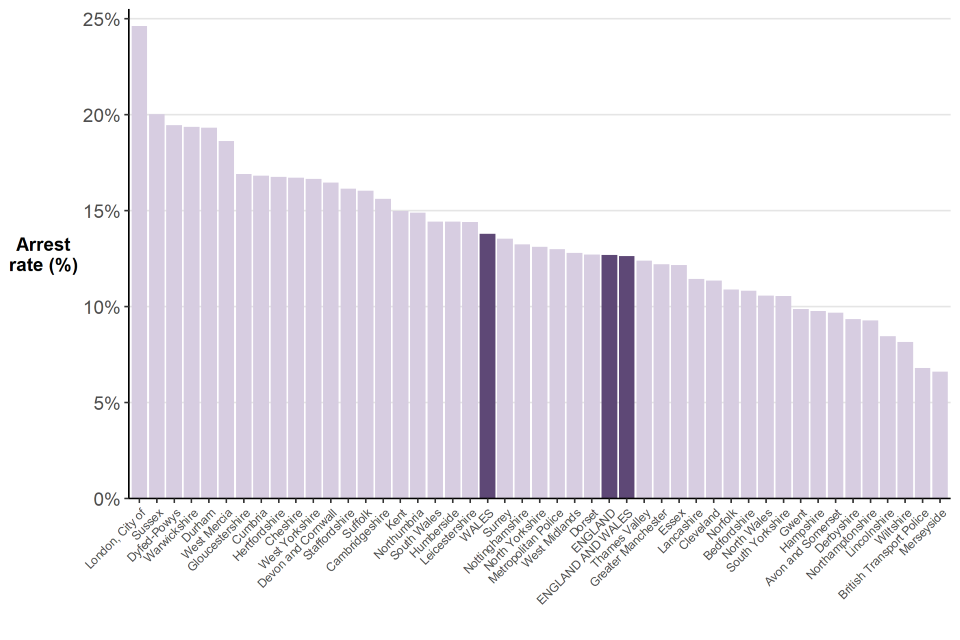
Searches conducted under section 1 PACE and section 60 CJPOA combined resulted in an 13% arrest rate in England and Wales for the latest year (Figure 2.12). By comparison, stop and searches in the City of London resulted in the highest arrest rate (25%) followed by Sussex (20%). Merseyside had the lowest arrest rate, with 7% of searches leading to an arrest.
Figure 2.12: Arrest rate following a stop and search, England and Wales, year ending March 2022
Source: Stop and Search table SS_21, Home Office
Notes:
- Includes stop and searches under section 1 of PACE and associated legislation, and section 60 of the Criminal Justice and Public Order Act 1994.
While an arrest is one possible outcome of a stop and search, there are a range of other outcomes that could indicate a successful search, including the issuing of police cautions, cannabis or khat warnings, community resolutions and summonses. These are included in the stop and search outcomes section 2.7.
2.7 Stop and search outcomes
Historically, forces have provided data on the number of stop and searches conducted, and the number of resultant arrests. Arrests represent only one of several possible outcomes available to the police when conducting a stop and search. Since the year ending March 2017, police forces have reported on a wider range of outcomes including:
- arrests
- cautions
- summons
- penalty notices for disorder
- cannabis or khat warnings
- community resolutions
- no further action
Since the year ending March 2021, the Home Office have expanded the list of viable outcomes to also include:
- voluntary attendance
- verbal warning or words of advice
- seizure of property
- guardian intervention
- other action
In years prior to the year ending March 2021, the new options would have been classed as ‘no further action’. Therefore, comparisons with previous years on the proportion of searches that resulted in ‘no further action’ should be interpreted with caution. A full breakdown of stop and search outcomes is available in the data tables accompanying this publication.
One outcome per stop and search
For each stop and search, only the first outcome is recorded. For example, where a criminal sanction follows an arrest, only the arrest will be shown in these statistics. Therefore, outcomes that follow an arrest (such as cautions) will be an under-count of the actual number of such outcomes. The data should therefore not be used to infer, for example, the total number of cautions that result from stop and searches.
Outcome linked to reason for stop and search
Forces are also required to report on whether the outcome was linked to the initial reason for conducting the search. For example, police may stop someone on suspicion of carrying drugs. If cannabis is found during the search and the person is given a cannabis warning, then the outcome is linked to the reason for the search. However, if a weapon is found instead of cannabis and the person is arrested, the outcome is not linked to the initial reason for the search.
Tracking whether or not the outcome is linked to the reason for the search aims to increase transparency by allowing for a distinction between outcomes where the officer found what they were searching for, those where the item found was not what the officer was initially searching for, or where nothing was found.
Limitations of outcomes data
The findings in this section should be considered with caution. They give a reasonable indication of the picture at the national level, but users should be wary of making force level comparisons.
While the outcome of each stop and search is relatively straightforward to record, the link between the reason for the search and the search outcome is more complex. In many forces, officers themselves assess whether a link is involved, and so there is an element of subjectivity involved. It is likely that different officers may classify whether there is a link or not in different ways.
Furthermore, a number of forces have adopted mobile devices to allow officers to directly record stop and searches at the scene, as well as the outcome following a stop and search. Some forces have reported inconsistencies in the way officers use these devices, leading to difficulties when deciding whether the outcome of the search was linked to the reason for the search (for example, more than one outcome was recorded, or the officer had marked the outcome as “linked” to the reason for the search where it did not appear that the outcome was linked).
Given the known issues around the quality of stop and search link and outcome data, these statistics are designated as Official Statistics, and not National Statistics.
Principal outcome following a stop and search
These data include the initial outcome given following the search only. It should be noted that ‘no further action’ can include a wide range of scenarios. It is therefore possible that, in some cases, an outcome of ‘no further action’ could be given where the officer finds what they were looking for (outcome linked) but decides not to deal with it by means of arrest, cautions, community resolutions or another outcome. For example, a person could have a lawful reason for carrying an item which the officer might have been perceived as a weapon. Additionally, if a child has been used to carry a prohibited article for an adult, the carrier may be treated as a witness rather than have action taken against them. Lastly, in circumstance where a person may be found with weapons or drugs with the intent to harm themselves, the subjects may be treated in a supportive way rather than arrested.
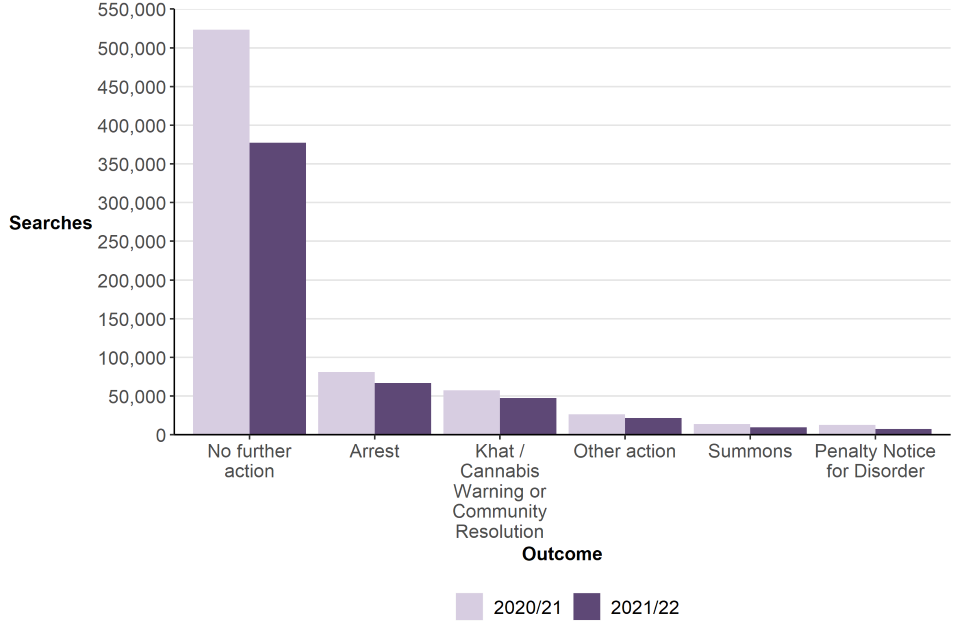
These data include searches under both section 1 Police and Criminal Evidence Act (PACE) and section 60 of the Criminal Justice and Public Order Act 1994. In 71% of stop and searches the outcome was recorded as needing ‘No further action’. In a further 13% the initial outcome was an arrest and an alternative outcome was given in the remaining 16% of cases. These proportions are all similar to the previous year (Table 2.2).
Figure 2.13: Principal outcome following stop and search, England and Wales, year ending March 2021 and year ending March 2022
Source: Stop and Search outcomes table SSO_01, Home Office
Notes:
- Includes stop and searches under section 1 of PACE and associated legislation, and section 60 of the Criminal Justice and Public Order Act 1994.
- Includes vehicle only searches.
- Includes British Transport Police.
- Other action includes cautions, voluntary attendance, verbal warnings or words of advice, seizure of property, guardian intervention or other action.
- Comparison against 2019/20 is not included due to changes in the outcome framework, which started in 2020/21.
Table 2.2: Proportion of outcomes following a stop and search, in the year ending March 2021 and the year ending March 2022
| Outcome | Proportion in year ending March 2021 | Proportion in year ending March 2022 |
|---|---|---|
| Arrest | 11.4 | 12.6 |
| Community Resolution | 6.2 | 7.7 |
| Summons | 1.9 | 1.8 |
| Verbal Warning / Words of Advice | 1.3 | 1.5 |
| Penalty Notice for Disorder | 1.8 | 1.4 |
| Khat / Cannabis Warning | 1.8 | 1.2 |
| Other Action | 0.9 | 0.9 |
| Seizure of Property | 0.5 | 0.7 |
| Voluntary Attendance | 0.6 | 0.7 |
| Caution | 0.4 | 0.3 |
| Guardian Intervention | 0.0 | 0.0 |
| No further action | 73.2 | 71.2 |
Source: Stop and Search outcomes table SSO_01, Home Office
Notes:
- Includes British Transport Police.
If the outcomes introduced in the year ending March 2021 are considered to be ‘No further action’ (as they would have been prior to that year), then 75% of searches in the year ending March 2022 resulted in ‘No further action’. This is down slightly from the year ending March 2021, in which 77% of searches resulted in ‘No further action’, by that same measure.
Link between outcome and reason for a stop and search
In the latest year, 23% of stop and searches resulted in an outcome that was linked to the reason for the search, a slightly higher figure than last year (20%). However, this varied by the reason for search. For example, 28% of drugs searches resulted in a linked outcome, whereas only 3% of searches under Section 60 of Criminal Justice and Public Order Act 1994 resulted in a linked outcome. This lower rate for Section 60 searches reflects the fact that they are undertaken to try and resolve violent situations swiftly in a specific area, without reasonable grounds to suspect the people being searched.
Table 2.3: Proportion of stop and search where the outcome of the stop was linked to the reason for the stop and search, by reason for stop, England and Wales, year ending March 2022
| Reason for search | Outcome linked to reason for search | Outcome not linked | Nothing found |
|---|---|---|---|
| Drugs | 28 | 3 | 70 |
| Stolen property | 21 | 6 | 73 |
| Firearms | 15 | 7 | 78 |
| Offensive weapons | 11 | 6 | 82 |
| Criminal damage | 11 | 6 | 83 |
| Going equipped | 10 | 8 | 82 |
| S.43 (Terrorism) | 6 | 5 | 90 |
| Other | 21 | 6 | 72 |
| Total Section 1 PACE | 23 | 4 | 73 |
| S.60 (Violence) | 3 | 5 | 92 |
| Total | 23 | 4 | 73 |
Source: Stop and Search open data tables, Home Office
Notes:
-
Proportions are calculated excluding cases where an object was found however the link between the reason for search and outcome is unknown, or where it’s unknown whether an object was found.
-
The ‘other’ search category includes searches under Section 1 PACE that do not fall into other categories.
-
Due to rounding, percentages may not sum to 100.
Weapons found from stop and search
The Home Office stop and search data collection was expanded in the year ending March 2021 to allow for provision of more detailed information on whether an offensive weapon or firearm was found in a stop and search encounter. Previously, data were only collected on whether an offensive weapon was found from a search conducted under s.60 of the Criminal Justice and Public Order Act.
Different police forces may have different ways of recording the property found during a stop and search, and it may not always be clear whether an offensive weapon or firearm was found. For example, a record may state that a search was carried out for an offensive weapon, and that the outcome was related to the reason for the search, suggesting that an offensive weapon was found. However, the specific ‘property found’ part of the record may not mention an offensive weapon. Alternatively, a record of search for an offensive weapon may include information that states a stolen or prohibited article was not found as the link between the reason for search and outcome, but have items that could be considered to be offensive weapons (such as surgical or construction equipment) within the details of property found.
Additionally, other Home Office statistical collections have highlighted the challenges of determining whether a knife or sharp incident was involved in a crime, particularly when reliant on officers to tag records with that information. Additionally, the data collected does not indicate whether multiple weapons were found in a single search. Therefore, the figures presented here are estimates and should be used with caution.
Approximately 14,900 (3%) of searches in the year ending March 2022 resulted in an offensive weapon or firearm being found. Approximately 3,500 of those weapons or firearms were found when the initial search reason was for drugs.
Outcomes by Police Force Area
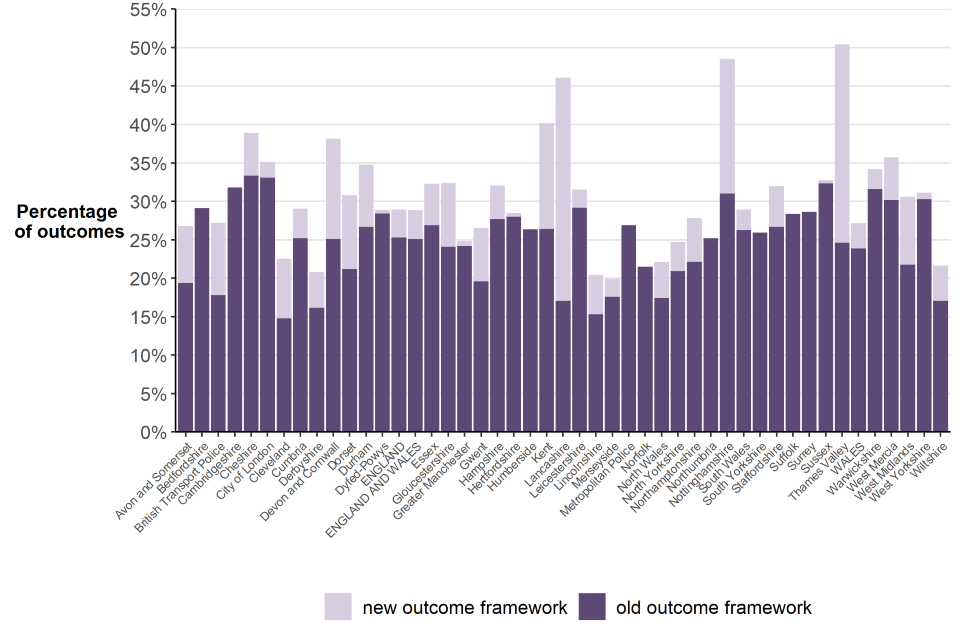
Figure 2.14 shows the outcome rate for each Police Force Area in the year ending March 2022. The figures are broken down by searches that resulted in action being taken as part of the old outcome framework (which consisted of arrest, summons, caution, khat or cannabis warning, penalty notice for disorder or a community resolution), or as part of the new outcome framework (voluntary attendance, verbal warning or words of advice, seizure of property, guardian intervention or other action). Due to inconsistency between forces in how the new outcome framework Is being applied, the figures should be interpreted with caution. Based solely on the old outcome framework, Cheshire Constabulary had the highest percentage of searches where action was taken (33%). Overall, Thames Valley Police had the highest number of searches where action was taken (50%), however, a large proportion of those were verbal warnings or words of advice (21%)
Figure 2.14 Outcome rate following a stop and search, England and Wales, year ending March 2022
Source: Stop and Search outcomes table SSO_10, Home Office
Outcomes by ethnicity of person searched
Table 2.4 shows the outcome rates for each ethnic group. This uses the method whereby if the self-defined ethnicity of the person searched was ‘not stated’, then the officer-defined ethnicity is used instead.
People who self-defined their ethnicity as black, mixed or other (or perceived by the officer to belong to one of those ethnicities, if not stated) had an arrest rate of 14%. White people had an arrest rate of 12.3%, and people who self-defined or were perceived to be of Asian ethnicity had the lowest arrest rate (11.1%).
Despite having equal arrest rates, black people had the highest rate of ‘No further action’ outcomes, whereas people from a mixed or other background had the lowest rate of no further action outcomes. This is largely due to the difference in community resolution or cannabis warning outcomes between these two groups (7.8% for black, 10.6% for mixed or other).
Table 2.4 Proportion of outcomes following a stop and search, by ethnic group
| Outcome | White | Black | Asian | Mixed or Other | Not known | All person searches |
|---|---|---|---|---|---|---|
| Arrest | 12.3 | 14.0 | 11.1 | 14.0 | 7.8 | 12.6 |
| Community Resolution or Cannabis Warning | 9.1 | 7.8 | 9.5 | 10.6 | 6.7 | 9.0 |
| Penalty Notice for Disorder | 0.9 | 2.3 | 2.5 | 1.9 | 0.7 | 1.4 |
| Summons | 1.9 | 1.6 | 1.7 | 1.5 | 1.1 | 1.8 |
| Other | 4.8 | 1.5 | 3.4 | 3.1 | 5.6 | 3.9 |
| No Further Action | 70.9 | 72.8 | 71.8 | 68.8 | 78.0 | 71.3 |
Source: Stop and Search outcomes table SSO_11, Home Office
Notes:
-
Due to rounding, percentages may not sum to 100.
-
Excludes vehicle only searches.
-
Cannabis warnings and community resolutions are grouped as many police forces no longer issue cannabis warnings.
-
‘Other’ outcomes include caution, voluntary attendance, verbal warning, seizure of property, guardian intervention or other action.
2.8 Ethnicity of persons searched
When a stop and search is undertaken, the person being searched is asked by the police which ethnic group they consider themselves to belong to. This is a measure of “self-defined” ethnicity rather than “officer observed” and is the preferred measure of ethnicity. For the purpose of analysis, the 18 ethnicity categories as defined by the ONS 2011 Census, were grouped into the following categories:
- White
- Black (or black British)
- Asian (or Asian British)[footnote 4]
- Mixed
- Other Ethnic Group
- Not Stated
Additionally, officer-observed ethnicity may also be recorded as one of the following:
- White
- Black
- Asian
- Other
Since the year ending March 2021, the Home Office have collected stop and search data on both the “officer observed” ethnicity and the self-defined ethnicity of the person searched, for individual records. This means that if the self-defined ethnicity of the person searched was not stated, officer-observed ethnicity can be used as a proxy, for analytical purposes.
This section begins by examining the ethnicity of people stopped and searched using the traditional method, based solely on self-defined ethnicity. The latter section uses the newer approach, in which when the self-defined ethnicity of the person searched was not stated, officer-observed ethnicity is used instead. The approach is an attempt to reduce uncertainty in disparity rates based solely on self-defined ethnicity, caused by the growing proportion of records in which this information is not stated (20% in the year ending March 2022). This latter approach is only possible for data in the latest two reporting years.
Self-defined ethnicity of persons searched
The MPS consistently account for a large proportion of all stop and searches in England and Wales (40% in the year ending March 2022) and also has a larger proportion ethnic minorities (excluding white minorities) within its resident population (40%) than the rest of England and Wales (10% - excluding MPS)[footnote 5]. Table 2.5 presents the data for the MPS area separately, as well as distinct England and Wales totals, with one including and the other excluding the MPS area. Table 2.5 shows that for both section 1 PACE searches and section 60 searches, stops of individuals who define themselves as black, Asian and other minority ethnic groups accounted for a larger proportion of all stops in the MPS area when compared with forces in the rest of England and Wales.
Table 2.5: Proportion of stop and searches by self-defined ethnic group, England and Wales and the MPS area, year ending March 2022
| Legislation | Police Force Area(s) | White | Black | Asian | Other | Mixed | Not stated |
|---|---|---|---|---|---|---|---|
| Section 1 | E&W excl. MPS | 68 | 6 | 8 | 1 | 3 | 15 |
| Section 1 | MPS | 32 | 23 | 12 | 3 | 3 | 27 |
| Section 1 | England & Wales | 53 | 13 | 9 | 2 | 3 | 20 |
| Section 60 | E&W excl. MPS | 46 | 12 | 16 | 2 | 5 | 19 |
| Section 60 | MPS | 18 | 28 | 12 | 2 | 3 | 38 |
| Section 60 | England & Wales | 35 | 18 | 14 | 2 | 4 | 26 |
| All searches | E&W excl. MPS | 68 | 6 | 8 | 1 | 3 | 15 |
| All searches | MPS | 32 | 23 | 12 | 3 | 3 | 27 |
| All searches | England & Wales | 53 | 13 | 9 | 2 | 3 | 20 |
| Population | E&W excl. MPS | 90 | 2 | 6 | 1 | 2 | 0 |
| Population | MPS | 60 | 13 | 18 | 3 | 5 | 0 |
| Population | England & Wales | 86 | 3 | 8 | 1 | 2 | 0 |
Source: Stop and Search table SS_23, Home Office
Notes:
-
Excludes vehicle only searches.
-
Includes searches under section 1 PACE and associated legislation and section 60 of the Criminal Justice and Public Order Act 1994.
-
Due to rounding, percentages may not sum to 100.
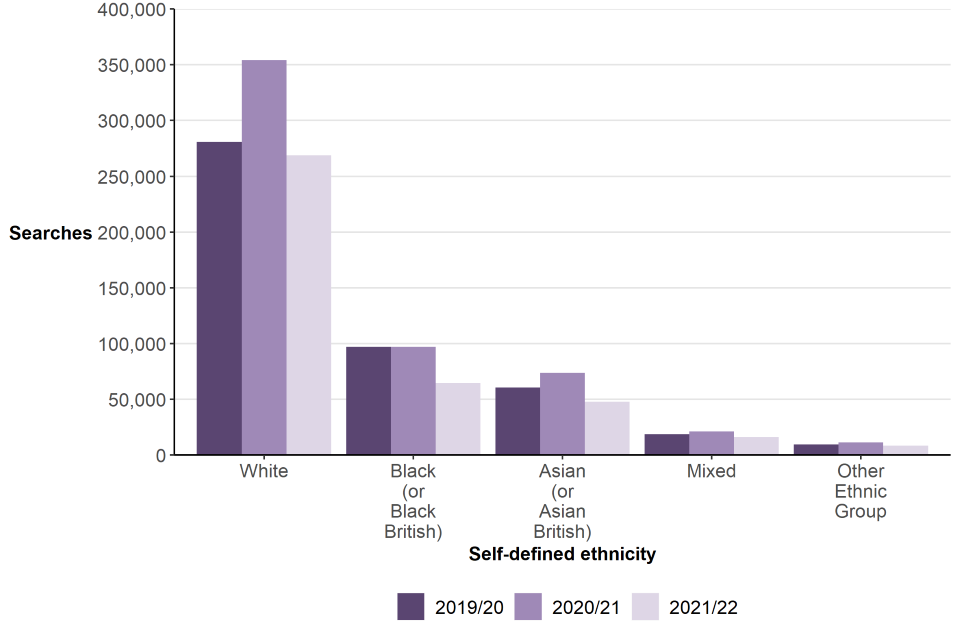
The number of searches of people who self-defined as white decreased by 84,986 (24%), from 359,273 to 274,287 in the latest year (a decrease of 4% since the year ending March 2020). The next-highest volume decrease was for those from the black (or black British) group, which decreased by 32,488 (33%) from 97,990 to 65,502. There was a similar decrease in searches of people from the Asian (or Asian British) group, which decreased by 26,047 (35%) from 74,976 to 48,929. There were slightly smaller decreases in the number of searches of people from mixed ethnic backgrounds (which decreased by 5,205 (24%) from 21,412 to 16,207) and people from other ethnic groups (which decreased by 2,935 (26%) from 11,473 to 8,538. The proportionate decreases were smaller for individuals from a white ethnic group (down 24%) than from all other ethnic groups combined (down 32%).
Figure 2.15: Change in stop and searches by ethnicity, England and Wales, the year ending March 2022 compared with the year ending March 2021 and year ending March 2020
Source: Stop and Search open data tables, Home Office
Notes:
-
Includes searches under section 1 PACE and associated legislation, section 60 of the Criminal Justice and Public Order Act 1994, and section 47A of the Terrorism Act 2000.
-
Includes British Transport Police. Excludes Greater Manchester Police.
The above aggregate numbers do not take into account the variation in the size and geographical distribution of different ethnic groups. The following analysis considers the self-defined ethnicity of those searched relative to the population as a whole, by calculating search rates for each ethnic group. Population data is based on the 2011 Census, and so should be considered with caution given the length of time since the figures were collated and the likely changes in the size and distribution of the population in the last decade. The figures in this section will be revised once estimates of ethnic groups from the 2021 Census are available, which are expected to be published in late 2022.
Caution should be taken when interpreting search rates at the national level because, as stated above, force areas vary in their ethnic composition; an average national figure presumes that all stop and searches and ethnic groups are spread evenly across forces, whereas these differ considerably between forces. Furthermore, even within a PFA there can be significant variation in terms of the distribution of different ethnic groups, which may be masked by the force level averages. One notable example of this is the Metropolitan Police PFA[footnote 6] which is comprised of several boroughs where ethnic minorities (excluding white minorities) comprise the majority of the resident population, and others where they form a minority of the resident population. For this reason, more insightful analysis is possible at smaller geographical levels than PFA.
It is also important to be mindful of the fact that the population data are based on residential estimates and do not account for the transient population – people who move into and out of an area, but do not live there.
Furthermore, when calculating rates, individuals who have not provided their ethnicity have been excluded. In the latest year, the level of missing ethnicity data (self-defined) was 20%, a higher proportion compared with the previous year (19%). This proportion has steadily increased since the year ending March 2014, in which self-defined ethnicity was not stated for only 5% of searches. This adds further uncertainty to the trends discussed below.
Data are presented in terms of the rate that ethnic minorities (excluding white minorities) were searched compared with white people.
In the year ending March 2022, based on the traditional measure of using self-defined ethnicity and the ONS 2011 Census population estimates to calculate rates, people identifying as black or black British were searched at a rate 6.2 times higher than those from a white ethnic group across England and Wales. Between the year ending March 2011 and the year ending March 2015 the differential generally reduced (going from 7 to 4 times higher respectively). However, it started to rise from the year ending March 2016, reaching a peak in the year ending March 2018 and year ending March 2019, with the rate around 9.5 times higher for those identifying as black or black British compared with those who identify as white), before falling to 8.8 in the year ending March 2020 and then to 7.0 in the year ending March 2021.
In the latest year, people identifying as Asian or Asian British were searched at a rate 2.1 higher than those from a white ethnic group. Similarly to people of a black or black British background, this differential has widened since the year ending March 2015, when the rate was 1.3 times higher for Asian or Asian British people compared with white people. A similar pattern has also occurred for those from a mixed ethnic background or from other ethnic groups. In the latest year, people identifying as mixed were searched at a rate 2.3 higher than white people, and people from other ethnic groups 2.7 higher (Table 2.6).
Table 2.6: Comparison of the rate at which people were searched relative to individuals who self-define their ethnicity as white
| Year | Black (or Black British) | Asian (or Asian British) | Other Ethnic Group | Mixed |
|---|---|---|---|---|
| 2010/11 | 6.7 | 2.0 | 1.6 | 1.8 |
| 2011/12 | 6.1 | 1.9 | 1.5 | 1.8 |
| 2012/13 | 4.5 | 1.6 | 1.3 | 1.6 |
| 2013/14 | 4.2 | 1.4 | 1.3 | 1.5 |
| 2014/15 | 4.4 | 1.3 | 1.4 | 1.6 |
| 2015/16 | 6.5 | 1.8 | 1.8 | 2.1 |
| 2016/17 | 8.4 | 2.0 | 2.0 | 2.4 |
| 2017/18 | 9.5 | 2.3 | 2.4 | 2.8 |
| 2018/19 | 9.7 | 2.6 | 2.7 | 2.7 |
| 2019/20 | 8.8 | 2.5 | 2.9 | 2.6 |
| 2020/21 | 7.0 | 2.4 | 2.7 | 2.4 |
| 2021/22 | 6.2 | 2.1 | 2.7 | 2.3 |
Source: Stop and Search table SS_18, Home Office
Notes:
-
Includes searches under section 1 PACE and associated legislation and section 60 of the Criminal Justice and Public Order Act 1994.
-
Population breakdowns used to calculate the disparity figures are based on the 2011 census. Given the length of time since the last Census, figures in this table should be considered estimates only.
-
Greater Manchester Police are excluded as they were unable to provide complete data in 2019/20.
Officer-observed ethnicity of people searched
As shown in table 2.5, in the year ending March 2021, self-defined ethnicity was ‘not stated’ for approximately 1 in every 5 searches of people. This increases the uncertainty in the figures presented above. Table 2.7 presents the data in a different way; where the self-defined ethnicity of the person searched is not stated, officer-observed ethnicity is used instead. This reduces the proportion of stops with unknown ethnicity from 20% to 1%.
Table 2.7: Proportion of stop and searches by ethnic group, England and Wales and the MPS area, year ending March 2022
| Legislation | Police Force Area(s) | White | Black | Asian | Mixed or Other | Not stated |
|---|---|---|---|---|---|---|
| Section 1 | E&W excl. MPS | 76 | 8 | 10 | 5 | 2 |
| Section 1 | MPS | 40 | 35 | 17 | 8 | 1 |
| Section 1 | England & Wales | 61 | 19 | 12 | 6 | 1 |
| Section 60 | E&W excl. MPS | 55 | 16 | 18 | 9 | 1 |
| Section 60 | MPS | 25 | 47 | 19 | 9 | 1 |
| Section 60 | England & Wales | 43 | 28 | 19 | 9 | 1 |
| All searches | E&W excl. MPS | 76 | 8 | 10 | 5 | 2 |
| All searches | MPS | 40 | 35 | 17 | 8 | 1 |
| All searches | England & Wales | 61 | 19 | 13 | 6 | 1 |
| Population | E&W excl. MPS | 90 | 2 | 6 | 2 | 0 |
| Population | MPS | 60 | 13 | 18 | 8 | 0 |
| Population | England & Wales | 86 | 3 | 8 | 3 | 0 |
Source: Stop and Search table SS_24, Home Office
Notes:
-
Excludes vehicle only searches.
-
Includes searches under section 1 PACE and associated legislation and section 60 of the Criminal Justice and Public Order Act 1994.
-
Table uses officer-observed ethnicity in place of self-defined ethnicity for records where self-defined ethnicity is ‘not stated’.
-
Due to rounding, percentages may not sum to 100.
Looking at the data in this way increases the disparity rates for people from ethnic minorities (excluding white minorities), especially for black people. This suggests that self-defined ethnicity is more likely to be ‘not stated’ or missing when the person searched was from one of those ethnic groups. Using officer-observed ethnicity in place of self-defined ethnicity (when the latter is ‘not stated’) the disparity for ethnic minorities (excluding white minorities) in the year ending March 2022 was 3.8 (compared with 3.1 using the measure solely using self-defined ethnicity data). There was a relatively larger increase when looking at the differential for black people, who had a disparity of 8.0 using this methodology (compared with 6.2 using the measure solely using self-defined ethnicity data), and a relatively smaller increase in the differential for Asian people, who had a disparity of 2.3 using this methodology (compared with 2.1 using the measure solely using self-defined ethnicity data).
Stop and search rates by Police Force Area and ethnicity
The following analysis compares the overall rate of stop and search per 1,000 population for each ethnic group based on self-defined ethnicity (using the 2011 5+1 Census categories) against the relative rate at which people from each ethnicity are stopped and searched in comparison to white individuals, at Police Force Area level. A relative rate of 1 indicates that individuals from the minority ethnic group (excluding white minorities) are stopped at the same overall rate as white individuals. If the relative rate is less than 1, it indicates that individuals from the minority ethnic group are stopped at an overall rate less than white individuals, and if greater than 1, they are stopped at a greater overall rate. For example, a relative rate of 2 would mean that a group is stopped twice as much as the white group.
As the 2011 Census resident population estimates are over a decade old and the population is known to have changed considerably since 2011, both in size and its ethnic composition, this section should be treated as indicative only. This analysis will be updated in a future release to use the 2021 Census estimates once they are available.
When making comparisons between forces on disparity rates, the following should be borne in mind:
-
both the relatively low number of stop and searches and the relatively small size of the resident population of ethnic minorities in some force areas can produce large differences in rates per 1,000 population which are the result of a very small difference in the absolute numbers.
-
police resourcing and priorities – the level of stop and search in a police force area will be influenced by operational priorities and decisions.
-
transient populations – the Race Disparity Unit highlighted the impact of population changes on stop and search rates, the stop and search rates are based on resident population estimates at a specific time and do not take into account individuals temporarily visiting an area, for example tourists and students.
-
variations within Police Force Areas – as section 2.11 shows, some force areas with have many smaller areas (LSOAs) that have little to no stop and search activity, with a small proportion of areas accounting for the majority of stop and search.
Black ethnic group
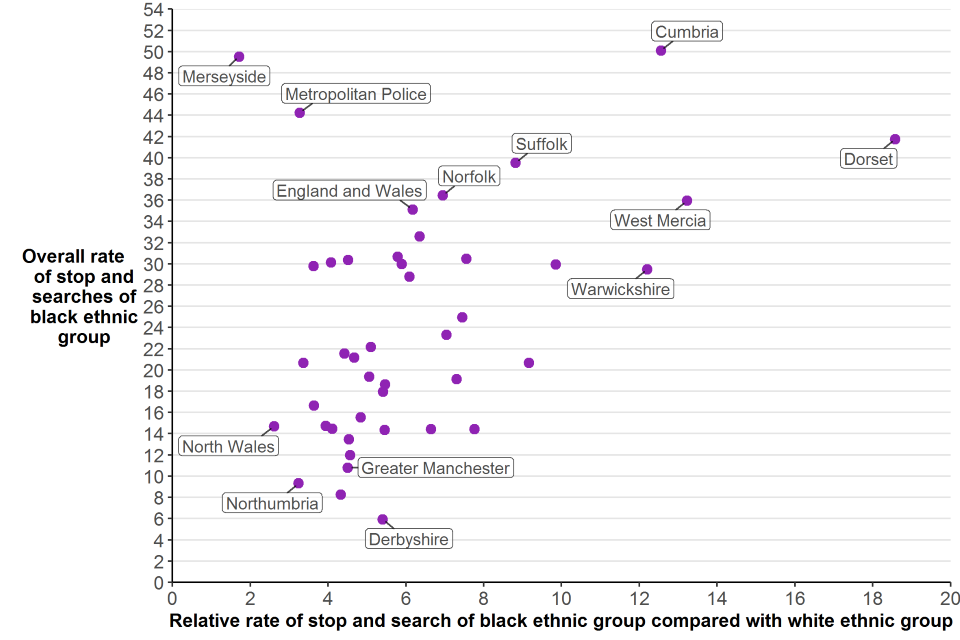
Figure 2.16: Overall stop and search rates and relative rates for black individuals, by Police Force Area, England and Wales, year ending March 2022
Source: Stop and Search table SS_16, Home Office
Notes:
-
City of London and British Transport Police are not shown, but they have been included in the England and Wales total.
-
Rates of stop and search are calculated using Census 2011 Estimates. These are likely to be outdated so should be treated as indicative only.
In England and Wales there were 35 stop and searches of individuals from a black background per 1,000 population in the year ending March 2022. This is the highest overall rate compared with all other ethnic groups and 6.2 times higher compared with the white group, who were stopped and searched at an overall rate of 6 per 1,000 population. Cumbria and Merseyside had the highest overall rates at 50 stop and searches per 1,000 population, followed by Metropolitan Police Service (MPS) with an overall rate of 44 stop and searches per 1,000 population. Despite Cumbria having one of the highest overall rates of stop and search it is based on a very small number of searches (29 searches) compared to Merseyside and MPS (721 and 48,158 respectively). The lowest overall rate of stop and search of individuals from a black background was by Derbyshire, at an overall rate of 6 stop and searches per 1,000 population. Derbyshire also had a low number of stop and searches (60 searches).
Although Merseyside and the MPS showed two of the highest overall rates for individuals from a black background, they were among the forces with the lowest relative rates, along with North Wales and Northumbria (1.7, 3.3, 2.6, and 3.2 respectively). When considering the relative rates, it is important to note the variation between forces in the number of stop and searches on individuals from a black background. For example, North Wales and MPS had similar relative rates but carried out very different numbers of searches of people from a black ethnic background (22 and 48,158 searches respectively).
Dorset and West Mercia had the highest relative rates of all police forces, with individuals from a black background being stopped 18.6 and 13.2 times more than white individuals respectively. Although these forces have high relative rates, it should be noted that, as indicated by the Table A1, these forces had relatively low numbers of stop and searches of individuals from a black background (134 and 182 searches respectively). Conversely, although Greater Manchester Police (GMP) carried out relatively high numbers of searches against individuals from a black background (801 searches), the overall search rate and relative rate in this force area was relatively low compared with other forces (11 and 4.5 respectively). This may be in part explained by GMP’s residential population which has a larger proportion of residents from minority ethnic backgrounds (excluding white minorities) compared with other forces.
Asian ethnic group
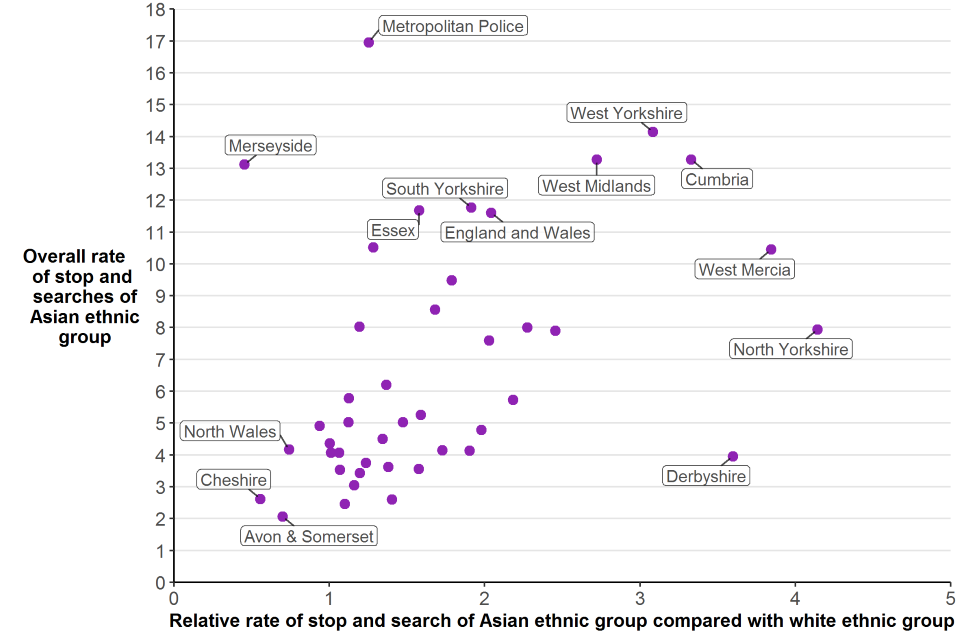
Figure 2.17: Overall stop and search rates and relative rates for Asian individuals, by Police Force Area, England and Wales, year ending March 2022
Source: Stop and Search table SS_16, Home Office
Notes:
-
City of London and British Transport Police are not shown, but they have been included in the England and Wales total.
-
Rates of stop and search are calculated using Census 2011 Estimates. These are likely to be outdated so should be treated as indicative only.
In England and Wales there were 12 stop and searches of individuals from an Asian background per 1,000 population in the year ending March 2022. The MPS had the highest overall rate of stop and search of individuals from an Asian background at 17 stop and searches per 1,000 population, followed by West Yorkshire (14 per 1,000 population). Both forces also carried out a relatively high number of stop and searches of Asian individuals (25,624 and 4,126 searches respectively). The lowest overall rate of stop and search of individuals from an Asian background was by Avon and Somerset (2 per 1,000 population).
In England and Wales individuals from an Asian background were stopped at a relative rate 2.0 times higher than white individuals. This relative rate varied between forces. North Yorkshire had the highest relative rate of 4.1. Merseyside showed a relative rate of less than 1 (0.5), suggesting that Asian individuals were stopped at a rate lower than white individuals.
The majority of forces showed a relatively low number of stop and searches against individuals from an Asian background, including some forces which showed as having high relative rates, for example North Yorkshire, Cumbria, West Mercia, and Derbyshire (112, 54, 264, and 158 respectively). The high relative rates and low volumes of searches in these areas may be partially explained by the ethnic composition of these areas, see Table A2.
Mixed ethnic group
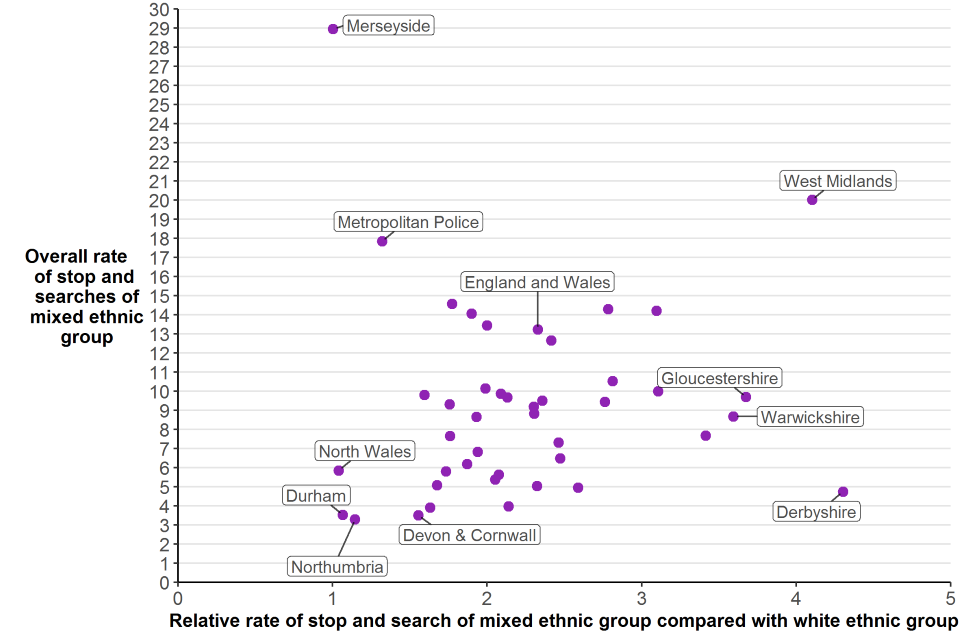
Figure 2.18: Overall stop and search rates and relative rates for individuals from a mixed ethnic background, by Police Force Area, England and Wales, year ending March 2022
Source: Stop and Search table SS_16, Home Office
Notes:
-
City of London and British Transport Police are not shown, but they have been included in the England and Wales total.
-
Rates of stop and search are calculated using Census 2011 Estimates. These are likely to be outdated so should be treated as indicative only.
There were 13 stop and searches of individuals from a mixed ethnic background per 1,000 population in England and Wales in the year ending March 2022. Merseyside displayed the highest overall rate of stop and search at 29 stop and searches per 1,000 population, followed by West Midlands with an overall rate of 20 stop and searches per 1,000 population. Both of these police forces also had some of the highest number of stop and searches of individuals from a mixed ethnic background (607 and 1,926 searches). Northumbria had the lowest overall rate of stop and search of individuals from a mixed ethnic background, at an overall rate of 3 stop and searches per 1,000 population, followed by Devon and Cornwall (4 stop and searches per 1,000 population).
In England and Wales individuals from a mixed ethnic background were stopped at a relative rate 2.3 times higher than white individuals, the lowest relative rate compared with all other ethnic groups. This relative rate varied between forces. Derbyshire had the highest relative rate of 4.3 whilst Merseyside and North Wales had the lowest relative rate; at 1.0 times higher than white individuals. This suggests Merseyside and North Wales have an equally high search rate per 1,000 population of white individuals. However, despite similar relative rates, Merseyside carried out a higher number of stop and searches than North Wales (607 and 29 searches respectively).
West Midlands had the second highest relative rate and the second highest overall search rate and had relatively high search numbers (1,926 searches).
Other ethnic groups
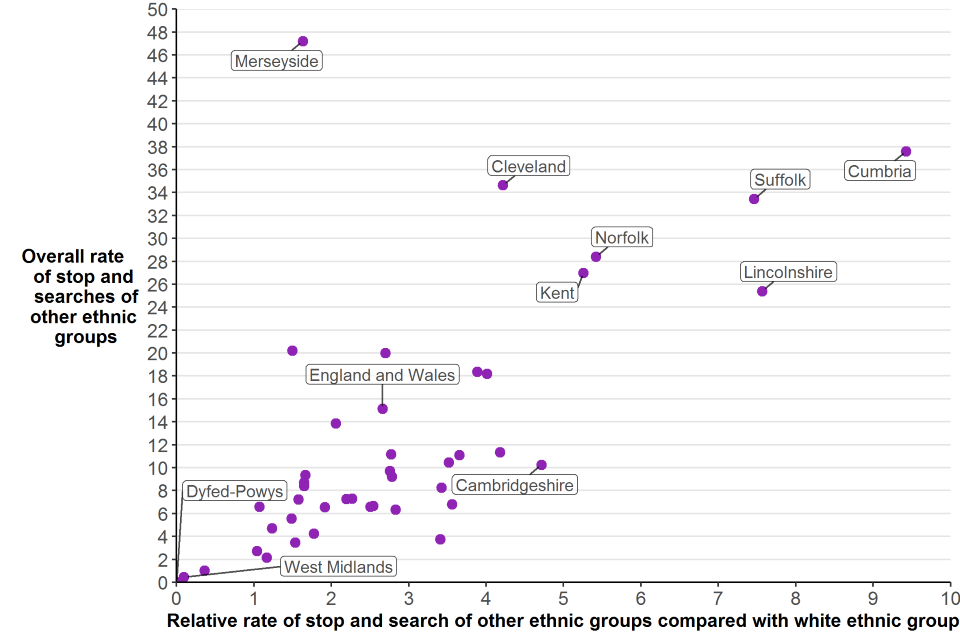
Figure 2.19: Overall stop and search rates and relative rates for individuals from other ethnic groups, by Police Force Area, England and Wales, year ending March 2022
Source: Stop and Search table SS_16, Home Office
Notes:
-
City of London and British Transport Police are not shown, but they have been included in the England and Wales total.
-
Dyfed-Powys did not conduct any stop and searches on individuals from other ethnic groups in the year ending March 2022.
-
Rates of stop and search are calculated using Census 2011 Estimates. These are likely to be outdated so should be treated as indicative only.
In England and Wales there were 15 stop and searches of individuals from other ethnic groups per 1,000 population in the year ending March 2022. This varied between police forces. Merseyside had the highest overall rate of stop and search at 47 stop and searches per 1,000 population, followed by Cumbria with an overall rate of 38 stop and searches per 1,000 population; these forces were at opposite ends of the scale however, in terms of the number of searches of individuals from this ethnic group (471 in Merseyside and 17 searches in Cumbria). Excluding Dyfed-Powys who carried out no stop and searches of individuals from other ethnic groups, West Midlands had the lowest overall rate of stop and searches at 0.5 per 1,000 population, followed by Northumbria (1 stop and searches per 1,000 population). Both forces carried out a low number of stop and searches on individuals from other ethnic groups (19 and 8 searches respectively).
In England and Wales individuals from other ethnic groups were stopped at a relative rate 2.7 times higher than white individuals. Cumbria had the highest relative rate, with individuals from other ethnic groups being stopped at a relative rate 9.4 times higher than white individuals. This however is based on a small number (17 searches). The force with the lowest relative rate was West Midlands, individuals from other ethnic groups were stopped at a relative rate less than 1 (0.1). Again, this is based on a small number of searches (19 searches) and suggests that individuals from other ethnic groups are stopped at a lower rate than white individuals.
Disparity rates by reason for search
The following analysis uses a combination of self-defined ethnicity and officer-observed ethnicity.
There is some variation in the disparity rates depending on the reason why searches were conducted. For offensive weapon searches and searches under section 60 of the Criminal Justice and Public Order Act, black people were searched at a rate 12.6 and 17.1 times higher than white people (compared with a disparity of 8.0 for all stop and searches). However, searches of black people for articles to commit criminal damage had a rate 2.1 times higher than white people (Table 2.8)
Table 2.8: Stop and search disparity, compared with the white ethnic group, by reason for search, year ending March 2022
| Reason for search | Black (or Black British) | Asian (or Asian British) | Other Ethnic Group or Mixed |
|---|---|---|---|
| Stolen property | 7.5 | 1.4 | 3.0 |
| Drugs | 7.7 | 2.7 | 2.7 |
| Firearms | 8.8 | 3.3 | 3.1 |
| Offensive weapons | 12.6 | 2.2 | 3.2 |
| Going equipped | 3.3 | 1.1 | 1.8 |
| Criminal damage | 2.1 | 0.6 | 1.3 |
| Other | 5.7 | 2.0 | 2.7 |
| s.60 CJPOA | 17.1 | 5.0 | 5.6 |
| All stop and search | 8.0 | 2.3 | 2.7 |
Source: Stop and Search table SS_20, Home Office
Notes:
- Figures in the table show the disparity between the ethnic group shown and the white ethnic group.
2.9 Age and sex of persons stopped and searched
Introduction
Since the year ending March 2021, police forces have supplied data on the age and sex of people stopped and searched. During a stop and search, the person stopped may provide their date of birth, or an officer may estimate the person’s age where this information is refused or not provided.
In this report, we refer to sex rather than gender of people stopped and searched. ‘Sex’ can be considered to refer to whether someone is male or female based on their physiology, with ‘gender’ representing a social construct or sense of self that takes a wider range of forms.
The data collection gives four options for the sex of the person searched: female, male, other and unknown. ‘Other’ may comprise people who define themselves as non-binary or transgender. However, only 20 of the 44 police forces recorded any stop and searches of people defined as ‘other’ sex. This suggests that different recording systems used by police forces have different levels of detail to which the sex of the person searched can be recorded. Additionally, it is likely that recording includes a mixture of physiological and personal identity. We are reporting the data in the format they are collected, and are working to bring these data in line with Government Statistical Service sex and gender harmonisation standards.
Age of persons searched
About two-thirds (66%) of all stop and searches of persons in the year ending March 2022 were on people aged between 10 and 29 years old (330,967 out of 498,290 searches where the age of the person searched was provided). Of these, 94,905 were aged between 10 and 17 (19% of the total), and 166,217 were 18-24 (33% of the total) and 69,845 were 25-29 (14% of the total). These proportions are similar to the year ending March 2021 (Table 2.9)
Table 2.9: Proportion of stop and searches by age group, England and Wales, year ending March 2021 and year ending March 2022
| Age group | Proportion in year ending March 2021 | Proportion in year ending March 2022 |
|---|---|---|
| 10-17 | 17.0 | 19.0 |
| 18-24 | 37.3 | 33.3 |
| 25-29 | 14.7 | 14.0 |
| 30 or over | 31.0 | 33.6 |
Source: Stop and Search table SS_31, Home Office
Notes:
-
Due to low volume, searches of under 10s are excluded. There were 42 searches of under 10s recorded in the year ending March 2021 and 70 in the year ending March 2022.
-
Due to rounding, percentages may not sum to 100.
There were some differences in the age of people searched depending on the reason for search. For example, people aged between 10 and 17 accounted for 54% of criminal damage searches, but only 13% of drug searches. In contrast, people aged 30 or over accounted for 43% of searches for stolen property and 41% searches for going equipped, but only 17% of searches under section 60 CJPOA (Figure 2.20).
Figure 2.20: Proportion of stop and search by age of person searched and reason for search, year ending March 2022
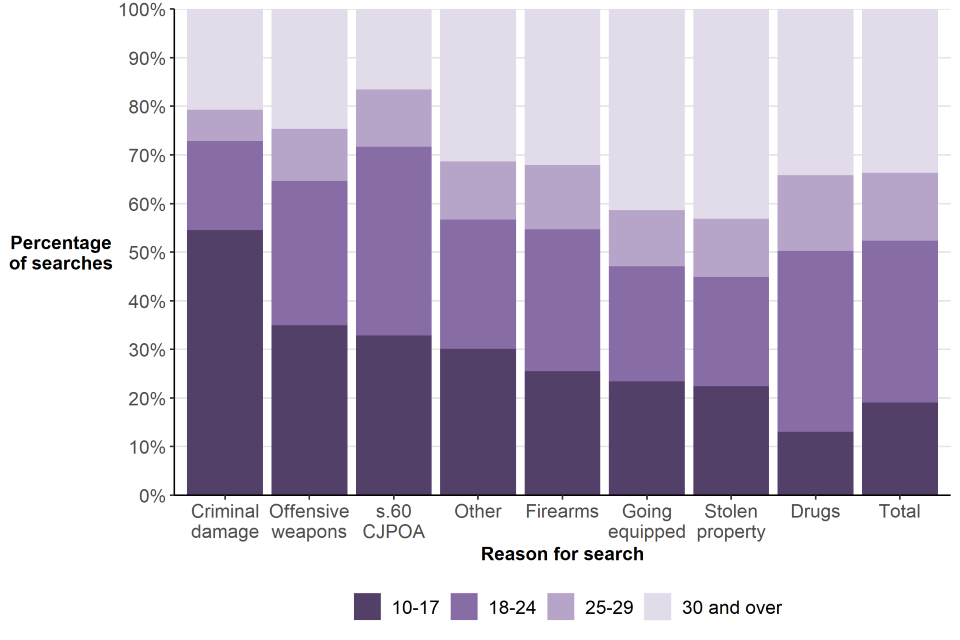
Source: Stop and Search table SS_32, Home Office
Notes:
- Excludes vehicle only searches, searches where the age of the person searched was not known and searches with a recorded age of under 10 years old (70 searches out of 498,920 searches where the age of the person searched was provided).
Sex of persons searched
Excluding vehicle only searches and searches where the sex of the person searched is not known, 89.8% of searches were of males and 10.2% of females. There were a small number of searches of people of ‘Other’ sex (192 out of 512,996 searches of people where the sex was recorded).
There was little variation in the sex of person searched by the reason for search (Figure 2.21) except that females comprised 16% of those searches for stolen property and only 6% of searches under section 60 CJPOA.
Figure 2.21: Proportion of stop and search by sex of person searched and reason for search, year ending March 2022
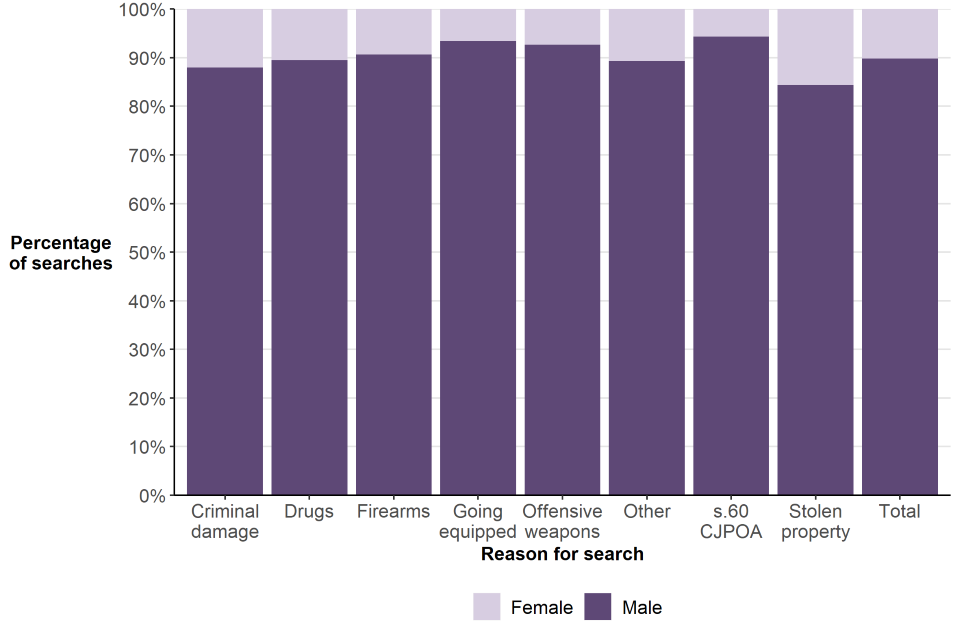
Source: Stop and Search table SS_29, Home Office
Notes:
- Excludes vehicle only searches, and searches where the sex of the person searched was ‘Other’ or not known.
There was also a small difference in the arrest rate between males and females. 13% of searches of males resulted in arrest, slightly higher than the arrest rate for females (10%).
Ethnicity, sex and age of persons searched
This section takes a more in-depth look at the sex, age and ethnicity of persons searched, and how the profile of people stopped and searched compares with the population of England and Wales. Stop and search figures in this section include only those with a known age and sex of the person searched. These figures are the number of stop and search incidents, rather than number of unique individuals stopped and searched i.e. multiple searches on the same people are counted as separate incidents. Therefore, the rates in this section do not strictly refer to the proportion of the population (or sub-populations) that experienced stop and search in the latest year. Population rates quoted are based on Office for National Statistics (ONS) 2019 population estimates by broad ethnic group, which were produced specifically for use as part of the Race Disparity Audit. The population figures are not National Statistics and have not been produced using methods that have undergone formal quality assurance. Therefore, the figures in this section relating to proportion of the population and rates of stop and search should be interpreted with caution.
Figure 2.22 shows the age and sex of persons searched compared with the population of England and Wales. This shows that stop and search is largely targeted at young men. For example, 66% of stop and searches in the year ending March 2022 were on males aged between 15 and 34, whilst this cohort comprises 13% of the overall population. Males aged 15-19 had the highest rate of stop and search, at 70 stop and searches per 1,000 population in the year ending March 2022.
In contrast, females aged between 15 and 34 accounted for 7% of stop and search, despite accounting for 12% of the overall population. Searches of females aged 15-19 were roughly in proportion to their population (2.4% of searches compared with 2.7% of the population), however, at every age group, the proportion of females searched is lower than their proportion of the population. For males, only those aged under 10 or over 49 account for a lower proportion of stop and search than their proportion of the population.
There are disparities in the age of people searched, for both males and females. Males aged 15-19 were searched at a rate 7.7 times higher than those aged 45-49, and females aged 15-19 were searched at a rate 5.5 times higher than those aged 45-49.
Figure 2.22: Proportion of stop and search by age and sex of person compared with the population, year ending March 2022, England and Wales
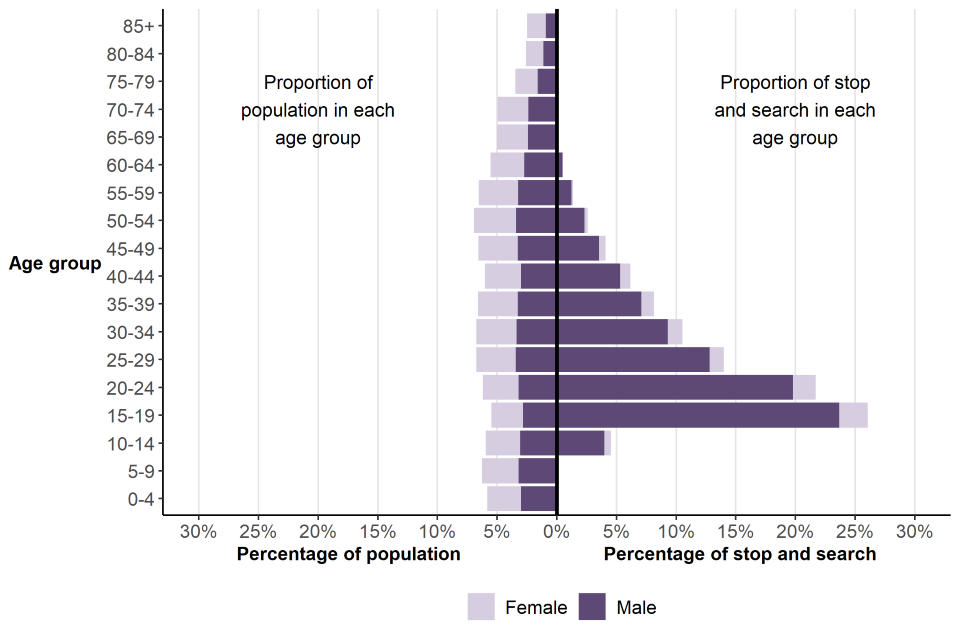
Source: Stop and Search table SS_34, Home Office
Notes:
- Excludes vehicle only searches, searches where the sex of the person searched was ‘Other’ or not known and searches where the age of the person searched was not known.
Figures 2.23 and 2.24 show the age and sex of people stopped and searched in the year ending March 2022, split by whether the ethnicity of the person searched was white (including white minorities) or another ethnic group, and how that compares with the population of England and Wales within those ethnic groups. Where the self-defined ethnicity of the person searched is not stated, the officer-observed ethnicity is used instead. Searches where both the self-defined ethnicity and officer-observed ethnicity are unknown are excluded from the stop and search proportions. People from ethnic minorities (excluding white minorities) are grouped together in this analysis due to sample size when splitting stop and search and population data by age and sex.
Figure 2.23: Proportion of stop and search conducted on white people, by age and sex of person, compared with the population, year ending March 2022, England and Wales
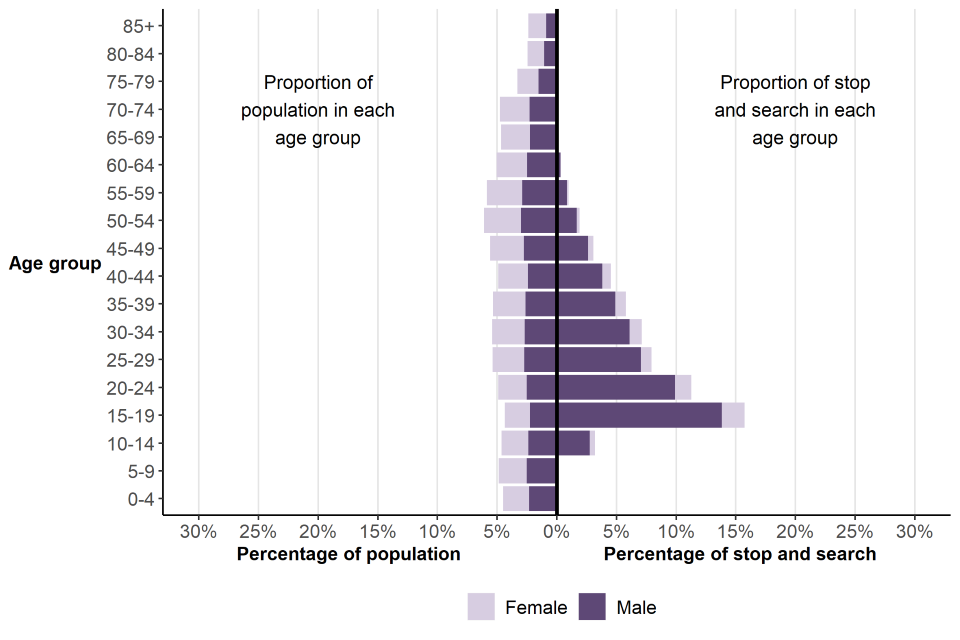
Source: Stop and Search table SS_35, Home Office
Notes:
- Excludes vehicle only searches, searches where the sex of the person searched was ‘Other’ or not known and searches where the age of the person searched was not known.
Figure 2.24: Proportion of stop and search conducted on people from ethnic minorities (excluding white minorities), by age and sex of person compared with the population, year ending March 2022, England and Wales
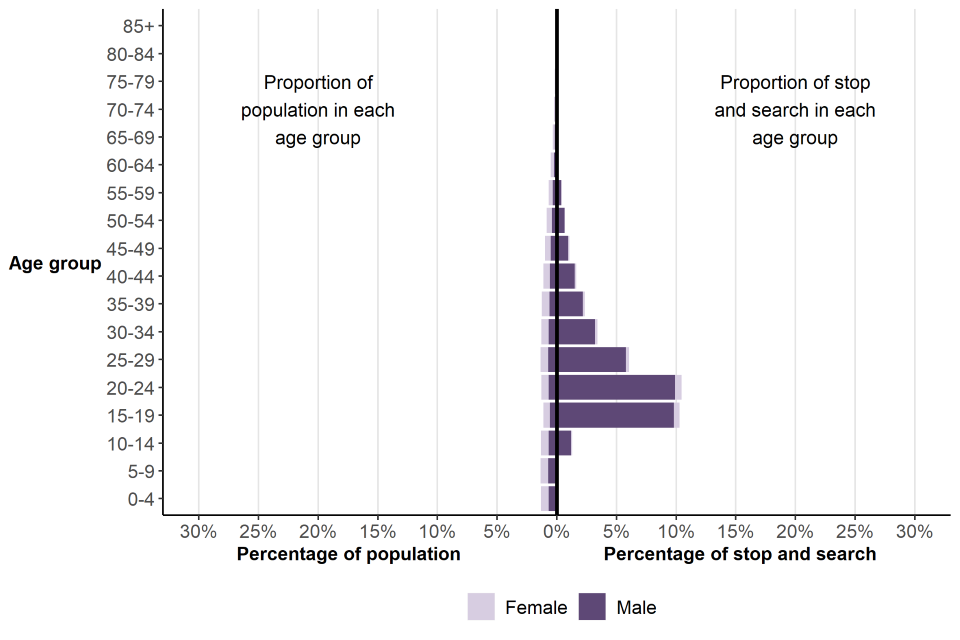
Source: Stop and Search table SS_36, Home Office
Notes:
- Excludes vehicle only searches, searches where the sex of the person searched was ‘Other’ or not known and searches where the age of the person searched was not known.
Males aged 15-34 from ethnic minorities (excluding white minorities) account for 29% of stop and search in the year ending March 2022, despite only comprising 2.6% of the population. The highest rate of stop and search was for males aged 15-19 from ethnic minorities (excluding white minorities), who were searched at a rate of 140 per 1,000 people, a rate 2.7 times higher than white people of the same age group. For males from a black, Asian or other minority ethnic (excluding white minorities) group, only those aged under 10, or over 60, account for a lower proportion of stop and search than their proportion of the population. However, for females from ethnic minorities (excluding white minorities), all age groups accounted for a lower proportion of total stop and search than their proportion of the population.
2.10 When does stop and search take place?
This section examines the day of the week and time of day that different reasons for stop and search take place.
In the year ending March 2022, Fridays had the highest number of stop and searches (85,978) and Sundays the lowest (65,169). Generally, the number of searches each day increases from the start to the end of the week. The trend is most distinct for searches under section 60 of the Criminal Justice and Public Order Act, with 44% of searches under that power taking place either on Fridays or Saturdays (compared with 32% of searches taking place on those two days for stop and search across all legislation).
Figure 2.25: Number of searches on each day of the week, year ending March 2022, England and Wales
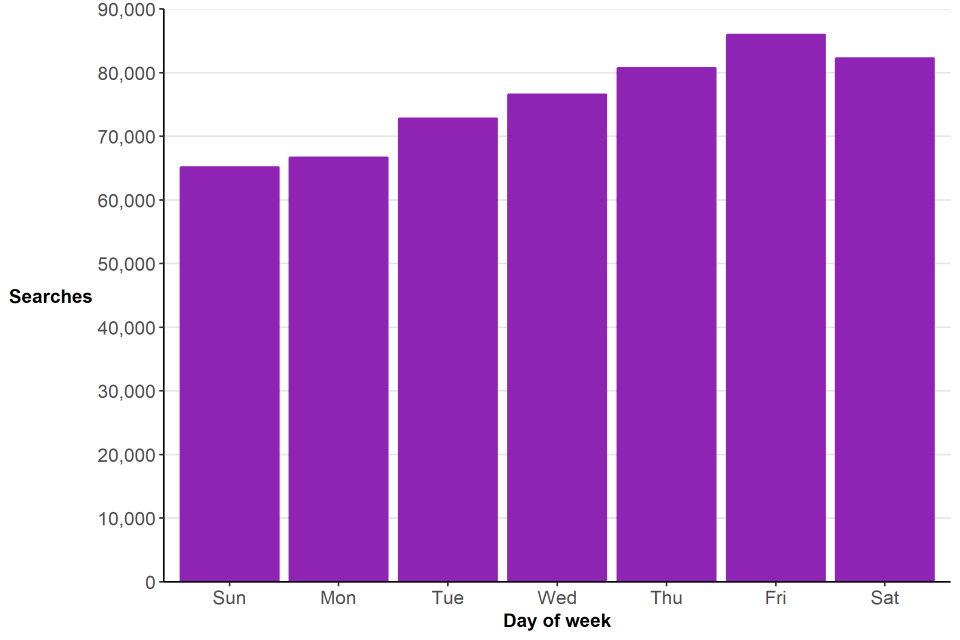
Source: Stop and Search table SS_38, Home Office
In the year ending March 2022, the most common time for a stop and search to take place was between 4pm and 5pm (39,765 searches), closely followed by between 5pm and 6pm (39,621 searches). The lowest number of searches took place between 7am and 8am (2,674). These numbers likely reflect the number of officers and number of people on the streets at different times of day, for example after school.
Figure 2.26: Number of stop and searches during each hour of the day, year ending March 2022, England and Wales
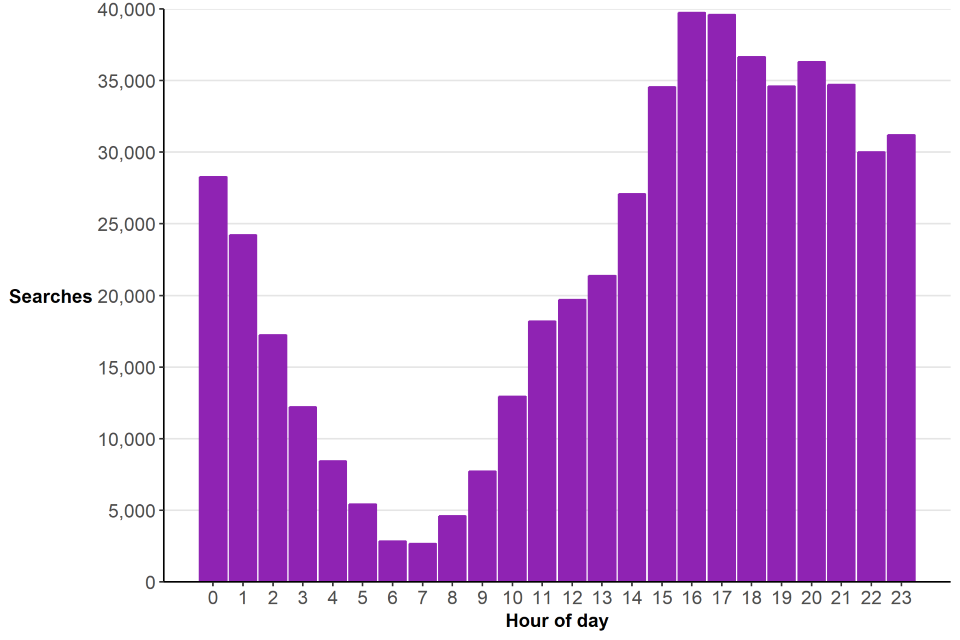
Source: Stop and Search table SS_39, Home Office
Notes:
-
Hour of day 0 extends from 00:00 to 00:59, hour of day 1 extends from 01:00 to 01:59 etc.
-
It is not always possible to distinguish between searches that took place at 00:00 or have an unknown time of search. For that reason, the number of searches where the hour of day is 0 may be a slight overcount.
There are some differences in the peak times of day that searches take place, based on the reason for search. For example, searches for going equipped for stealing peak between 1am and 2am. Searches for articles used to commit criminal damage and searches under section 60 of the Criminal Justice and Public Order Act peak between 8pm and 9pm.
2.11 Stop and search hotspots
The Home Office stop and search data collection has expanded to include more detailed information on the locations that stop and search take place (six digit x and y coordinates), meaning that hotspots (areas of high stop and search activity hotspots within a Police Force Area) can be identified. This Annex contains information on stop and search hotspots conducted by the Metropolitan Police Service (MPS) in London, as well as Greater Manchester Police, West Midlands Police, Lincolnshire Police and Dorset Police. These areas have been selected as they provided good quality x and y co-ordinate data and allow comparisons to be made between areas with large urban centres with more rural areas.
Metropolitan Police Service
Analysis of stop and search conducted by the MPS in the year ending March 2022 at Lower Super Output Area (LSOA) level shows that there are certain small areas of London, such as parts of Westminster, Croydon and Newham with high levels of stop and search activity, and large areas (predominantly, but not limited to, the outskirts of the Police Force Area) with comparatively low levels. Approximately 25% of stop and search within London takes place in just 2.4% of LSOAs within London, and 50% of stop and searches taken place in just 10.2% of LSOAs. Many of the areas highlighted in Figure 2.27 with very high levels of stop and search are those where there is a significantly greater visiting population than the resident population of the area. For example, Newham 013G contains Stratford tube station and Westfield shopping centre. Likewise, West Croydon train and bus stations are in the vicinity of Croydon 020B. Lastly, several areas of Westminster have very high levels of stop and search, reflecting the fact that people may gather in that area for tourism, or protests.
Figure 2.27: Map of stop and search activity at LSOA level within London, year ending March 2022
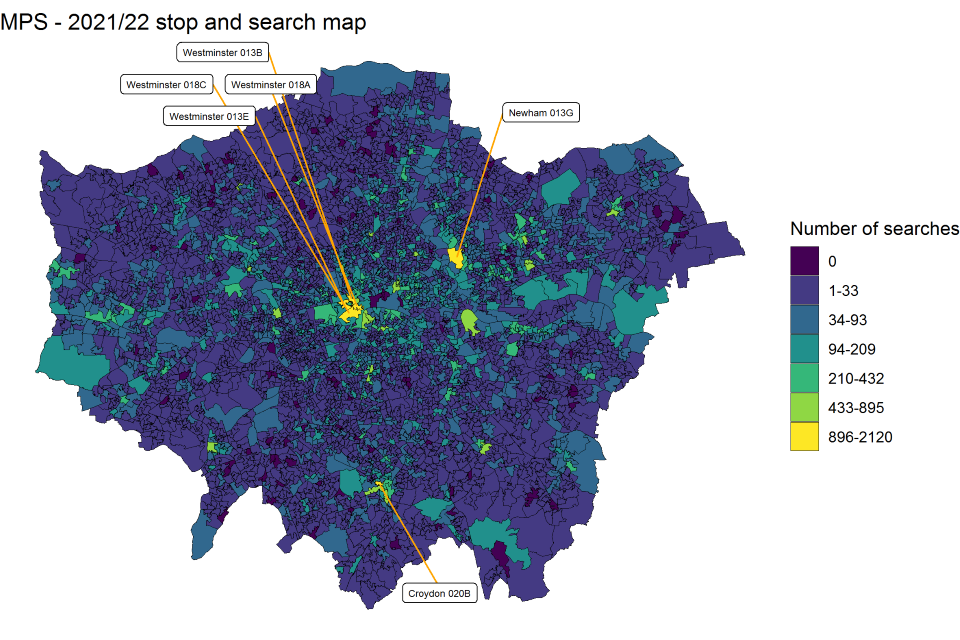
Source: Stop and Search data collection, Home Office
Notes:
-
Includes searches carried out within the City of London by Metropolitan Police officers. Excludes searches undertaken outside London.
-
Approximately 89% of stop and search records submitted to the Home Office by the Metropolitan Police in the year ending March 2022 had a valid LSOA.
Greater Manchester Police
Similarly to MPS, the majority of the outskirts of the Greater Manchester Police Force Area have very low to no stop and search activity taking place, with the hotspots being in distinct parts of the urban centres. Approximately 25% of stop and search within Greater Manchester takes place in just 0.8% of LSOAs within Greater Manchester, and 50% take place within 6.8%. In Greater Manchester, two of the main hotspot areas and Manchester 054C and Manchester 055B, which have high levels of transient population moving through them as they contain Arndale shopping centre and Manchester Victoria train station.
Figure 2.28: Map of stop and search activity at LSOA level within Greater Manchester Police Force Area, year ending March 2022
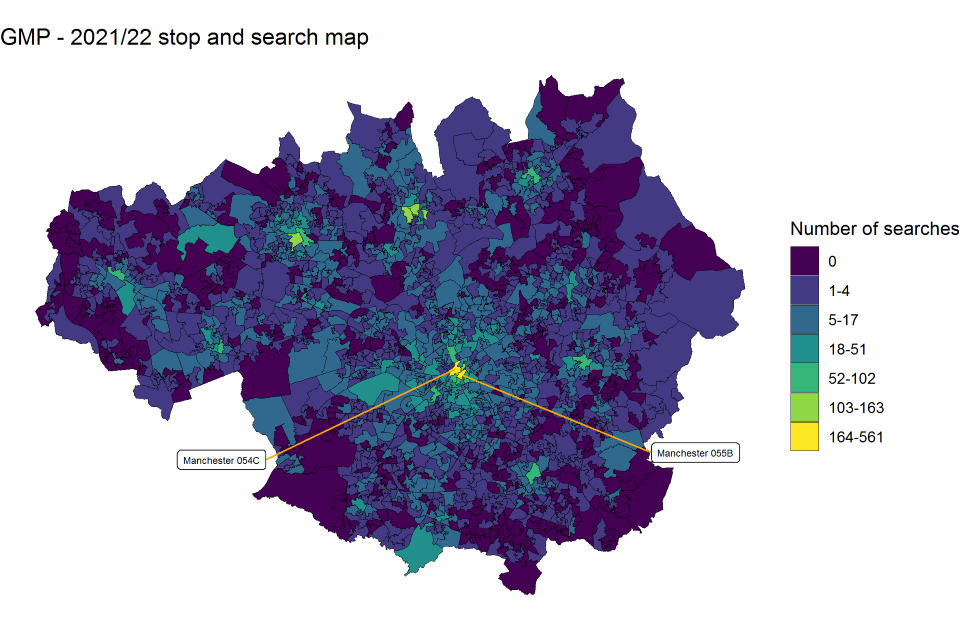
Source: Stop and Search data collection, Home Office
Notes:
-
Excludes searches undertaken outside Greater Manchester Police PFA.
-
Approximately 96% of stop and search records submitted to the Home Office by the Greater Manchester Police in the year ending March 2022 had a valid LSOA.
West Midlands Police
Similarly to MPS and GMP, the majority of the outskirts of the Greater Manchester Police Force Area have very low to no stop and search activity taking place, with the hotspots being in distinct parts of the urban centres, including Birmingham, Coventry and Walsall. Approximately 25% of stop and search within West Midlands takes place in just 1.0% of LSOAs within West Midlands, and 50% take place within 6.8%. In West Midlands, the main hotspot area is in central Birmingham, in proximity to the Bullring shopping centre and Birmingham New Street station.
Figure 2.29: Map of stop and search activity at LSOA level within West Midlands Police Force Area, year ending March 2022
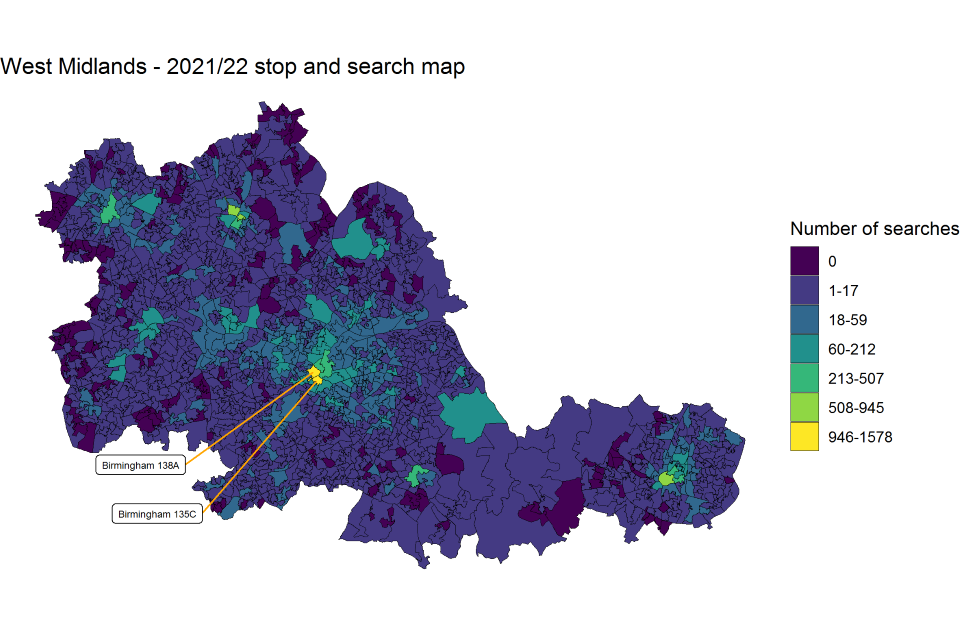
Source: Stop and Search data collection, Home Office
Notes:
-
Excludes searches undertaken outside West Midlands PFA.
-
Approximately 100% of stop and search records submitted to the Home Office by the West Midlands in the year ending March 2022 had a valid LSOA.
Lincolnshire Police
Although Lincolnshire does not contain any urban centres as large as London or Greater Manchester, there are similarities in the way that stop and search activity is distributed throughout Lincolnshire PFA. Approximately 25% of searches take place in just 1.9% of LSOAs across the PFA, and 50% take place in 7.6% of LSOAs. In Lincolnshire, two of the main hotspot areas are Lincoln 006B and Boston 003A. Lincoln 006B contains part of Lincoln High Street, as well as Lincoln train station, again places with higher levels of transient footfall. Likewise, Boston 003A contains Boston train station and West Street, which is a major shopping street in the area (Figure 2.30)
Figure 2.30: Map of stop and search activity at LSOA level within Lincolnshire Force Area, year ending March 2022
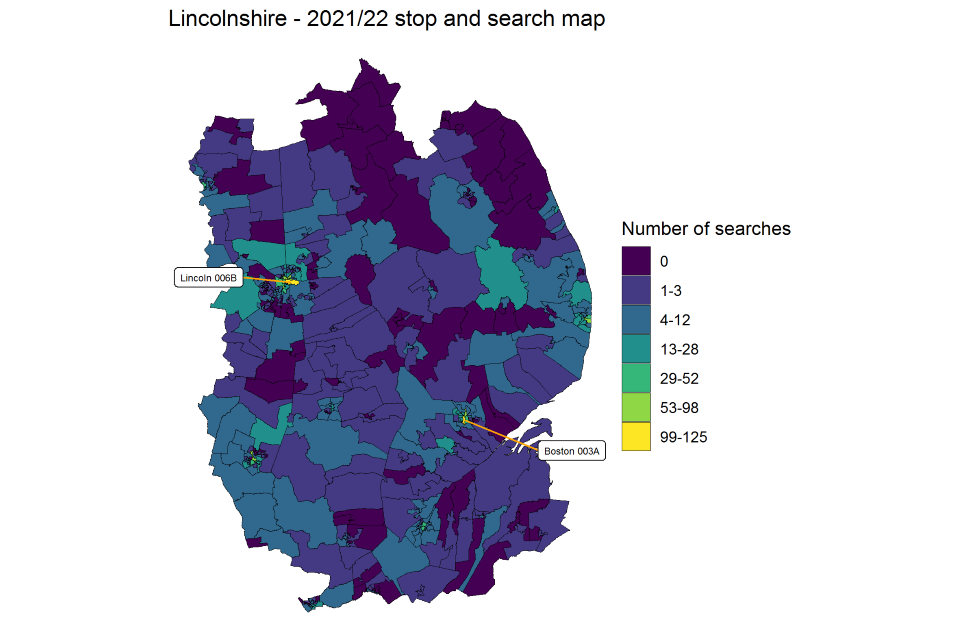
Source: Stop and Search data collection, Home Office
Notes:
-
Excludes searches undertaken outside Lincolnshire PFA.
-
Approximately 98% of stop and search records submitted to the Home Office by the Lincolnshire Police in the year ending March 2022 had a valid LSOA.
Dorset Police
Although Dorset is, again, a significantly different area to the four presented already in this section, the pattern of stop and search distribution is similar. 25% of stop and searches take place in just 1.5% of LSOAs, and 50% of stop and searches take place in just 7.5% of LSOAs. In Dorset PFA, large parts of the west and northern half of the area have no stop and search activity at all. Two of the main hotspots are neighbouring LSOAs in Bournemouth (Bournemouth 017A and Bournemouth 021A), which contain several nightclubs (Figure 2.31).
Figure 2.31: Map of stop and search activity at LSOA level within Dorset Police Force Area, year ending March 2022
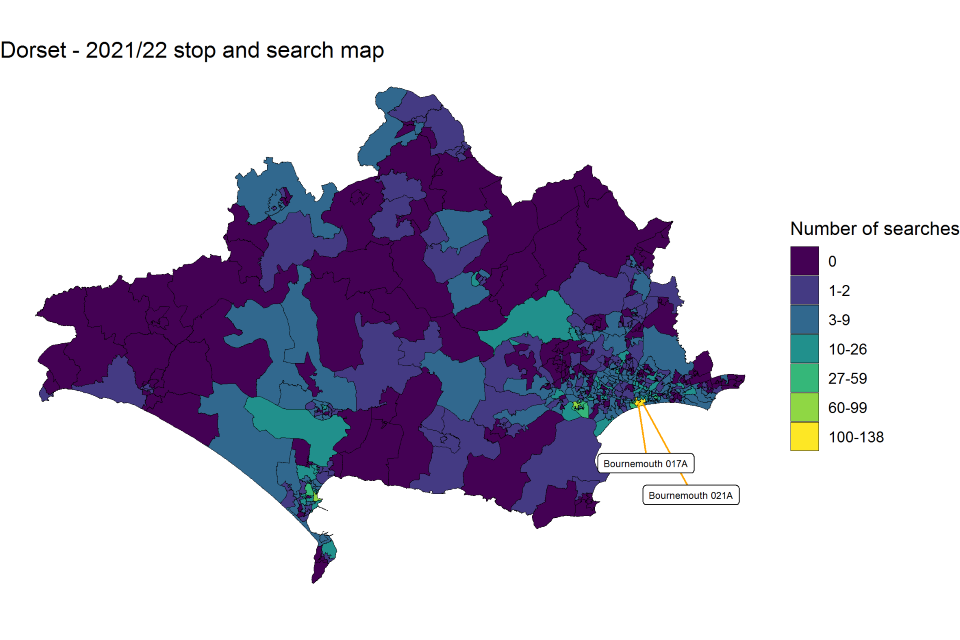
Source: Stop and Search data collection, Home Office
Notes:
-
Excludes searches undertaken outside Dorset PFA.
-
Approximately 95% of stop and search records submitted to the Home Office by the Dorset Police in the year ending March 2022 had a valid LSOA.
Table 2.10 shows the percentage of LSOAs within a PFA that 25%, 50% and 75% of searches take place in. This shows a consistent pattern between areas, where about half of stop and search takes place in 7-10% of LSOAs.
Table 2.10 Percentage of stop and search that takes place in 25%, 50% and 75% of LSOAs within selected PFAs
| % of LSOAs | |||||
|---|---|---|---|---|---|
| Percentage of search total | Metropolitan Police | Greater Manchester Police | West Midlands | Lincolnshire | Dorset |
| 25% | 2.4% | 0.8% | 1.0% | 1.9% | 1.5% |
| 50% | 10.2% | 6.8% | 6.8% | 7.6% | 7.5% |
| 75% | 27.7% | 22.2% | 22.4% | 22.6% | 21.5% |
2.11.1 Relationship between stop and search and deprivation
This section examines the relationship between the level of deprivation and number of stop and searches in England. The first section looks at several police forces individually, including the Metropolitan Police Force Area, Kent, Durham, West Midlands and Surrey. The latter section looks at several areas of England combined. These areas were selected as they provided good quality x and y co-ordinate data, and they provide a contrast between different areas of England.
The deprivation data used in the analysis comes from the English indices of deprivation 2019. The main measure used in this analysis is the Index of Multiple Deprivation (IMD), which is an overall relative measure of deprivation constructed by combining seven domains of deprivation according to their respective weights:
- income deprivation (22.5%)
- employment deprivation (22.5%)
- education, skills and training deprivation (13.5%)
- health deprivation and disability (13.5%)
- crime (9.3%)
- barriers to housing and services (9.3%)
- living environment deprivation (9.3%)
The IMD includes decile rankings such that England can be split into 10 categories based on the level of deprivation, whereby each category contains an equal number of Lower Super Output Areas (e.g. category 1 contains the 10% of LSOAs with the highest level of deprivation, and category 10 contains the 10% of LSOAs with the lowest level of deprivation). As the analysis in this section focuses solely on individual police forces, the deprivation LSOA rankings from the IMD have been adjusted so that the rankings reflect the relative measure of deprivation within each individual PFA, rather than England overall.
Although there is a separate Welsh Index of Multiple Deprivation, it was beyond the scope of analysis currently to attempt to combine this with the English IMD.
The analysis only includes searches where a valid easting and northing was provided, and the stop and search was determined to have taken place within the respective Police Force Area’s boundary.
Metropolitan Police Force Area
Figure 2.32 shows the volume of stop and search that took place in the year ending March 2022 at each relative deprivation decile within the Metropolitan Police Force Area. This shows a linear relationship between the level of deprivation and the level of stop and search in the MPS, that is, as, stop and search tends to increase as deprivation increases. For example, the 10% of LSOAs with the highest level of deprivation account for 16.3% of stop and searches, whereas the 10% of LSOAs with the lowest level of deprivation account for only 2.7% of stop and searches.
Figure 2.32: Number of stops and searches that took place within the Metropolitan Police Force Area in the year ending March 2022, grouped by the level of deprivation, where 1 contains the 10% of LSOAs with the highest level of deprivation, and 10 the 10% of LSOAs with the lowest level of deprivation
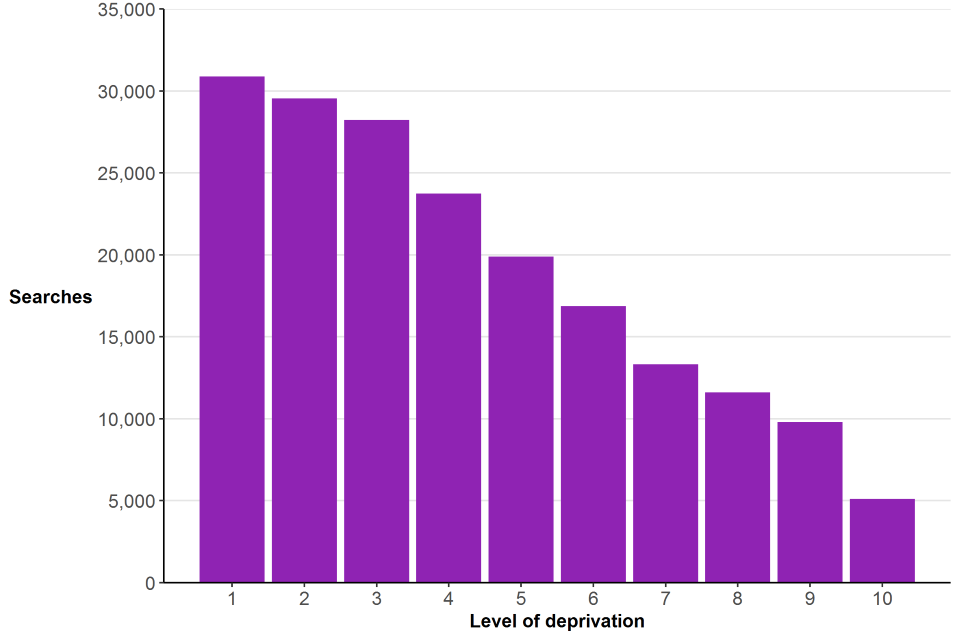
Source: Stop and Search data collection, Home Office and Indices of Multiple Deprivation, Department for Levelling Up, Housing and Communities
Notes:
- Horizontal axis values represent relative level of deprivation, where 1 is high deprivation and 10 is low deprivation.
- Each deprivation level contains approximately 483 LSOAs.
West Midlands Police Force Area
Figure 2.33 shows the volume of stop and search that took place in the year ending March 2022 at each relative deprivation decile within the West Midlands Police Force Area. This shows that there is a general decrease in the level of stop and search as deprivation decreases, but it as not as linear as the Metropolitan Police. Although the 10% most deprived LSOAs account for the highest proportion of stop and search (19.7% of the total), the second highest decile is in the mid-level of deprivation (17.8% of the total at decile 6). This outlier is due to this deprivation decile containing two LSOAs which account for close to 10% of West Midlands’s stop and search in the year ending March 2022 (Birmingham 138A and Birmingham 135C), These LSOAs contain the Bullring shopping centre and are close to major rail links. Stop and search hotspots are explored further in section 2.11.
Figure 2.33: Number of stops and searches that took place within the West Midlands Police Force Area in the year ending March 2022, grouped by the level of deprivation, where 1 contains the 10% of LSOAs with the highest level of deprivation, and 10 the 10% of LSOAs with the lowest level of deprivation
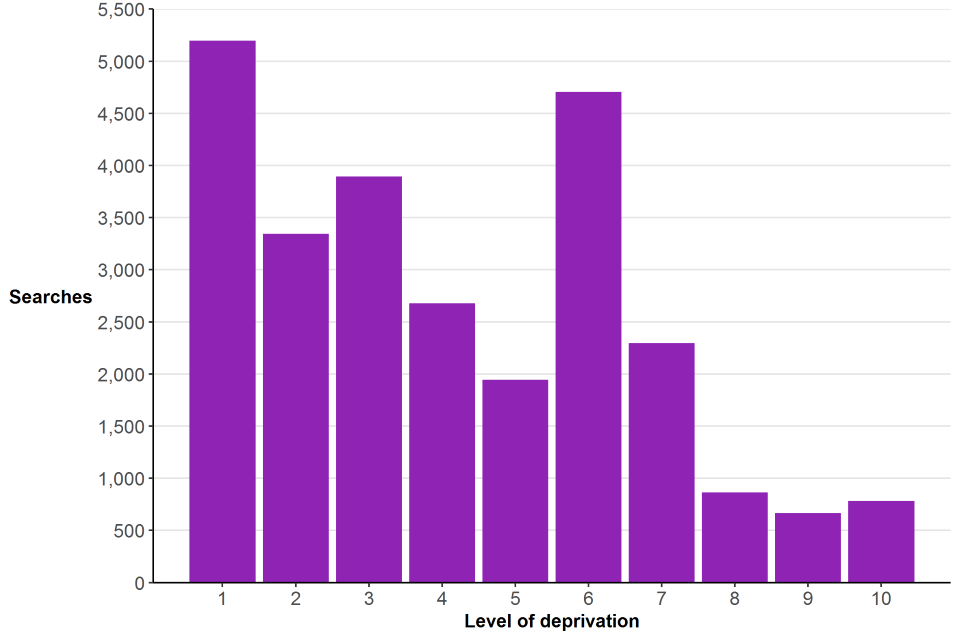
Source: Stop and Search data collection, Home Office and Indices of Multiple Deprivation, Department for Levelling Up, Housing and Communities
Notes:
- Horizontal axis values represent relative level of deprivation, where 1 is high deprivation and 10 is low deprivation.
- Each deprivation level contains approximately 168 LSOAs.
Durham Police Force Area
Figure 2.34 shows the volume of stop and search that took place in the year ending March 2022 at each relative deprivation decile within the Durham Police Force Area. 29.6% of stop and searches takes place in the 10% of LSOAs with the highest level of deprivation, whereas only 3.8% of stop and searches take place in the 10% of LSOAs with the lowest levels of deprivation. However, in many of the areas between the highest and lowest deprivation band, there is no distinct trend.
Figure 2.34: Number of stops and searches that took place within the Durham Police Force Area in the year ending March 2022, grouped by the level of deprivation, where 1 contains the 10% of LSOAs with the highest level of deprivation, and 10 the 10% of LSOAs with the lowest level of deprivation
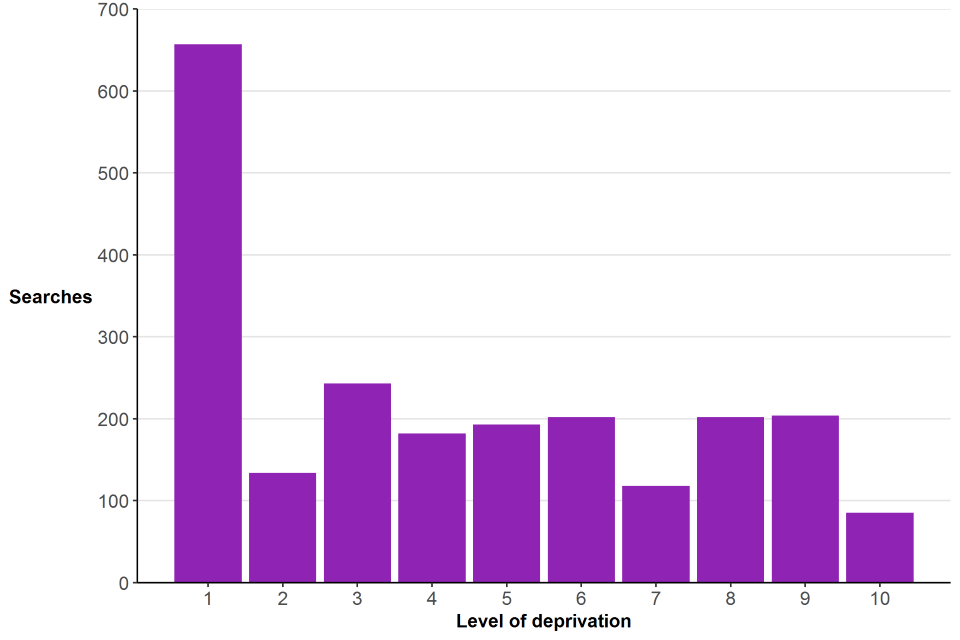
Source: Stop and Search data collection, Home Office and Indices of Multiple Deprivation, Department for Levelling Up, Housing and Communities
Notes:
- Horizontal axis values represent relative level of deprivation, where 1 is high deprivation and 10 is low deprivation.
- Each deprivation level contains approximately 39 LSOAs.
Kent Police Force Area
Figure 2.35 shows the volume of stop and search that took place in the year ending March 2022 at each relative deprivation decile within the Kent Police Force Area. Similar to the Metropolitan Police, this shows a fairly linear relationship between the level of deprivation and the level of stop and search, (as stop and search tends to increase as deprivation increases). For example, the 10% of LSOAs with the highest level of deprivation account for 20.8% of stop and searches, whereas the 10% of LSOAs with the lowest level of deprivation account for only 4.4% of stop and searches.
Figure 2.35: Number of stops and searches that took place within the Kent Police Force Area in the year ending March 2022, grouped by the level of deprivation, where 1 contains the 10% of LSOAs with the highest level of deprivation, and 10 the 10% of LSOAs with the lowest level of deprivation
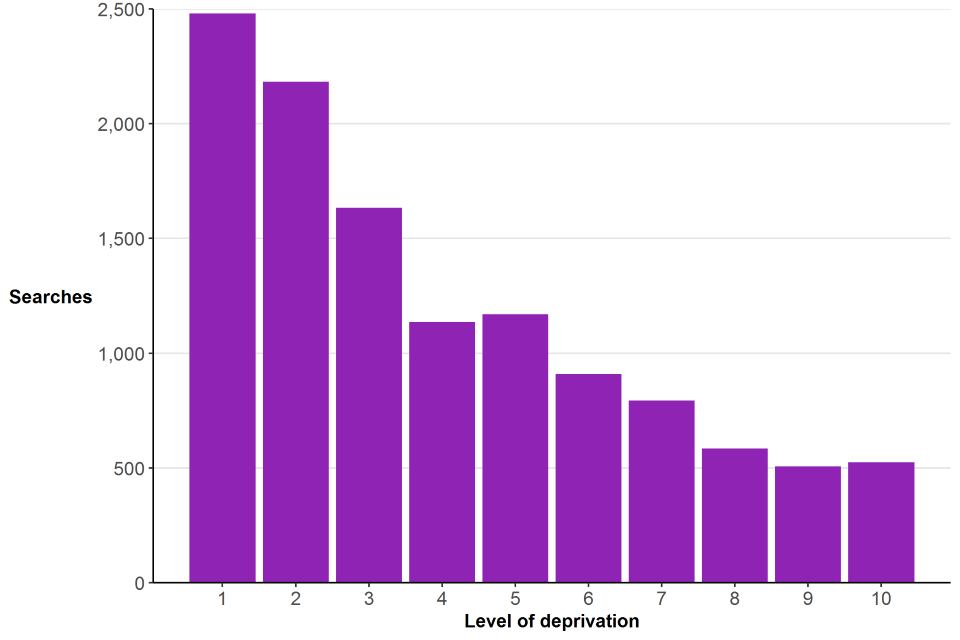
Source: Stop and Search data collection, Home Office and Indices of Multiple Deprivation, Department for Levelling Up, Housing and Communities
Notes:
-
Horizontal axis values represent relative level of deprivation, where 1 is high deprivation and 10 is low deprivation.
-
Each deprivation level contains approximately 107 LSOAs.
Surrey Police Force Area
Figure 2.36 shows the volume of stop and search that took place in the year ending March 2022 at each relative deprivation decile within the Surrey Police Force Area. Similar to West Midlands Police, there is a general decrease in the level of stop and search as deprivation decreases. However, deprivation decile 6 has the highest number of stop and searches (19.8% of the total), whereas deprivation decile 1 (the 10% of most deprived LSOAS) only accounted for 9.2% of stops and searches. Similar to West Midlands, the peak at deprivation decile 6 in Surrey is largely due one particular hotspot. In this instance, the hotspot LSOA is Runnymede 004C, which contains Thorpe Park Resort. This area alone accounts for 13% of Surrey’s stop and search in the year ending March 2022.
Figure 2.36 Number of stops and searches that took place within the Surrey Police Force Area in the year ending March 2022, grouped by the level of deprivation, where 1 contains the 10% of LSOAs with the highest level of deprivation, and 10 the 10% of LSOAs with the lowest level of deprivation
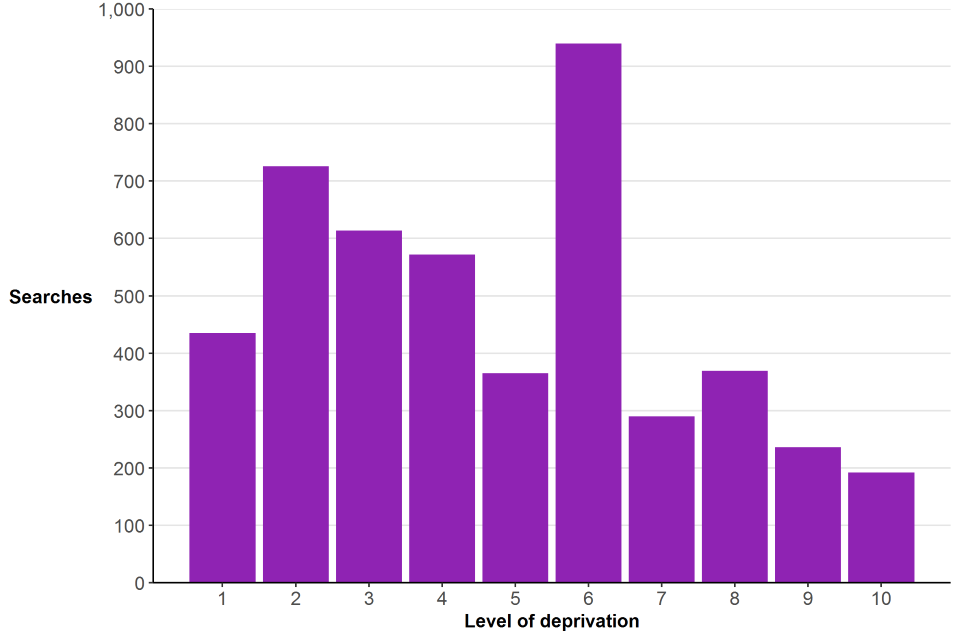
Source: Stop and Search data collection, Home Office and Indices of Multiple Deprivation, Department for Levelling Up, Housing and Communities
Notes:
-
Horizontal axis values represent relative level of deprivation, where 1 is high deprivation and 10 is low deprivation.
-
Each deprivation level contains approximately 71 LSOAs.
23 Areas combined
This section looks at the relationship between deprivation and stop and search in other areas of England (excluding MPS). MPS are excluded because their volume of stop and search would overly influence the national picture. The analysis uses data from 23 police forces[footnote 7] that were able to provide easting and northing location data for approximately 90% of records or above. These forces account for approximately 37% of stops and searches in England in the year ending March 2022.
Figure 2.37 shows the volume of stop and search that took place in the year ending March 2022 at each relative deprivation decile within the 23 Police Force Areas selected for analysis.. This shows that as the level of deprivation in these areas decreases, the volume of stop and search in those areas also generally decreases. The 10% of LSOAs with the highest level of deprivation account for 29.6% of stop and searches. This proportion of stop and search is close to the same amount that takes place in the 60% of LSOAs at the lower end of deprivation (30.9% of total stop and searches). The 10% of LSOAs with the lowest level of deprivation account for 2.7% of the volume of stop and search.
Figure 2.37: Number of stops and searches that took place within the 23 PFAs selected for analysis in the year ending March 2022, grouped by the level of deprivation, where 1 contains the 10% of LSOAs with the highest level of deprivation, and 10 the 10% of LSOAs with the lowest level of deprivation
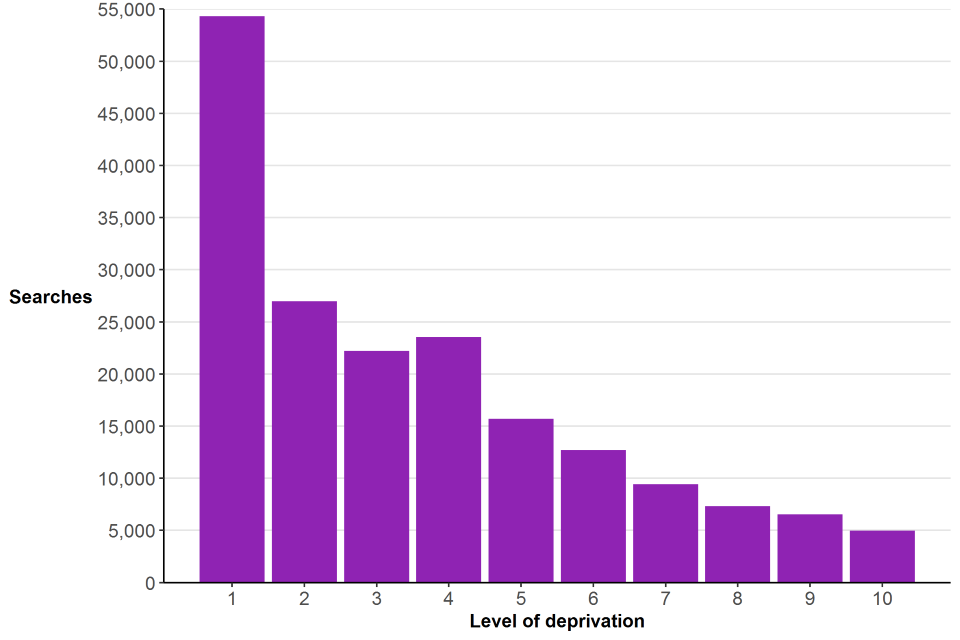
Source: Stop and Search data collection, Home Office and Indices of Multiple Deprivation, Department for Levelling Up, Housing and Communities
Notes:
- Horizontal axis values represent relative level of deprivation, where 1 is high deprivation and 10 is low deprivation.
- Each deprivation level contains approximately 1,708 LSOAs.
Table 2.11 shows a summary of the proportion of stop and search that takes place at each level of deprivation, in both the Metropolitan Police Force Area and the other 23 PFAs combined. The overall analysis indicates that, generally, there are higher levels of stop and search in areas with higher levels of deprivation. However, within certain PFAs, there are outliers with very high levels of stop and search, but medium levels of deprivation. These areas are often urban centres or major tourist attractions.
Table 2.11 Proportion of stop and searches at each level of deprivation, Metropolitan Police Force Area and 23 other PFAs in England combined
| % of stop and search | ||||||
|---|---|---|---|---|---|---|
| Level of deprivation | Metropolitan Police | West Midlands | Durham | Kent | Surrey | 23 PFAs combined |
| 1 | 16.3 | 19.7 | 29.6 | 20.8 | 9.2 | 29.6 |
| 2 | 15.6 | 12.7 | 6.0 | 18.3 | 15.3 | 14.7 |
| 3 | 14.9 | 14.8 | 10.9 | 13.7 | 13.0 | 12.1 |
| 4 | 12.6 | 10.2 | 8.2 | 9.5 | 12.1 | 12.8 |
| 5 | 10.5 | 7.4 | 8.7 | 9.8 | 7.7 | 8.5 |
| 6 | 8.9 | 17.8 | 9.1 | 7.6 | 19.8 | 6.9 |
| 7 | 7.1 | 8.7 | 5.3 | 6.7 | 6.1 | 5.1 |
| 8 | 6.1 | 3.3 | 9.1 | 4.9 | 7.8 | 4.0 |
| 9 | 5.2 | 2.5 | 9.2 | 4.3 | 5.0 | 3.6 |
| 10 | 2.7 | 3.0 | 3.8 | 4.4 | 4.1 | 2.7 |
2.12 Data quality
Since the year ending March 2021, under the Home Office Annual Data Requirement (ADR), police forces have supplied stop and search data in an incident-level format, increasing the opportunities for analysis. Though the format of the collection has changed, it is not expected to have any meaningful effect on the trends in stop and search at the national level.
As part of this data collection, police forces were supplied with reports to highlight potential issues with the data they supplied, including:
- duplicate records
- records with unusual age values
- incorrect date or time data
- any unusual changes in stop and search volumes
After reviewing these issues, some police forces submitted revised data sets. Home Office analysts will continue to work with police forces to improve the quality of the stop and search data they provide under the ADR.
Although the ethnicity analysis in this commentary focusses solely on aggregated ethnic groups (white, black, Asian, mixed or other), the accompanying open data breaks data down into the 18+1 self-defined ethnicity groups (white British, white Irish, other white etc).
Data presented here have been provided to the Home Office by 43 territorial police forces in England and Wales and the British Transport Police (BTP). Since the year ending March 2010, BTP have been providing data to the Home Office. Data on total searches prior to this period are therefore not directly comparable with more recent years. However, as BTP typically only account for just over 1.5% of all stop and searches each year, their exclusion has only a marginal impact on the longer-term time series.
Following the transition from a legacy IT system to a new force system, Greater Manchester Police (GMP) were unable to provide data returns to the Home Office, including stop and search, for the full year ending March 2020. Data for the first quarter of the year ending March 2020 was collected prior to these issues, and is included in stop and search open data tables accompanying this publication. Work is ongoing to rectify and improve the information held on their system, and GMP have provided full data for the full years ending March 2021 and March 2022. However, given ongoing improvement work, the data should be interpreted with caution, and is likely to be revised in future versions of these statistics. Additionally, as the force were only able to provide robust data for part of the year ending March 2020, Greater Manchester’s stop and search data has been removed from long-term year-on-year comparisons in this chapter, in order to provide a consistent time series.
The figures presented are correct at the time of publication and may include revisions submitted by forces for previous years.
For some years, certain forces were unable to provide all the requested breakdowns of the data; for example, the reason for some stop and searches or the ethnicity of the person searched may not have been provided for all cases. Such cases have been outlined in the relevant table notes. To ensure data are comparable over time, some forces may have been excluded from annual comparisons. These cases have been highlighted.
The User Guide provides further information on the quality assurance checks on the data, as well as details relating to definitions, legislation and procedure around stop and search.
Since April 2021, the Home Office has also collected data on reason for arrest. The aim of collecting this data is to understand how effectively the policing are using stop and search powers, for example if the reason for arrest is aligned with the reason for search it would be implied that this was a successful search. The way these data are currently recorded by police forces is not reliable or consistent and therefore it would not be appropriate to publish information on reason for arrest. Data quality checks showed that some forces will by default provide the same reason for arrest as for reason for search or they record all reasons for arrest as other.
Information on person identification is also collected from police forces on a voluntary basis. A person ID should relate to a unique individual. The purpose of collecting this data is to understand the extent to which people are repeatedly stopped and searched. However, analysis of this data has shown that for a large proportion of records, person_ID is either missing or has not been recorded correctly (for example it is clear from demographic information that the same person_ID has been used for different individuals). There are operational difficulties with recording these data as when an individual is stopped and searched they are not required to provide personal information.
Similarly, good quality data for self-defined ethnicity is reliant on the individual who is stopped and searched to provide this information, which they are not obliged to tell the police officer. As stated earlier in this chapter, 20% of stop and search records (excluding vehicle-only searches) are missing ethnicity data. To help close this gap we have used officer-defined ethnicity where self-defined ethnicity is not stated.
Future data collection
Given recent high-profile cases in the media on strip searches following a stop and search, the Home Office has plans to expand on the information collected on the nature of a stop and search. Currently, the Home Office collects information on whether a person’s outer clothing was removed (this is collected on a voluntary basis). The Home Office seeks to collect more detailed information on the level of search, including whether it was a More Thorough Search or Exposes Intimate Parts. From April 2023 the Home Office will start asking forces to record self-defined ethnicity using the ONS 2021 Census categories (19+1). The main change to the new Census categories is the addition of the Roma category under the white ethnic group.
2.13 Other data sources
Quarterly figures for stop and searches conducted in Great Britain under the Terrorism Act 2000 appear in the Home Office series Operation of police powers under the Terrorism Act 2000.
MOJ publishes a biennial Race and the criminal justice system series that includes data supplied by the Home Office on stop and search. The latest publication was released in December 2021.
The Metropolitan Police Service publishes monthly reports and a dashboard on the use of stop and search by the force. Other forces may publish similar reports.
Strip searches that occur in custody will be published in the Home Office Other PACE Powers publication on 17 November 2022. These data have been collected for the first time this year and are likely to be published as Experimental Statistics.
3. Arrests
Key results
In the year ending March 2022:
There were 663,036 arrests carried out by territorial police forces in England and Wales, an increase of 3% compared to the previous year in which there were 645,225 arrests, but down 2% from the year preceding the pandemic (ending March 2020).
The change in the number of arrests in the latest year varied across different offence groups. Arrests for sexual offences increased by almost a third (32%), whereas arrests for drug offences fell by 17%. The overall volume increase in arrests was driven by a 12% increase (32,100) in arrests for violence against the person offences, the largest arrest type.
The pattern across forces was mixed, with 26 forces showing an increased number of arrests compared with last year while 17 police forces made fewer arrests.
As with previous years, the Metropolitan Police accounted for the greatest number of arrests (16% or 103,877 of total arrests).
Under 21s accounted for a similar proportion of arrests as in the year ending March 2021 (16%), down from 39% of arrests in the year ending March 2007.
3.1 Introduction
Data presented here are on the police power of arrest. In line with police recorded crime statistics, the arrest collection is designed to cover only arrests for notifiable offences[footnote 8] carried out by police in England and Wales. Further, in this collection, an arrest is counted for each occasion a person is arrested, provided that the arrest is for an offence which is not related to an offence for which the person has already been subject to arrest during the same year. If the arrest is connected, or if a person has been arrested for one or more notifiable offences at the same time, only one arrest is counted and the offence with the highest maximum penalty should be recorded. Thus, it does not provide a measure of all arrests made by the police.
Data are provided to the Home Office by the 43 territorial police forces in England and Wales and are presented on a financial-year basis. Lancashire Constabulary were not able to provide complete data in the years ending March 2018 and March 2019. Therefore, to ensure comparability with previous years, Lancashire Constabulary have been excluded from time-series analyses in the chapter and accompanying data tables that include data for the year ending March 2019 and prior years. In the latest year Lancashire contributed around 2% of the total number of arrests in England and Wales.
The Home Office does not receive data on arrests from the British Transport Police (BTP).
Figures on arrests reported to the Home Office reflect police activity and should not be used to infer levels of crime committed by offenders. For example, the number of arrests for drug offences is greatly dependent on police activities and priorities and does not give a reliable indication of trends in the level of drug offending. Data on crime in England and Wales is available here: Crime and justice - Office for National Statistics (ons.gov.uk)
The Office for National Statistics (ONS) amended the offence groups for the police recorded crime series in the year ending March 2013. Since the publication of ‘Police powers and procedures’ in October 2016, arrests data collected by the Home Office on the reason for arrest are in line with the ONS crime groups. For this reason, data from year ending March 2016 on the reason for arrest are not directly comparable with earlier years.
Where a person has been arrested for one or more notifiable offence on the same occasion, forces are asked to record the arrest against the offence with the highest maximum penalty (the primary arrest). However, Devon and Cornwall Police and North Wales Police are unable to separately identify the primary arrest in a series of reasons for arrests, and Kent Police have only been able to identify primary arrests since November 2018. Due to this, where someone had been arrested for multiple offences this has been counted as multiple arrests, therefore these forces’ data are not directly comparable with other forces. These forces have minimal effect on national totals and have therefore been included in the England and Wales total.
3.2 Trends in the number of arrests
In the year ending March 2022 there were 663,036 arrests carried out by territorial police forces in England and Wales. This was an increase of 3% from the 645,225 arrests in the year ending March 2021, but down 2% from the year preceding the pandemic (ending March 2020). The total number of arrests has remained fairly stable for 4 years, following a downward trend between the years ending March 2008 to March 2018 (Figure 3.1). Over the past decade the proportion of arrests accounted for by males has remained similar, between 83-86%.
Figure 3.1: Number of arrests, by sex, England and Wales, years ending March 2007 to 2022
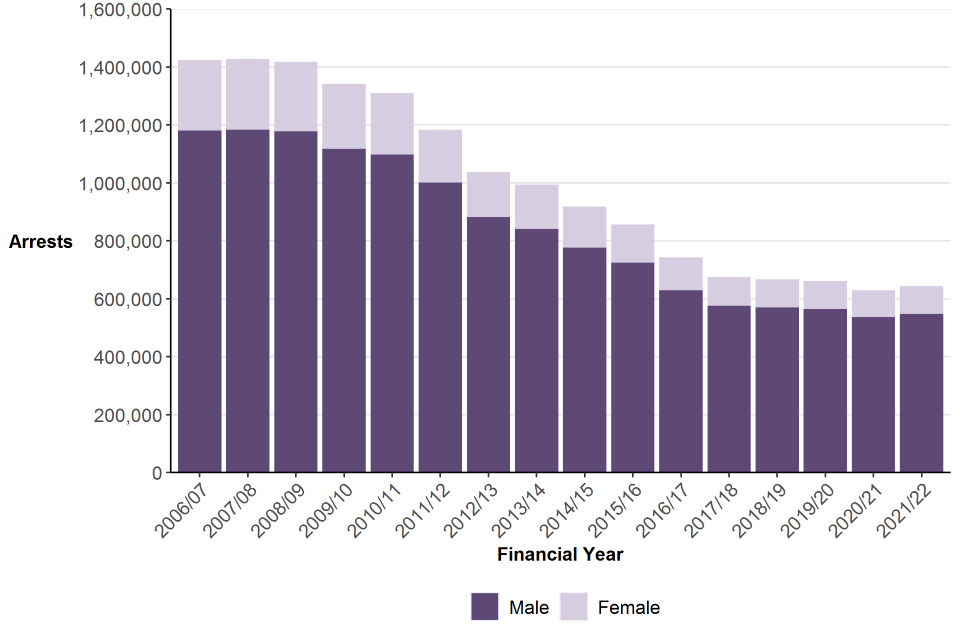
Source: Arrests table A.01, Home Office.
Notes:
-
Arrests data excludes Lancashire Constabulary for all years.
-
In the years ending March 2021 and March 2022 ‘Other’ and ‘Unknown’ sex were also collected, however these account for just 3,690 arrests (0.6% of total arrests) in the latest year.
3.3 Arrests by offence group
Almost half of all arrests by police in England and Wales were connected with violence against the person offences (46%). The next most common offence group was theft, which accounted for 12% of all arrests (Figure 3.2). The proportion of arrests in each offence group has changed over the past 6 years, with violence against the person offences up from 35% 6 years ago, and theft offences down from 22% 6 years ago.
Figure 3.2: Proportion of arrests in each offence group, England and Wales, year ending March 2022
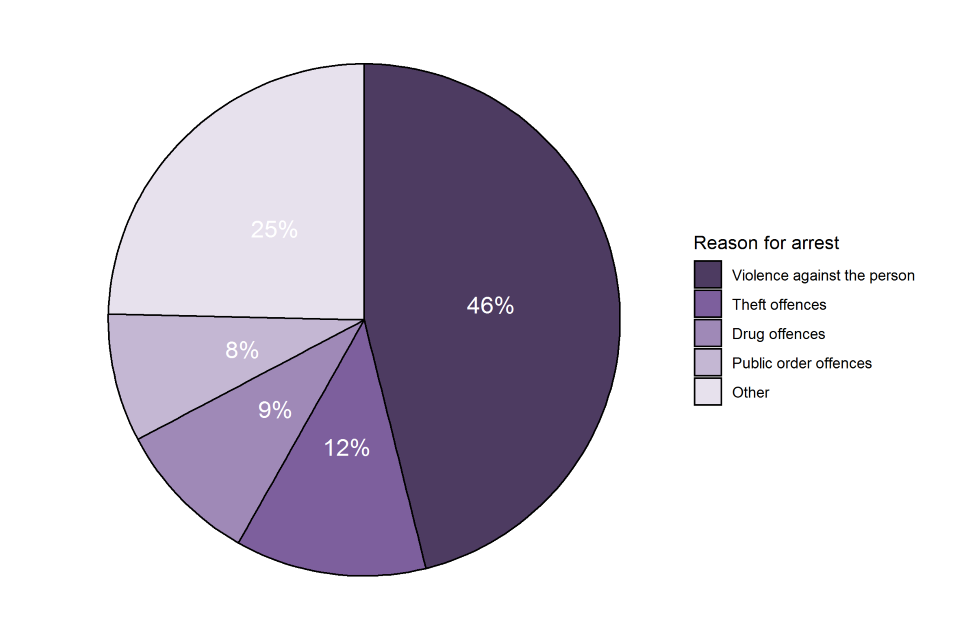
Source: Arrests table A.02, Home Office.
Notes:
- Other reasons for arrest include criminal damage and arson, miscellaneous crimes against society, possession of weapons offences, sexual offences, robbery and fraud offences. A full breakdown of reasons for arrests is in Table 3.2.
Many offence types were represented in the arrest collection in a different proportion as their distribution in the recorded crime series. For example, violence against the person offences accounted for a higher proportion of arrests (46%) than the 33% it comprised of all police recorded crime in the year ending March 2022. Theft offences made up 24% of all police recorded crime (ONS Crime Statistics), yet 12% of all arrests. Another notable difference was fraud, which comprised just 1% of all arrests but 15% of all recorded crime (Figure 3.3).
Direct comparisons between the two series should be made with caution since arrests relate to persons and recorded crime relates to offences. For example, one offence may be committed by multiple offenders and therefore may generate several arrests. Conversely an offender may be arrested for committing two or more recorded crimes (e.g. shoplifting and possession of drugs) but only one arrest will be recorded. In addition, some offences can be resolved without the use of an arrest, for example through the issuing of a fixed penalty notice or cannabis warning. Finally, some crimes take longer to investigate than others and therefore arrests and charges may lag trends in recorded crime.
As noted elsewhere (Crime Outcomes in England and Wales: year ending March 2022 statistical bulletin), in recent years police forces have been dealing with both an increased volume of crime and a more complex crime mix. This is thought to have contributed to a downward trend in both the volume and proportion of crimes resulting in a charge or summons and a growth in the proportion of cases in which victims do not support police action. This provides important context to the statistics on arrests presented here. Data on the outcomes assigned to police recorded crime, as well as the median length of time taken to assign an outcome by offence group, can be found in the ‘Crime outcomes, England and Wales’ statistical bulletin.
Figure 3.3: Offence group breakdowns of persons arrested in England and Wales and police recorded crime, year ending March 2022
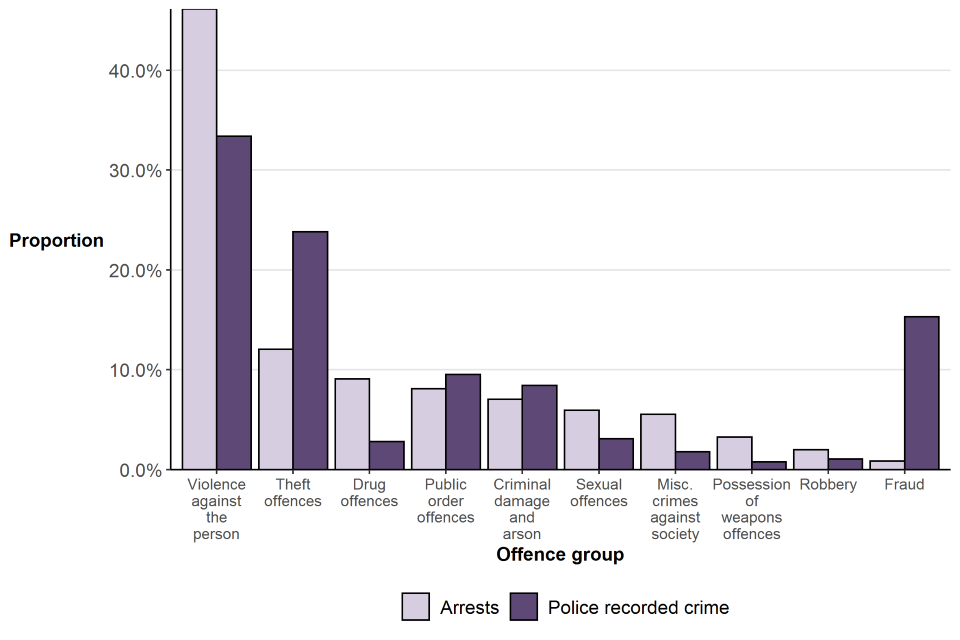
Source: Arrests table A.02, Home Office and ONS Crime Statistics.
Notes:
- Following a change in offence groups (in the year ending March 2016) it is believed that a number of police forces are incorrectly recording some ‘public order’ offences against ‘miscellaneous crimes against society’. Caution should therefore be exercised when comparing these offences over time and across forces.
The change in the number of arrests in the latest year varied across different offence groups. Most offence types saw a decrease, except for violence against the person, sexual offences, and public order offences (Table 3.1). The 12% increase in arrests for violence against the person offences, the largest offence group in terms of arrest volume, drove the overall increase in arrests (up by 32,100 compared with the previous year). Police recorded crime similarly saw an 18% increase in this offence group, as published in the ‘Crime in England and Wales’ statistical bulletin. Previously there had been small increases in arrests for violence against the person.
Arrests for sexual offences saw the second largest volume increase, up by almost a third (32% or 9,462 offences), following four years where there was little change, and was the highest number of arrests for sexual offences in the 7 years for which data can be directly compared. 41 of the 43 police forces reported an increase in this offence type in the latest year. Police recorded crime also saw a record number of reported sexual offences following an increase of 32% in the last year. The latest figures may reflect a number of factors, including the impact of high-profile incidents, media coverage, and campaigns on people’s willingness to report incidents to the police, as well as a potential increase in the number of victims. Prior to the pandemic, the number of police recorded sexual offences was well below the number of victims estimated in the Crime Survey for England and Wales.
Arrests for drug offences fell by 17% to 60,301. All but 4 forces saw a fall in arrests for this offence type in the latest year. Arrests for drugs had been increasing for 3 years up to around 72,000 in each of the years ending March 2020 and March 2021, however, the latest figure returns the number of drug arrests to slightly below the level seen in the year ending March 2018. Police recorded drug offences similarly fell by 16% in the latest year and stop and searches for drug offences fell by 30% (Chapter 2).
With the exception of the deviations in trends in violence against the person, sexual and drug offences already described arrests for other offence groups followed similar trends to previous years. Most offence groups have shown a fall or no change in the volume of arrests in recent years. Much of the fall in arrests since the year ending March 2016 has been driven by falls to arrests for theft and miscellaneous crimes. Theft offences, the second largest offence group, has decreased by 59% since the year ending March 2016 (equivalent to 115,305 arrests), and has contributed to around half of the fall in arrests in that time period. Miscellaneous crimes also fell by 58%, or 50,600 arrests. Although fraud offences had the largest percentage change during that period (down 62%), they make up the smallest proportion of arrests so had less impact on the overall change.
Possession of weapons offences had the largest increase (up by 28%) compared to the year ending March 2016, although this offence type accounts for just 3% of all arrests in the latest year. Stop and searches for offensive weapons also more than doubled (up by 130%) since the year ending March 2016 – the second largest percentage increase in any search reason during this time period other than anticipation of violence, which increased by 348%.
Figure 3.4: Number of arrests, by offence group, England and Wales, years ending March 2016 to March 2022
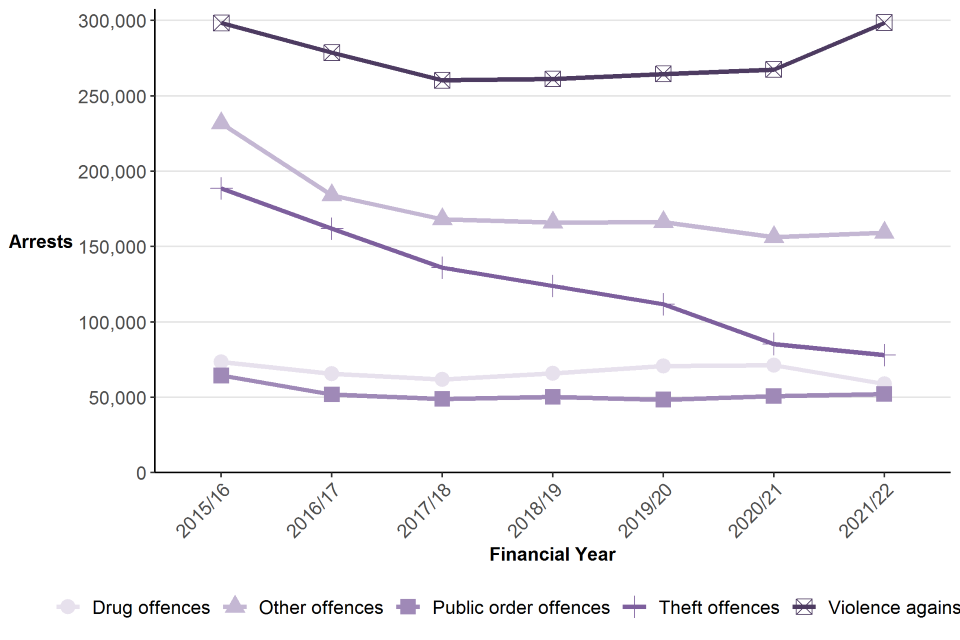
Source: Arrests open data tables, Home Office and ONS Crime Statistics
Notes:
- Arrests data excludes Lancashire Constabulary for all years.
Other than violence against the person, sexual offences, and drug offences, most arrest types did not mirror changes seen in police recorded crime in the latest year. All other crime types showed an increase in the number of crimes reported to the police but a decrease in arrests (other than public order offences which showed a small increase of 3% compared to a 24% increase in crime).
Table 3.1: Offence group breakdowns of person arrested in England and Wales, year ending March 2021 compared with year ending March 2022
| Offence group | Year ending 31 March 21 | Year ending 31 March 22 | % change |
|---|---|---|---|
| Violence against the person | 273,724 | 305,824 | 11.7% |
| Theft offences | 87,390 | 79,933 | -8.5% |
| Drug offences | 72,524 | 60,301 | -16.9% |
| Public order offences | 52,104 | 53,634 | 2.9% |
| Criminal damage and arson | 47,465 | 46,724 | -1.6% |
| Sexual offences | 29,860 | 39,322 | 31.7% |
| Miscellaneous crimes against society | 39,640 | 36,732 | -7.3% |
| Possession of weapons offences | 22,485 | 21,626 | -3.8% |
| Robbery | 14,097 | 13,295 | -5.7% |
| Fraud offences | 5,936 | 5,645 | -4.9% |
| Total | 645,225 | 663,036 | 2.8% |
Source: Arrests table A.02, Home Office.
Notes:
- Following a change in offence groups (in the year ending March 2016) it is believed that a number of police forces are incorrectly recording some ‘public order’ offences against ‘miscellaneous crimes against society’. Caution should therefore be exercised when comparing these offences over time and across forces.
3.4 Arrests by sex
The data collection has been set up to accommodate four options for the sex of the person searched: female, male, other and unknown. It is likely that recording includes a mixture of sex and gender, and ‘Other’ may comprise people who define themselves as non-binary or transgender. However, only 15 of the 43 police forces recorded any arrests of people defined as ‘other’. This suggests that different recording systems used by police forces have different levels of detail to which the gender of the person arrested can be recorded. This report reports on data in the format they are collected from the police, and Home Office continues to work with stakeholders to bring these data in line with Government Statistical Service sex and gender harmonisation standards.
The majority of arrests in the latest year were of males (85% of total arrests or 561,211 arrests), a percentage that has been stable for more than ten years. This is slightly lower than both the proportion of stop and searches that were of males (90%) and the proportion of stop and searches resulting in arrest that were of males (92%) (see Chapter 2).
Both males and females were most commonly arrested for violence against the person offences, accounting for 44% of all male arrests and 55% of all female arrests. This was followed by arrests for theft offences (12% for both males and females). However, there were some differences in arrest patterns for males and females. For example, females have consistently made up a very small proportion of those arrested for sexual offences (2%) and possession of weapons offences (8%), but a larger proportion of those arrested for fraud offences (23%). Figure 3.5 shows the split for each offence type.
Figure 3.5: Proportion of arrests by sex and offence group, England and Wales, year ending March 2022
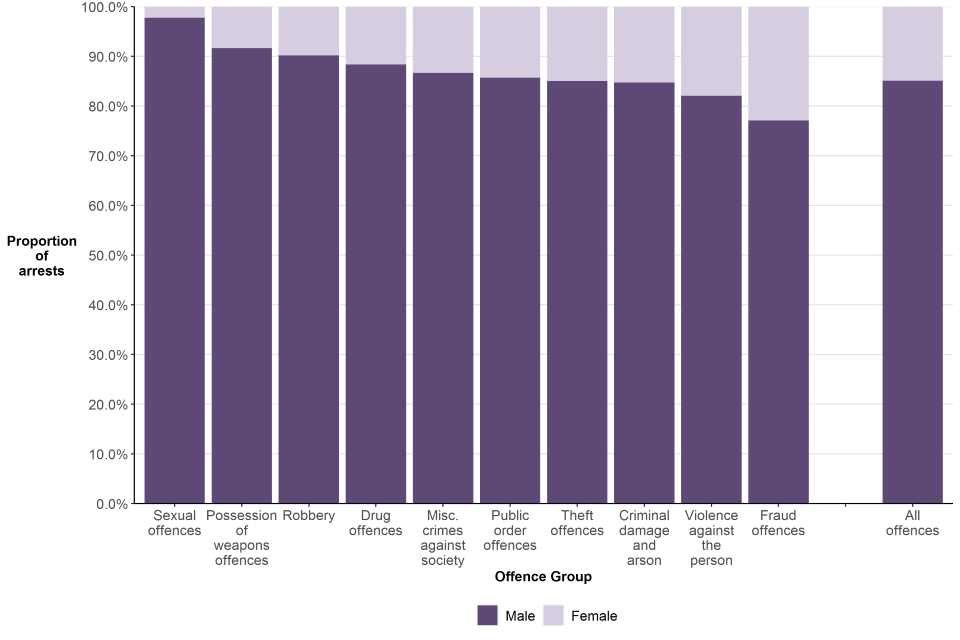
Source: Arrests table A.02, Home Office.
Notes:
- Excludes Other (186 arrests) and those whose sex was unknown (3,504 arrests).
3.5 Arrests by age
Data on arrests by age are grouped into five categories: ‘Under 10’, ‘Aged 10 to 17’, ‘Aged 18 to 20’, ‘Aged 21 and over’, or, ‘Age unknown’. The legal minimum age for prosecution in England and Wales is 10 years old, so the ‘Under 10’ category includes persons who, after further investigation, were found to be too young to be charged with an offence.
The majority (84%) of all arrestees in the latest year were aged 21 or over (the same as in the previous year). In comparison, 75% of the general population are aged 21 or over. However, there was some variation in age when analysing the reasons for arrest. For example, although persons under 21 years old accounted for 16% of all arrests, they made up 48% of arrests for robbery offences and almost a third (31%) of arrests for possession of weapons offences. Those aged 21 or over made up 90% of all arrests for fraud offences. Figure 3.6 shows the number of persons arrested by offence type and age-group.
Figure 3.6: Age-group of persons arrested, by offence type, England and Wales, year ending March 2022
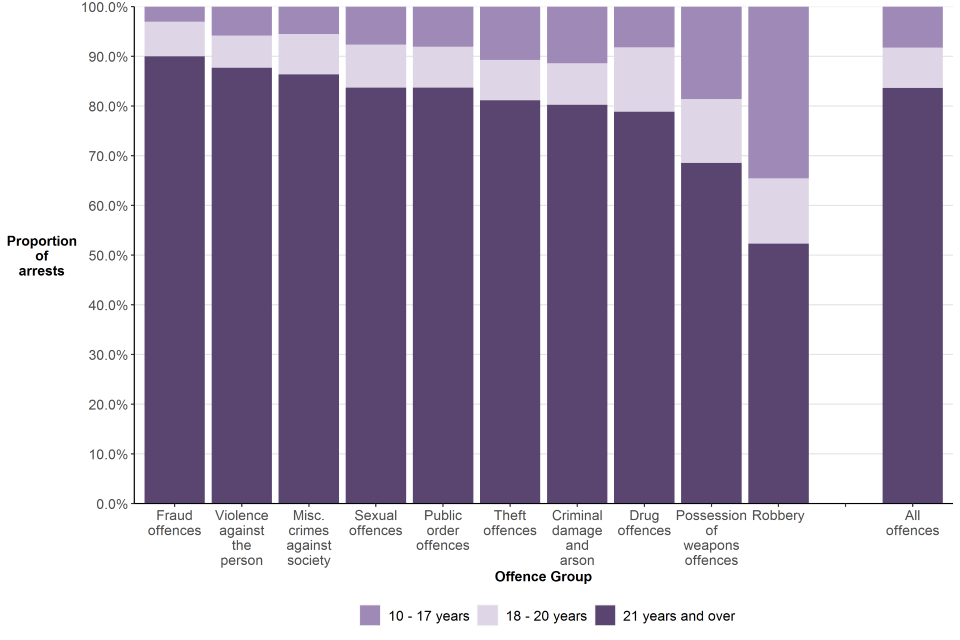
Source: Arrests table A.03, Home Office.
Notes:
- Excludes those whose age was unknown (0.08% or 523 arrests).
In line with the overall increase in arrests, the number of arrests of those aged 21 and over has increased by 3% in the latest year, although is at a similar level to the year ending March 2020 (i.e. before the pandemic) and the preceding 2 years. Arrests of people aged 18-20 have continued to decline, down 3% on last year, and 12% since the year ending 2020. Although arrests of children aged 10-17 have increased 8% in the latest year, they are still down on previous years (13% on March 2020).
As Figure 3.7 shows, arrests across all three age-groups showed decreases over the past decade, but arrests of those age under 21 fell more sharply compared with those aged 21 and over, which have levelled off more recently. There has therefore been a shift in the age profile of those arrested over this period; in the year ending March 2007 those aged 21 and over accounted for 61% of all arrests but accounted for 84% in each of the latest two years.
Figure 3.7: Number of arrests (indexed to 100 in the year ending March 2007) by age group, England and Wales, years ending March 2007 to 2022
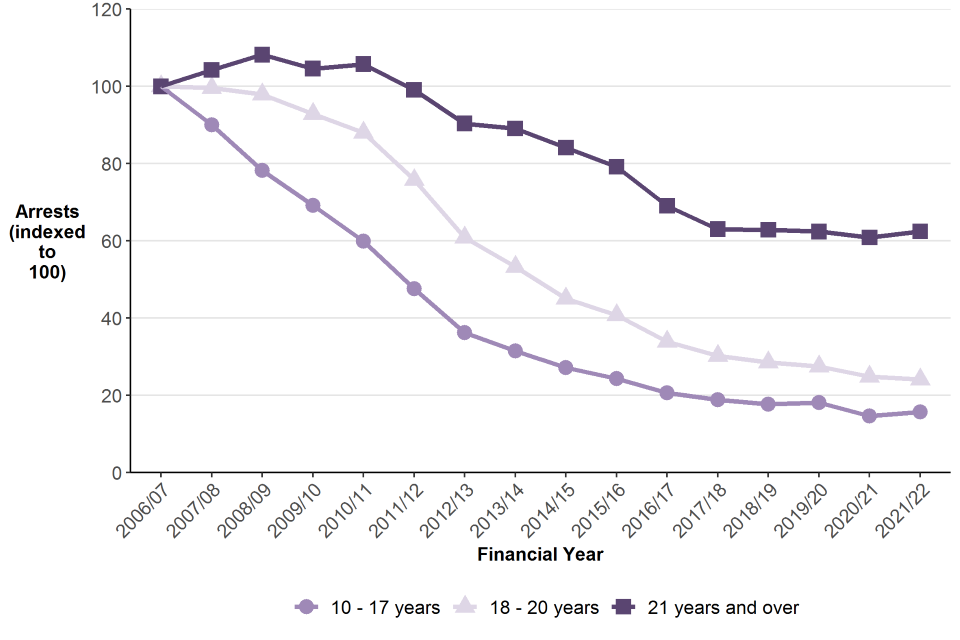
Source: Arrests table A.01b, Home Office.
Notes:
- Excludes Lancashire Constabulary.
3.6 Arrests by ethnicity
When an individual is arrested, they are asked to define their ethnicity. For the purpose of this analysis, these are grouped into the following six categories:
- white
- black (or black British)
- asian (or Asian British) - including Chinese from the year ending March 2020 onwards
- mixed
- other ethnic group - included Chinese for the years prior to March 2020
- not stated
Since the year ending March 2020, the number of arrests has fallen in all ethnic groups. The black ethnic group showed the greatest fall of down 12.8%, followed by mixed (down 8.5%), and Asian (down 4.8%). Other and white ethnic groups showed smaller falls (-1.2% and -0.6% respectively). Combined, the number of arrests of people from all minority ethnic groups (excluding white minorities) fell by 8.6%.
Table 3.2: Ethnic breakdown of persons arrested in England and Wales, year ending March 2022 compared with year ending March 2020
| Self-defined ethnicity | Year ending 31 March 20 | Year ending 31 March 22 | % change |
|---|---|---|---|
| Asian (or Asian British) | 44,160 | 42,028 | -4.8% |
| Black (or black British) | 58,502 | 51,018 | -12.8% |
| Mixed | 21,881 | 20,030 | -8.5% |
| White | 441,041 | 438,527 | -0.6% |
| Other ethnic group | 9,916 | 9,801 | -1.2% |
| Not stated | 100,976 | 101,632 | 0.6% |
| All minority ethnic groups (excluding white minorities) | 134,459 | 122,877 | -8.6% |
| Total | 676,476 | 663,036 | -2.0% |
Source: Arrests table A.04, Home Office.
Excluding those who did not state their ethnicity (who accounted for around 15% of arrestees), proportions of arrests by ethnicity remained relatively stable to the year ending March 2020. Of those arrested, 78% of those defined their ethnicity as White (77% in March 2020), 9% as black (previously 10%) and 7% as Asian (previously 8%). The remaining considered themselves either of mixed ethnicity (4%) or any other ethnic group (2%) (also similar to the previous year).
The following analysis considers the ethnicity of those arrested relative to the population as a whole, by calculating arrest rates for each ethnic group. Population data is based on the 2011 Census, and so should be considered with caution given the length of time since the last Census. Census 2021 population estimates broken down by ethnicity are expected to be published in late 2022, and analysis in this chapter will be updated in due course. Data are presented in terms of how likely people from black, Asian, mixed and other ethnic backgrounds are to be arrested compared with those who identify as White.
Persons who identified as black or black British were arrested at a rate 3.0 times higher than those who identified themselves as White (down from 3.3 times in the previous year and from 3.4 times in March 2020); mixed and other ethnicities were arrested at a rate 1.8 and 1.9 times higher, and people who identified as Asian or Asian British were arrested at a rate 1.1 times higher (Table 3.3).
Combined, people of minority ethnic backgrounds excluding white minorities were arrested at a rate of 1.7 times higher than those who identified themselves to be White in the latest year (down from 1.9 times in March 2021 and March 2020).
Table 3.3: Arrests rate per 1,000 population by self-defined ethnicity, England and Wales, year ending March 2022
| Self-defined ethnicity | Arrests rate per 1,000 population |
|---|---|
| Asian (or Asian British) | 10 |
| Black (or black British) | 27 |
| Mixed | 16 |
| White | 9 |
| Other | 17 |
| All minority ethnic groups (excluding white minorities) | 16 |
| Total | 12 |
Source: Arrests table A.04, Home Office.
Notes:
- Population breakdowns are based on the 2011 census. It is likely that ethnicity breakdowns have changed since 2011, so figures in this table should be considered estimates only.
3.7 Arrests by police force area
Of the 43 forces in England and Wales, 26 showed an increase in the number of arrests in the latest year compared with the previous, while 17 forces showed a decrease.
As with previous years, the Metropolitan Police accounted for the greatest number of arrests (16% of total arrests), and West Midlands accounted for the second greatest number of arrests, comprising 6% of the total. This is similar to police recorded crime where these two forces account for 16% and 7% of total crimes (excluding fraud).
In the following section, arrest rate per population has been calculated using rounded estimates from the 2021 census, which are currently available only at police force area level. More detailed breakdowns due to be published later in 2022.
The number of arrests expressed per 1,000 people of the population in England and Wales[footnote 9] was 11 in the year ending March 2022. This varied by PFA[footnote 10] with the highest rate in Humberside (23 per 1,000). The lowest arrest rates, at seven arrests per 1,000 members of the population, was found in the Cambridgeshire, Dorset, Gloucestershire, Staffordshire and Surrey PFAs. In comparison, there were 89 police recorded crimes (excluding fraud) per 1,000 population in England and Wales in the year ending March 2022.
Differences in the proportion of arrestees from ethnic minority backgrounds (excluding white minorities) in some PFAs are likely to, in part, reflect the differing resident and day-time populations in those areas. For example, the proportion of those arrested who identified as black, Asian, mixed or other ethnic background ranged from 3% (in Cumbria and Dyfed-Powys PFAs) to 54% (in the Metropolitan Police Service area). Population data from the 2011 Census shows that in Cumbria and Dyfed-Powys the combined population of black, Asian, mixed and other ethnic groups was 2%, whereas in the Metropolitan Police area it was 40%. However, comparisons in arrest rates between areas should be made with caution because population breakdowns are based on residents of a particular area (i.e. they do not include visitors). Census 2021 population estimates by ethnicity are expected to be published by the ONS in late 2022.
Figure 3.8: Number of persons arrested per 1,000 population, by Police Force Area, England and Wales, year ending March 2022
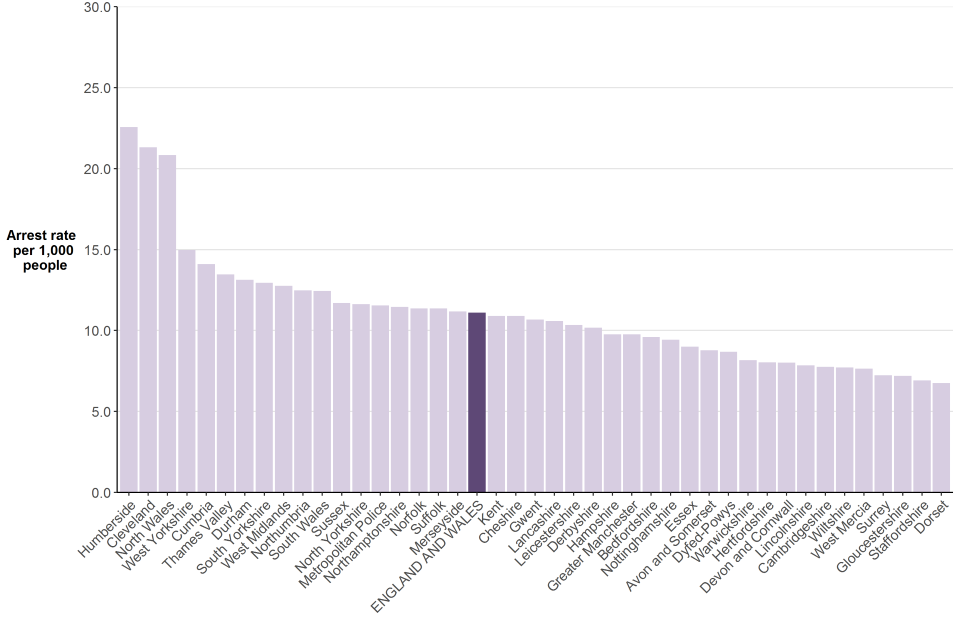
Source: Arrests table A.05, Home Office.
Notes:
-
Calculated using 2021 census estimates for England and Wales.
-
City of London rates not shown due to the small resident population of the area relative to the transient or visiting population. City of London figures have been included in the England and Wales total.
-
Devon and Cornwall Police and North Wales Police are unable to separately identify the primary arrest in a series of reasons for arrests. Due to this, these forces’ data includes all arrests for notifiable offences and are not directly comparable with other.
3.8 Data quality and interpreting figures
The figures presented are correct at the time of publication and include revisions submitted by forces for the previous years.
Between April 2016 and March 2019, Lancashire Constabulary were unable to supply complete arrests data. Figures for this force were therefore estimated in the open data tables for the year ending March 2017 but have been omitted for the years ending March 2018 and March 2019. Lancashire Constabulary have been excluded from time-series analyses that include data for the year ending March 2019 and prior years, but included in analysis of data from the most recent three years.
Devon and Cornwall Police and North Wales Police are unable to separately identify the primary arrest in a series of reasons for arrests. Due to this, these forces’ data includes all arrests for notifiable offences and are not directly comparable with other forces. Kent Police have only been able to identify primary arrests since November 2018, so caution should be taken when interpreting their data from the years ending March 2020 to March 2022 with previous years. These forces have minimal effect on national totals and have therefore been included in the England and Wales total.
3.9 Other data sources
While some ethnic breakdowns are provided here, more detailed figures and analyses are published by the Ministry of Justice (MOJ). The latest edition of its Statistics on Ethnicity and the Criminal Justice System series was published in December 2021. Figures presented relate to the period up to and including the financial year ending March 2020 and may since have been superseded by data included in this edition of ‘Police powers and procedures’.
MOJ also publishes biennial statistics on the representation of females and males as victims, suspects, offenders and employees in the criminal justice system. Its latest statistics can be found in Statistics on Women and the Criminal Justice System 2019, and includes arrest figures for the financial year ending March 2019.
The Youth Justice Board’s series on Youth Justice Statistics looks at the flow of young people through the Youth Justice System. The latest edition was released in January 2022 and includes arrests data for the financial year ending March 2021.
Data on individuals given an out of court disposal or proceeded against at court are published in MOJ’s Criminal Justice Statistics Quarterly.
Crime Statistics, including police recorded crime figures, are published by ONS on a quarterly basis.
Annex
Table A1: Number of stop and searches in the year ending March 2022, by self-defined ethnicity and Police Force Area
| Police Force Area | Asian | Black | Mixed | Other | White | Total |
|---|---|---|---|---|---|---|
| Cleveland | 206 | 94 | 84 | 79 | 4,327 | 4,790 |
| Durham | 25 | 19 | 15 | 10 | 2,010 | 2,079 |
| Northumbria | 165 | 84 | 41 | 8 | 3,869 | 4,167 |
| North East Region | 396 | 197 | 140 | 97 | 10,206 | 11,036 |
| Cheshire | 42 | 94 | 103 | 37 | 4,711 | 4,987 |
| Cumbria | 54 | 29 | 23 | 17 | 1,964 | 2,087 |
| Greater Manchester | 1,130 | 801 | 238 | 117 | 5,404 | 7,690 |
| Lancashire | 1,089 | 165 | 152 | 38 | 7,006 | 8,450 |
| Merseyside | 399 | 721 | 607 | 471 | 37,790 | 39,988 |
| North West Region | 2,714 | 1,810 | 1,123 | 680 | 56,875 | 63,202 |
| Humberside | 138 | 135 | 83 | 30 | 4,514 | 4,900 |
| North Yorkshire | 112 | 30 | 37 | 14 | 1,475 | 1,668 |
| South Yorkshire | 756 | 533 | 204 | 100 | 7,494 | 9,087 |
| West Yorkshire | 4,126 | 775 | 684 | 145 | 8,355 | 14,085 |
| Yorkshire and the Humber Region | 5,132 | 1,473 | 1,008 | 289 | 21,838 | 29,740 |
| Derbyshire | 158 | 60 | 68 | 16 | 1,046 | 1,348 |
| Leicestershire | 666 | 477 | 181 | 53 | 3,055 | 4,432 |
| Lincolnshire | 33 | 64 | 36 | 28 | 2,339 | 2,500 |
| Northamptonshire | 128 | 316 | 134 | 17 | 2,164 | 2,759 |
| Nottinghamshire | 207 | 327 | 167 | 43 | 2,547 | 3,291 |
| East Midlands Region | 1,192 | 1,244 | 586 | 157 | 11,151 | 14,330 |
| Staffordshire | 309 | 133 | 141 | 25 | 3,324 | 3,932 |
| Warwickshire | 120 | 131 | 69 | 19 | 1,222 | 1,561 |
| West Mercia | 264 | 182 | 76 | 24 | 3,199 | 3,745 |
| West Midlands | 6,836 | 3,537 | 1,926 | 19 | 9,364 | 21,682 |
| West Midlands Region | 7,529 | 3,983 | 2,212 | 87 | 17,109 | 30,920 |
| Bedfordshire | 683 | 430 | 126 | 48 | 1,679 | 2,966 |
| Cambridgeshire | 195 | 147 | 81 | 51 | 1,580 | 2,054 |
| Essex | 552 | 1,045 | 389 | 142 | 11,916 | 14,044 |
| Hertfordshire | 450 | 665 | 266 | 129 | 4,437 | 5,947 |
| Norfolk | 64 | 168 | 127 | 63 | 4,343 | 4,765 |
| Suffolk | 66 | 271 | 108 | 84 | 3,108 | 3,637 |
| East of England Region | 2,010 | 2,726 | 1,097 | 517 | 27,063 | 33,413 |
| London, City of | 74 | 254 | 89 | 40 | 806 | 1,463 |
| Metropolitan Police | 25,624 | 48,158 | 7,230 | 5,682 | 66,023 | 152,717 |
| London Region | 25,898 | 48,412 | 7,319 | 5,722 | 66,829 | 154,180 |
| Hampshire | 282 | 532 | 294 | 101 | 7,151 | 8,360 |
| Kent | 354 | 746 | 390 | 232 | 8,261 | 9,983 |
| Surrey | 334 | 290 | 146 | 67 | 3,391 | 4,228 |
| Sussex | 183 | 427 | 153 | 94 | 4,580 | 5,437 |
| Thames Valley | 1,591 | 1,017 | 590 | 88 | 7,193 | 10,479 |
| South East Region | 2,744 | 3,012 | 1,573 | 582 | 30,576 | 38,487 |
| Avon and Somerset | 87 | 417 | 207 | 67 | 4,437 | 5,215 |
| Devon and Cornwall | 62 | 85 | 55 | 13 | 3,679 | 3,894 |
| Dorset | 35 | 134 | 73 | 16 | 1,607 | 1,865 |
| Gloucestershire | 38 | 74 | 84 | 3 | 1,503 | 1,702 |
| Wiltshire | 51 | 88 | 39 | 4 | 1,197 | 1,379 |
| South West Region | 273 | 798 | 458 | 103 | 12,423 | 14,055 |
| ENGLAND | 47,888 | 63,655 | 15,516 | 8,234 | 254,070 | 389,363 |
| Dyfed-Powys | 23 | 19 | 25 | 0 | 2,200 | 2,267 |
| Gwent | 67 | 61 | 36 | 13 | 1,455 | 1,632 |
| North Wales | 37 | 22 | 29 | 18 | 3,782 | 3,888 |
| South Wales | 356 | 387 | 239 | 144 | 8,070 | 9,196 |
| WALES | 483 | 489 | 329 | 175 | 15,507 | 16,983 |
| British Transport Police | 558 | 1,358 | 362 | 129 | 4,710 | 7,117 |
| ENGLAND AND WALES | 48,929 | 65,502 | 16,207 | 8,538 | 274,287 | 413,463 |
Source: SS_16, Stop and search summary tables, Home Office
Notes:
- Excludes Vehicle only searches and searches where the ethnicity is unknown.
Table A2: Population distribution in England and Wales, by Police Force Area and ethnic group, 2011 Census population estimates
| Police Force Area | Asian | Black | Mixed | Other | White |
|---|---|---|---|---|---|
| Cleveland | 3.5% | 0.6% | 1.0% | 0.4% | 94.5% |
| Durham | 1.1% | 0.2% | 0.7% | 0.2% | 97.8% |
| Northumbria | 3.4% | 0.6% | 0.9% | 0.5% | 94.6% |
| North East Region | 2.9% | 0.5% | 0.9% | 0.4% | 95.3% |
| Cheshire | 1.6% | 0.3% | 1.0% | 0.2% | 96.9% |
| Cumbria | 0.8% | 0.1% | 0.5% | 0.1% | 98.5% |
| Greater Manchester | 10.1% | 2.8% | 2.3% | 1.0% | 83.8% |
| Lancashire | 7.9% | 0.4% | 1.1% | 0.3% | 90.4% |
| Merseyside | 2.2% | 1.1% | 1.5% | 0.7% | 94.5% |
| North West Region | 6.2% | 1.4% | 1.6% | 0.6% | 90.2% |
| Humberside | 1.8% | 0.5% | 0.9% | 0.4% | 96.5% |
| North Yorkshire | 1.8% | 0.5% | 0.9% | 0.3% | 96.6% |
| South Yorkshire | 4.8% | 1.9% | 1.5% | 1.1% | 90.6% |
| West Yorkshire | 13.1% | 2.1% | 2.2% | 0.8% | 88.8% |
| Yorkshire and the Humber Region | 7.3% | 1.5% | 1.6% | 0.8% | 88.8% |
| Derbyshire | 3.9% | 1.0% | 1.4% | 0.4% | 93.3% |
| Leicestershire | 16.1% | 2.4% | 2.0% | 1.1% | 78.4% |
| Lincolnshire | 1.0% | 0.4% | 0.9% | 0.2% | 97.6% |
| Northamptonshire | 3.7% | 2.4% | 2.0% | 0.4% | 91.5% |
| Nottinghamshire | 5.2% | 2.5% | 2.8% | 0.6% | 88.8% |
| East Midlands Region | 6.5% | 1.8% | 1.9% | 0.6% | 89.3% |
| Staffordshire | 3.6% | 0.8% | 1.3% | 0.3% | 94.1% |
| Warwickshire | 4.6% | 0.8% | 1.5% | 0.4% | 92.7% |
| West Mercia | 2.1% | 0.4% | 1.1% | 0.2% | 96.2% |
| West Midlands | 18.8% | 6.0% | 3.5% | 1.5% | 70.1% |
| West Midlands Region | 10.8% | 3.3% | 2.4% | 0.9% | 82.7% |
| Bedfordshire | 13.9% | 4.8 | 3.0% | 0.8% | 77.5% |
| Cambridgeshire | 5.9% | 1.3% | 20% | 0.6% | 90.3% |
| Essex | 2.7% | 2.0% | 1.6% | 0.4% | 93.2% |
| Hertfordshire | 6.5% | 2.8% | 2.5% | 0.6% | 87.6% |
| Norfolk | 1.5% | 0.5% | 1.2% | 0.3% | 96.5% |
| Suffolk | 1.8% | 0.9% | 1.7% | 0.3% | 95.2% |
| East of England Region | 4.8% | 2.0% | 1.9% | 0.5% | 90.8% |
| London, City of | 12.7% | 2.6% | 3.9% | 2.1% | 78.6% |
| Metropolitan Police | 18.5% | 13.3% | 5.0% | 3.4% | 59.8% |
| London Region | 18.5% | 13.3% | 5.0% | 3.4% | 59.8% |
| Hampshire | 3.6% | 0.9% | 1.6% | 0.5% | 93.3% |
| Kent | 3.5% | 1.3% | 1.6% | 0.5% | 93.1% |
| Surrey | 5.6% | 1.1% | 2.1% | 0.8% | 90.4% |
| Sussex | 3.0% | 0.9% | 1.9% | 0.5% | 93.7% |
| Thames Valley | 9.2% | 3.0% | 2.5% | 0.7% | 84.6% |
| South East Region | 5.2% | 1.6% | 1.9% | 0.6% | 90.7% |
| Avon and Somerset | 2.6% | 1.9% | 1.8% | 0.4% | 93.3% |
| Devon and Cornwall | 1.0% | 0.2% | 0.9% | 0.2% | 97.5% |
| Dorset | 1.9% | 0.4% | 1.3% | 0.3% | 96.0% |
| Gloucestershire | 2.1% | 0.9% | 1.5% | 0.2% | 95.4% |
| Wiltshire | 2.9% | 0.9% | 1.4% | 0.3% | 94.5% |
| South West Region | 2.0% | 0.9% | 1.4% | 0.3% | 95.4% |
| ENGLAND | 7.8% | 3.5% | 2.3% | 1.0% | 85.4% |
| Dyfed-Powys | 1.0% | 0.2% | 0.6% | 0.2% | 98.0% |
| Gwent | 2.0% | 0.6% | 1.0% | 0.3% | 96.1% |
| North Wales | 1.3% | 0.2% | 0.7% | 0.3% | 97.5% |
| South Wales | 3.5% | 1.0% | 1.4% | 0.8% | 93.4% |
| WALES | 2.3% | 0.6% | 1.0% | 0.5% | 95.6% |
| ENGLAND AND WALES | 7.5% | 3.3% | 2.2% | 1.0% | 86.0% |
Source: 2011 Census population estimates, ONS
Notes:
- Due to rounding percentages may not total 100%.
-
The associated legislation includes stop and search powers under section 47 of the Firearms Act 1968, section 23 of the Misuse of Drugs Act 1971, section 43 of the Terrorism Act 2000 as well as other legislation. ↩
-
Includes searches under section 1 PACE, section 60 of the Criminal Justice and Public Order Act 1994 and section 47A of the Terrorism Act 2000 (though this power was not used in the year ending March 2022). ↩
-
Based on the resident population of the Police Force Area. Calculated using the mid-2021 population estimates for England and Wales, published by ONS. ↩
-
Asian or Asian British group now includes people that identify as Chinese. Previously people who identify as Chinese were grouped as ‘Chinese or Other’. Details on groupings are available at List of ethnic groups. ↩
-
Population data from the 2011 Census, based on whole population. ↩
-
For more information on the Metropolitan Police’s stop and search rates at borough level, see stop and search dashboard.. ↩
-
The 23 forces included in the analysis are Cambridgeshire, Cheshire, Cumbria, Derbyshire, Dorset, Durham, Essex, Gloucestershire, Greater Manchester, Kent, Leicestershire, Lincolnshire, Merseyside, Norfolk, North Yorkshire, Northamptonshire, Northumbria, Suffolk, Surrey, Sussex, West Midlands, West Yorkshire and Wiltshire. ↩
-
A Notifiable Offence is any offence where the police must inform the Home Office by completing a crime report form for statistical purposes. Notifiable offences cover all crimes that must or could be heard at a Crown Court and, except for common assaults, excludes summary only offences that are dealt with exclusively by magistrates’ courts. There are strict rules regarding the recording of crime which is outlined in the Home Office counting rules for recorded crime. ↩
-
Calculated using 2021 Census estimates for England and Wales. Where ethnic breakdowns are provided, rates have been calculated using 2011 Census estimates. ↩
-
City of London Police Force Area has been excluded from this analysis, as the small resident population and large transient population within means that rates can be misleading. ↩