Non-domestic rating: stock of properties including business floorspace statistical commentary
Published 25 May 2023

© Crown copyright 2023
This publication is licensed under the terms of the Open Government Licence v3.0 except where otherwise stated. To view this licence, visit nationalarchives.gov.uk/doc/open-government-licence/version/3 or write to the Information Policy Team, The National Archives, Kew, London TW9 4DU, or email: psi@nationalarchives.gov.uk.
Where we have identified any third party copyright information you will need to obtain permission from the copyright holders concerned.
This publication is available at https://www.gov.uk/government/statistics/non-domestic-rating-stock-of-properties-including-business-floorspace-2023/non-domestic-rating-stock-of-properties-including-business-floorspace-statistical-commentary
This release contains statistics relating to stock of non-domestic properties including business floorspace for England and Wales at 31 March 2023. The statistics provide information on the number and value of the stock of rateable properties (known as “hereditaments”), broken down by sector, geographic location, property type and rateable value band. Also provided is the floorspace and rateable value per metre squared, where applicable, broken down by sector and geographic location.
This is the final non-domestic rating stock of properties including business floorspace statistical release for the 2017 rating list. Future stock of properties publications will report on the 2023 rating list, which was published on 1 April 2023. On 3 April 2023, the 2023 Revaluation statistical publication was released, showing the changes in the rateable value of non-domestic properties as a result of the 2023 revaluation, to reflect changes in the property market since the previous revaluation in 2017.
Responsible Statistician
Anna McReady
Statistical enquiries
Date of next publication
Spring 2024
1. Headline figures
1.1 Properties in England and Wales on the Local Rating List at 31 March 2023:
The stock of properties at 31 March 2023 was
2.15 million
Up from 2.14 million at 31 March 2022
The total rateable value of the properties at 31 March 2023 was
£65.9 billion
Down from £66.0 billion at 31 March 2022
The total floorspace of the properties at 31 March 2023 was
581.5 million metres squared
Up from 580.8 million metres squared at 31 March 2022
The overall rateable value per metre squared of the properties at 31 March 2023 was
£86
No change from £86 at 31 March 2022
2. The Central Rating List in England and Wales
Rates from central rating list rateable properties in England are paid directly to the Department of Levelling Up, Housing and Communities (DLUHC), and in Wales are paid to the Welsh Government.
- the total rateable value of properties on the central list at 31 March 2023 was £3.7 billion
- the properties in England accounted for £3.5 billion (95%) of this total and in Wales accounted for the remaining £0.2 billion (5%)
The total rateable value of the central list reported in this publication is not directly comparable with the 2017 central list figures reported in the 2023 Revaluation statistical release published in April 2023.
The 2023 Revaluation statistical release aims to compare rateable values of properties which were valued on both the 2017 and 2023 rating lists. As some properties moved from local rating lists to the central lists at the recent revaluation, the value of those properties was added to the total rateable value for the 2017 central list, so comparisons could be made between the 2017 and 2023 central lists. For this reason, the central rating list figures in this publication should not be compared with figures in the 2023 Revaluation statistical release. To compare the 2017 and 2023 central rating lists please use the 2023 Revaluation statistical publication.
The remainder of this statistical commentary refers to the local rating list.
3. Time series of the stock of Properties in England and Wales
The following section shows the changes to property counts and total rateable value (RV) over time. Each time series covers four distinct Rating Lists (2000, 2005, 2010 and 2017) and shows data at 31 March for each year.
Figure 1: Number of rateable properties in England and Wales
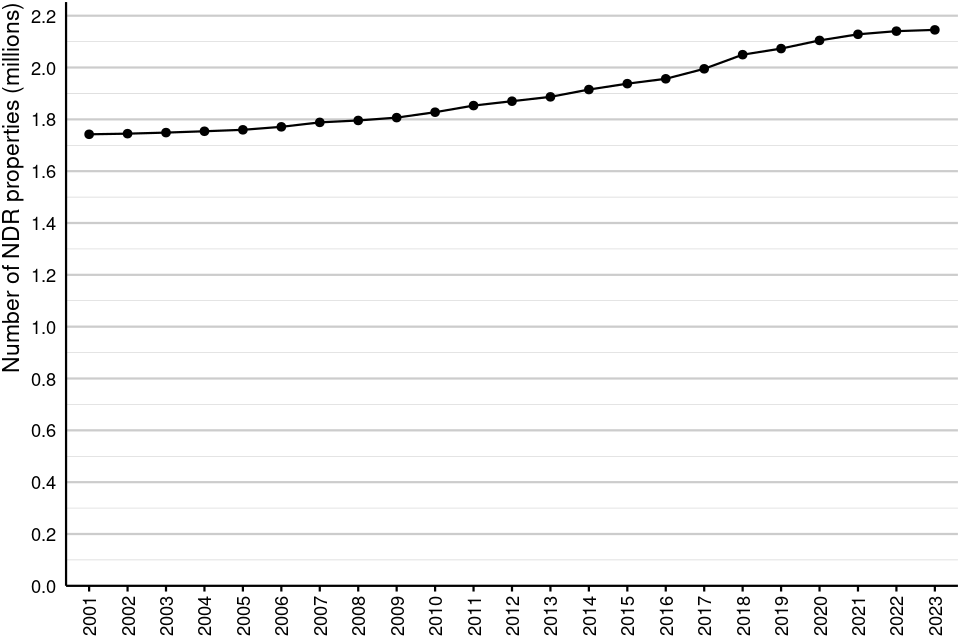
Source: NDR Stock of Properties (Table 3.1)
Figure 1 shows the total number of properties in England and Wales at 31 March of each year from 2001 to 2023. The number of properties has been steadily increasing since 31 March 2001; at 31 March 2023 it had increased from 1.74 million to 2.15 million (an increase of 23%). Between 1 April 2022 and 31 March 2023, the number increased from 2.14 million by 4,930 (less than 1%).
Figure 2: Total rateable value in England and Wales
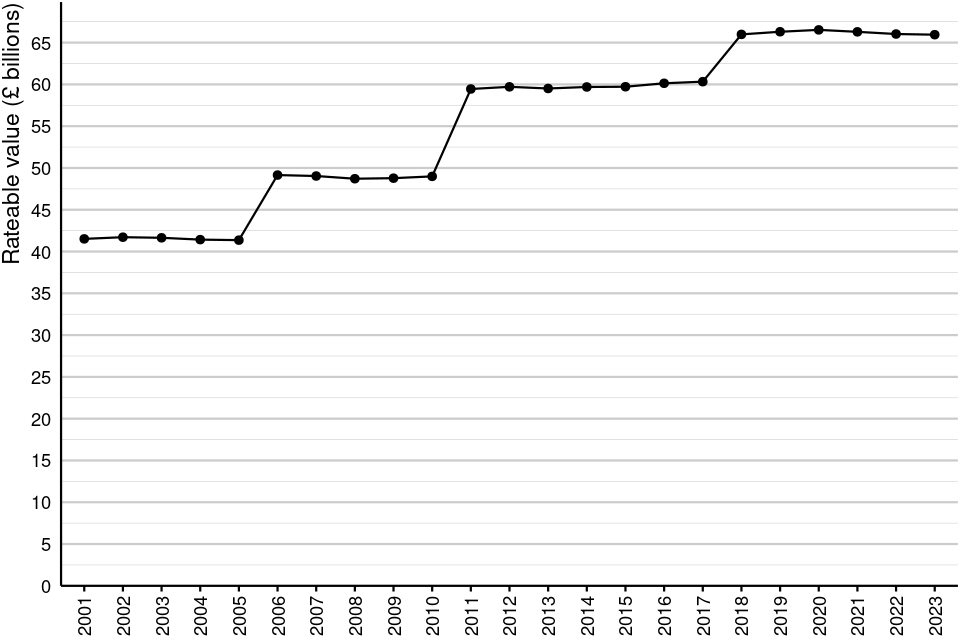
Source: NDR Stock of Properties (Table 3.2)
Figure 2 shows total RV in England and Wales at 31 March of each year from 2001 to 2023. Each sharp increase in total RV coincides with the end of a revaluation cycle and the introduction of a new Rating List. Since 31 March 2018 (the first full year of the 2017 Rating List), total RV has decreased from £66.0 billion by £35.9 million (less than 0.1%). Between 1 April 2022 and 31 March 2023, RV decreased from £66.0 billion by £80.3 million (less than 1%).
3.1 Distribution by sector
‘Sector’ consists of the following categories: Retail, Industrial and Office (RIO), which is a categorisation commonly used by those in the surveying profession. VOA statisticians have, in conjunction with operational colleagues, mapped each SCat code to one of the three categories. The ‘Other’ category was created to cover SCat codes which could not be readily assigned to ‘Retail’, ‘Office’ or ‘Industry’. This includes Assembly and Leisure, Education, Health, Hotels, and Utilities – for more details see Figure 9.
Further detail on sector composition is available in the Background Information document and Metadata files.
Figure 3: Number of rateable properties by sector in England and Wales
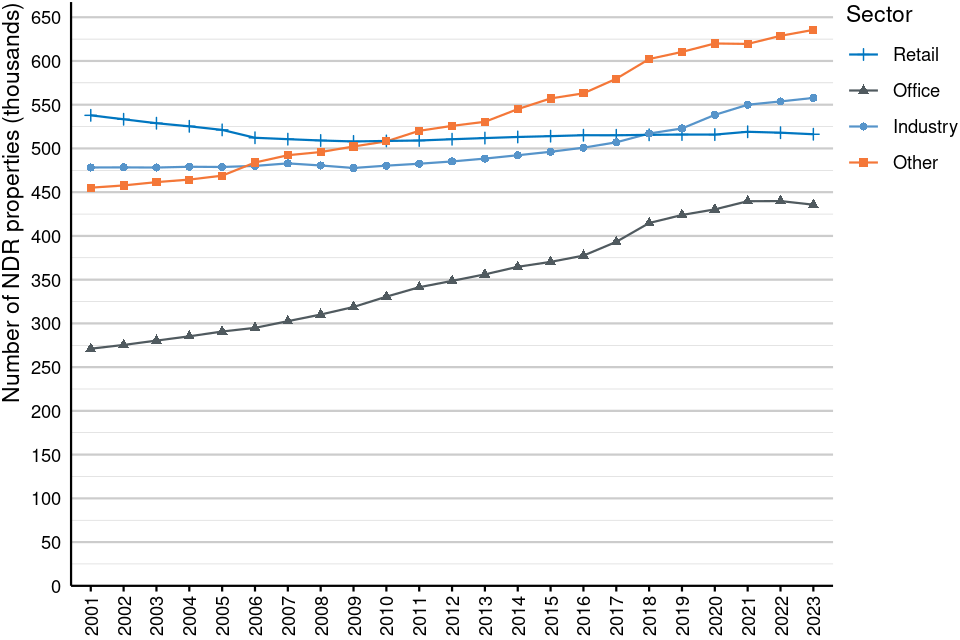
Source: NDR Stock of Properties (Tables 4.1, 5.1, 6.1 & 7.1)
Figure 3 shows the total number of properties in each sector in England and Wales at 31 March of each year from 2001 to 2023.
Since 31 March 2001:
- the number of properties in the Retail sector has decreased by 4%, from 537,840 to 516,240
- the Office sector has increased by 61%, from 271,090 to 435,700 properties
- the Industry sector has increased by 17%, from 478,240 to 557,780
- the Other sector has increased by 40%, from 455,140 to 635,550
In the latest financial year (1 April 2022 to 31 March 2023):
- the number of properties in the Retail sector has decreased by 1,760 (less than 1%)
- the Office sector has decreased by 4,140 (1%)
- the Industry sector has increased by 4,030 (1%)
- the Other sector has increased by 6,800 (1%)
Figure 4: Total rateable value by sector in England and Wales
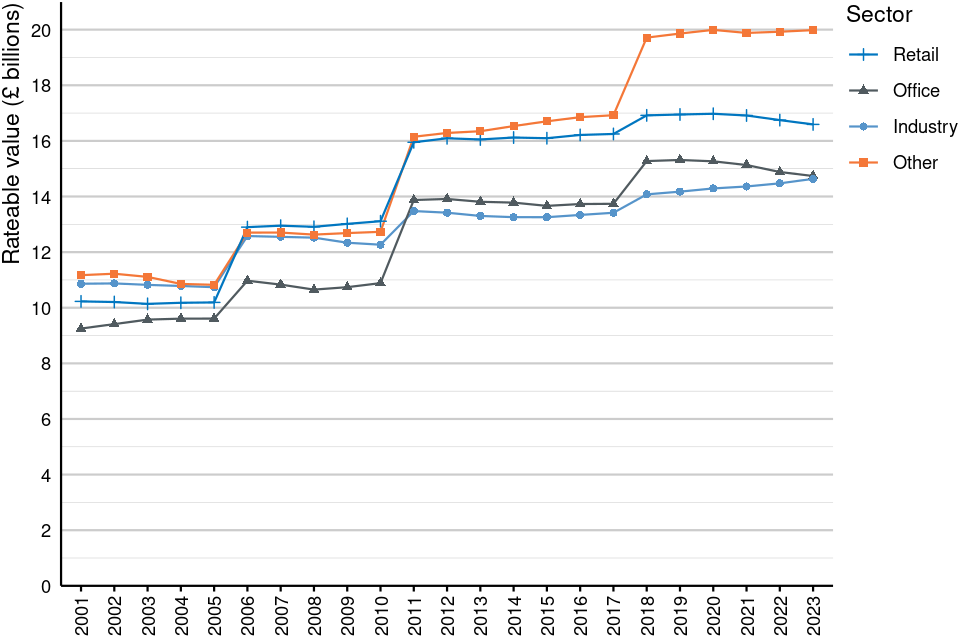
Source: NDR Stock of Properties (Tables 4.2, 5.2, 6.2 & 7.2)
Figure 4 shows total RV in each sector in England and Wales at 31 March of each year from 2001 to 2023. Each sharp increase coincides with the end of a revaluation cycle and the introduction of a new Rating List. Since 31 March 2018 (the first full year of the 2017 Rating List):
- the total RV for the Retail sector has decreased by 2%, from £16.9 to £16.6 billion
- the Office sector has decreased by 4%, from £15.3 to £14.7 billion
- the Industry sector has increased by 4%, from £14.1 to £14.6 billion
- the Other sector has increased by 1%, from £19.7 to £20.0 billion
In the latest financial year (1 April 2022 to 31 March 2023):
- the total RV for the Retail sector has decreased by £155 million (1%)
- the Office sector has decreased by £145 million (1%)
- the Industry sector has increased by £162 million (1%)
- the Other sector has increased by £58 million (less than 1%)
4. The Stock of Properties in England and Wales at 31 March 2023
The following section shows a more detailed view of property counts and total RV at 31 March 2023.
4.1 Distribution by sector
Figure 5: Number of rateable properties by sector in England and Wales
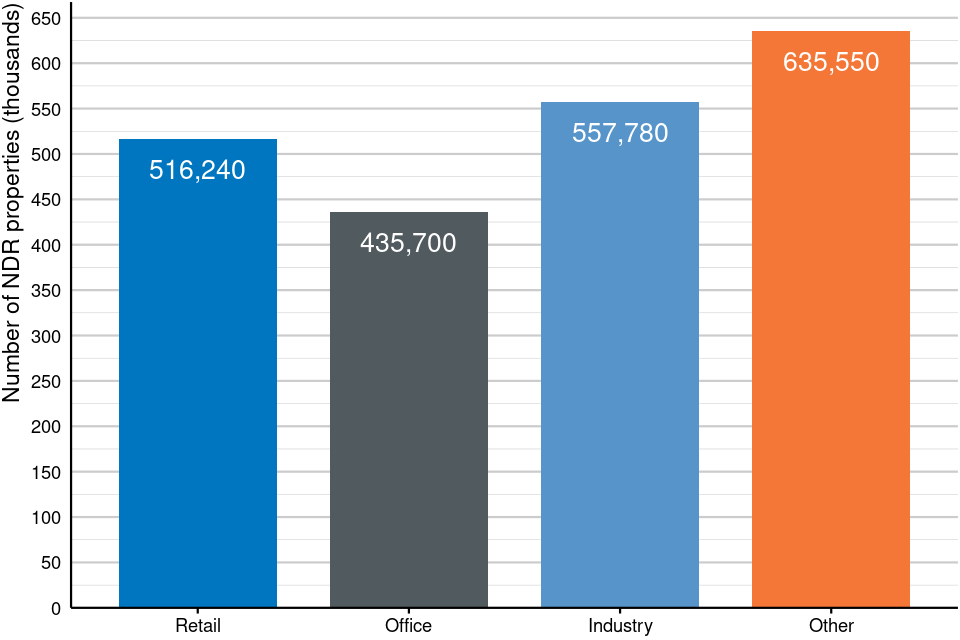
Source: NDR Stock of Properties (Tables 4.1, 5.1, 6.1 & 7.1)
Figure note: Counts are rounded to the nearest 10
Figure 5 shows property counts by sector at 31 March 2023. The Other sector had the highest count with 636 thousand properties (30% of the total properties). The Office sector had the lowest count with 436 thousand properties (20%).
Figure 6: Total rateable value by sector in England and Wales
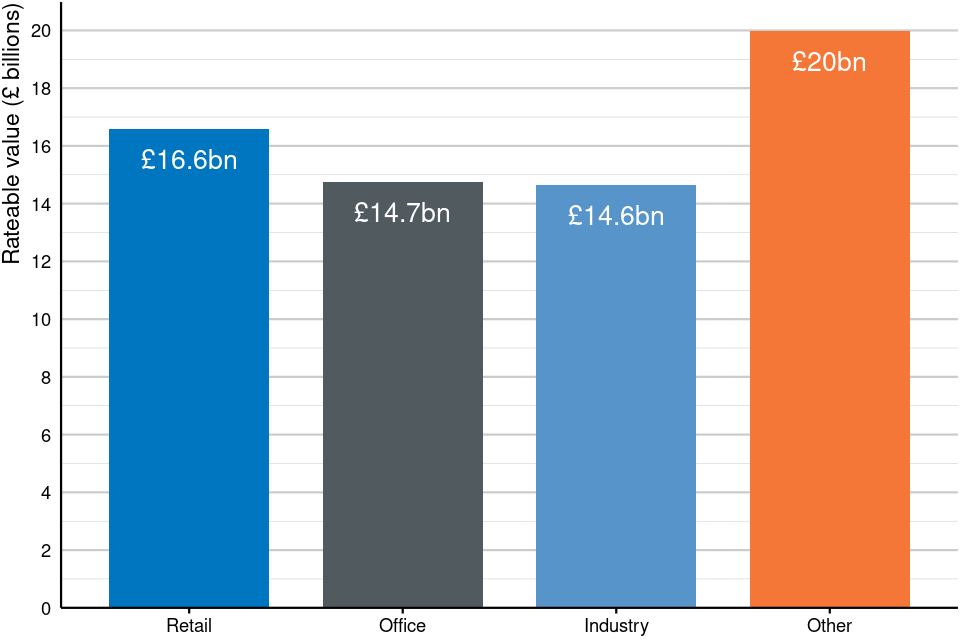
Source: NDR Stock of Properties (Tables 4.2, 5.2, 6.2 & 7.2)
Figure note: RV totals are rounded to the nearest £100 million
Figure 6 shows total RV by sector at 31 March 2023. The Other sector had the highest total RV with £20.0 billion (30% of the overall total RV). The Industry sector had the lowest total RV with £14.6 billion (22%).
4.2 Distribution by region
Figure 7: Number of rateable properties by region and sector
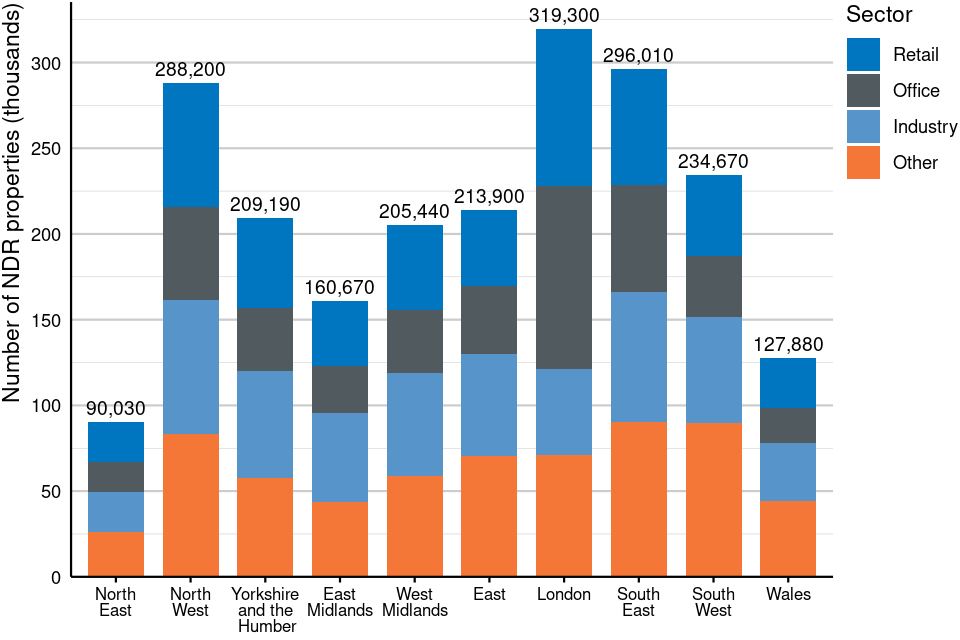
Source: NDR Stock of Properties (Tables 4.1, 5.1, 6.1 & 7.1)
Figure note: Counts are rounded to the nearest 10
Figure 7 shows property counts by region and sector at 31 March 2023. London had the highest count with 319 thousand properties (15% of the total properties). The North East had the lowest count with 90 thousand properties (4%).
Figure 8: Total rateable value by region and sector
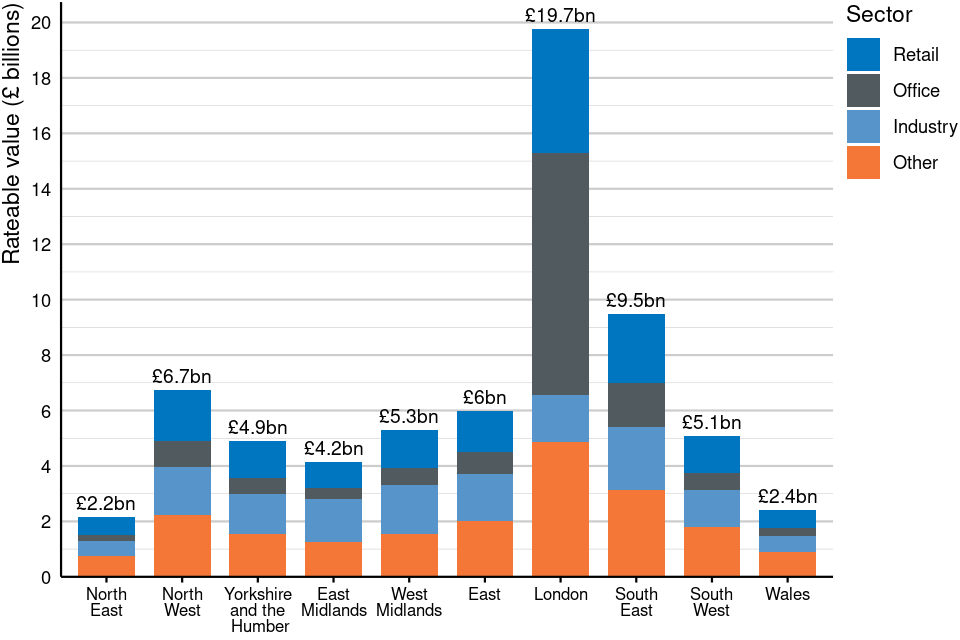
Source: NDR Stock of Properties (Tables 4.2, 5.2, 6.2 & 7.2)
Figure note: RV totals are rounded to the nearest £100 million
Figure 8 shows total RV by region and sector at 31 March 2023. London had the highest total RV with £19.7 billion (30% of the overall total RV). The North East had the lowest total RV with £2.2 billion (3%).
4.3 Distribution by rateable value band
Distributions by rateable value band are presented as tables rather than charts as the band ranges are not consistent sizes, therefore totals should not be compared directly.
Table 1: Number of rateable properties by rateable value band and sector
| Rateable value band | Retail | Office | Industry | Other | Total |
|---|---|---|---|---|---|
| £0-5.9k | 167,410 | 211,430 | 241,250 | 326,030 | 946,120 |
| £6-11.9k | 151,960 | 88,440 | 128,810 | 103,140 | 472,330 |
| £12-14.9k | 38,510 | 21,660 | 31,470 | 30,540 | 122,190 |
| £15-50.9k | 109,700 | 72,010 | 107,090 | 106,450 | 395,240 |
| £51k+ | 48,670 | 42,160 | 49,160 | 69,400 | 209,390 |
Source: NDR Stock of Properties (Table 2.1)
Table notes: Counts are rounded to the nearest 10. Totals may not sum due to rounding.
Table 1 shows property counts by RV band in England and Wales at 31 March 2023. There were 1.4 million properties (66% of the total properties) with an RV of less than £12,000. A further 122 thousand properties (6%) had an RV of £12,000 to £14,999. Properties with an RV of at least £15,000 accounted for 28% of all properties.
Table 2: Total rateable value by rateable value band and sector
| Rateable Value Band | Retail (£m) | Office (£m) | Industry (£m) | Other (£m) | Total (£bn) |
|---|---|---|---|---|---|
| £0-5.9k | 629 | 587 | 676 | 755 | 2.6 |
| £6-11.9k | 1,296 | 754 | 1,099 | 866 | 4.0 |
| £12-14.9k | 510 | 287 | 417 | 402 | 1.6 |
| £15-50.9k | 2,861 | 1,938 | 2,892 | 2,924 | 10.6 |
| £51k+ | 11,295 | 11,171 | 9,551 | 15,037 | 47.1 |
Source: NDR Stock of Properties (Table 2.1)
Table notes: Sector figures are rounded to the nearest £1 million. RV band totals are rounded to the nearest £100 million. Totals may not sum due to rounding.
Table 2 shows total RV by RV band in England and Wales at 31 March 2023. Properties with an RV of under £15,000 had a total RV of £8.3 billion, accounting for 13% of the overall total. Only 6,440 (less than 1%) of properties in England and Wales had an RV of at least £1 million, however, their total RV adds up to £15.0 billion (23% of the overall total).
4.4 Distribution by sub-sector
Figure 9: Number of rateable properties by sector and sub-sector in England and Wales
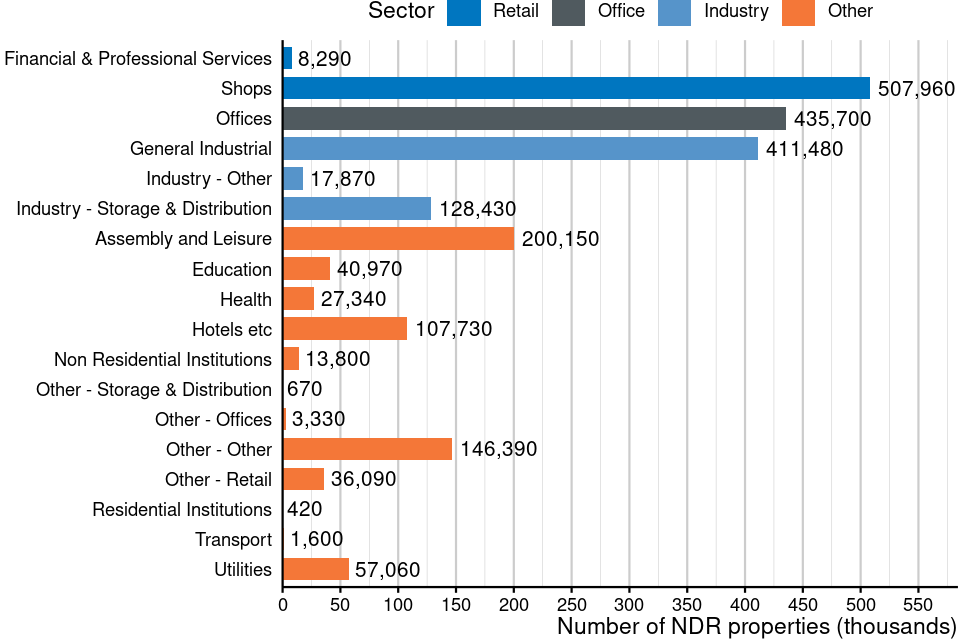
Source: Stock SCat, 2023 (Table 1.1)
Figure note: Counts are rounded to the nearest 10
Figure 9 shows property counts by sub-sector in England and Wales at 31 March 2023. The sub-sector with the most properties was Shops with 507,960. The sub-sector with the fewest properties was Residential Institutions with 420.
Figure 10: Total rateable value by sector and sub-sector in England and Wales
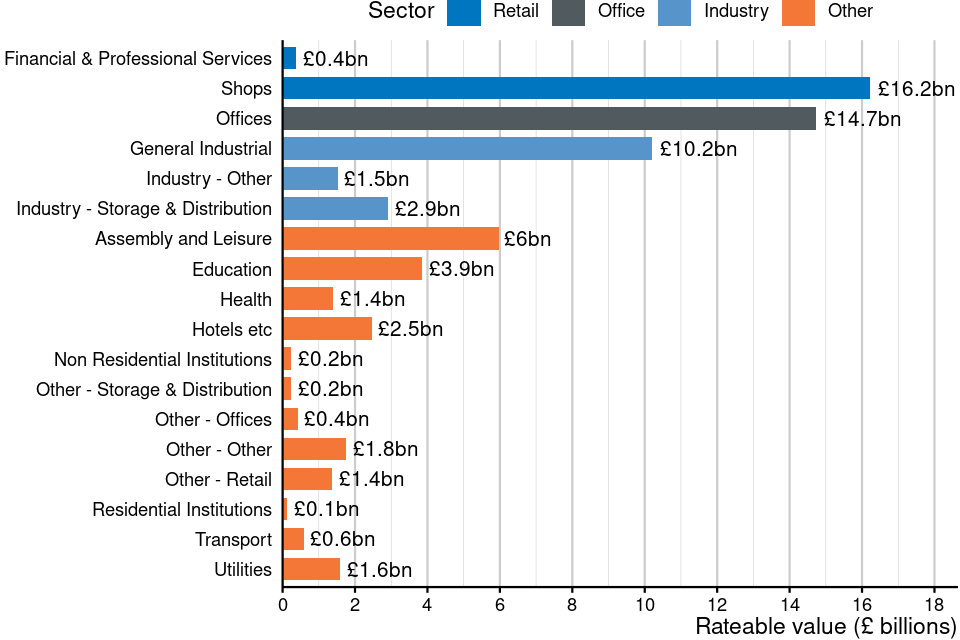
Source: Stock SCat, 2023 (Table 1.1)
Figure note: RV totals are rounded to the nearest £100 million
Figure 10 shows total RV by sub-sector in England and Wales at 31 March 2023. The sub-sector with the highest RV was Shops with £16.2 billion. The sub-sector with the lowest RV was Residential Institutions with £119.1 million.
5. Time series of Business Floorspace in England and Wales
The following section shows the changes to business floorspace, RV per metre squared, the number of properties without a floorspace and their associated RV over time. Each time series covers four distinct Rating Lists: 2000, 2005, 2010 and 2017 and shows data at 31 March for each year.
Floorspace is defined as the internal area in metres squared used to calculate a property’s rateable value. In most instances, this will not include communal areas such as kitchens and facilities such as toilets. Not all property types are given a rateable value based upon their floorspace. Only properties valued using their internal floor area are included in total floorspace counts and RV per metre squared. More information on which special categories are excluded from floorspace and rateable value per metre squared counts can be found in the Metadata files.
In England and Wales at 31 March 2023, rounded to the nearest 10:
- a total of 1,703,330 properties across 158 SCat codes were included in the 2023 floorspace counts and RV per metre squared; this accounts for around 79% of all properties on the NDR Rating List
- 515,190 of these properties with floorspace were in the Retail sector (almost 100% of all Retail sector properties)
- 435,700 properties were in the Office sector (100%)
- 552,370 properties were in the Industry sector (99%)
- 200,080 properties were in the Other sector (31%)
5.1 Floorspace
Figure 11: Total floorspace in England and Wales
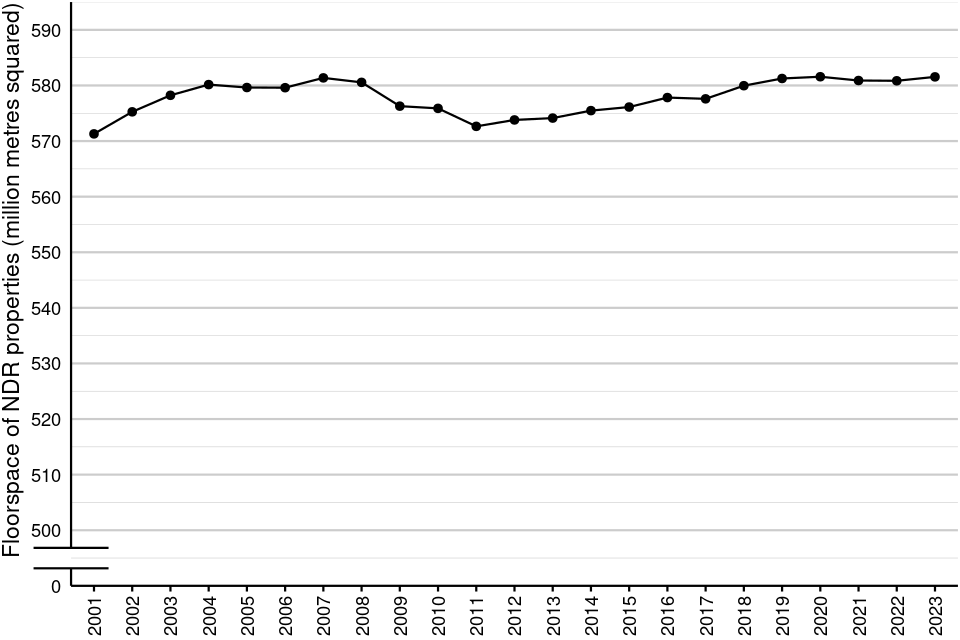
Source: NDR Business Floorspace, 2023 (Table 1.1)
Figure note: The y-axis has been zoomed in so that the trend over time is visible
Figure 11 shows the total floorspace in England and Wales at 31 March of each year from 2001 to 2023. Total floorspace increased from 571.3 million metres squared in 2001 to 581.4 million in 2007, but between 2008 and 2011 total floorspace decreased by 8.7 million metres squared (1%); this reflects the effects of the global financial crisis that happened in 2007 to 2008. From 2011, floorspace has been steadily increasing again, and was 581.5 million metres squared at 31 March 2023.
Figure 12: Total floorspace by sector in England and Wales
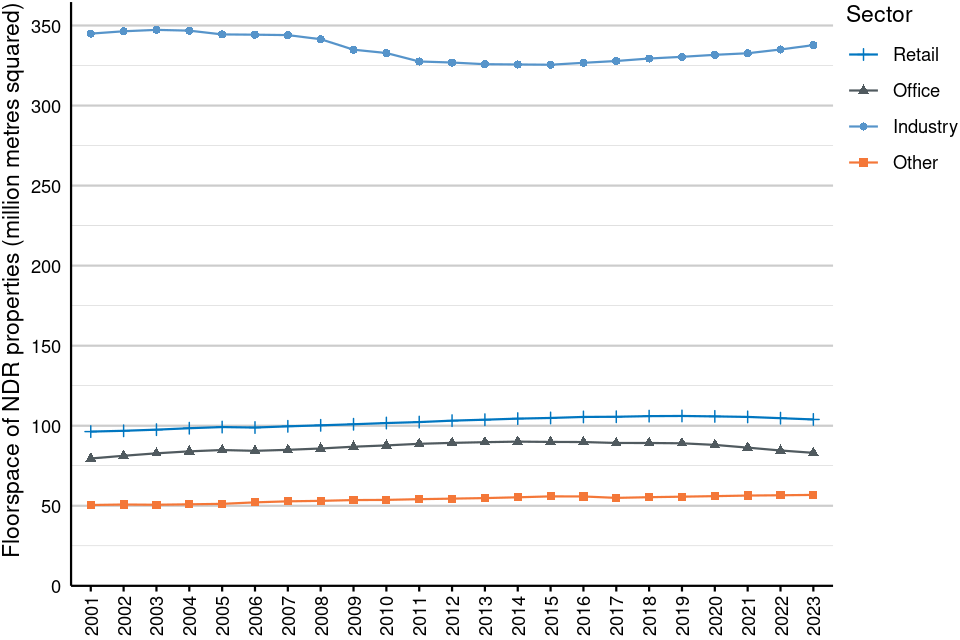
Source: NDR Business Floorspace, 2023 (Tables 2.1, 3.1, 4.1 & 5.1)
Figure 12 shows the total floorspace of each sector in England and Wales at 31 March of each year from 2001 to 2023. The decrease in floorspace from 2008 to 2011 (figure 11) is only reflected in the Industry sector, which saw a reduction in floorspace in the 3 years following the global financial crisis, while all other sectors saw less fluctuation in this time. The Office sector saw a reduction in floorspace from 2020 following the covid-19 pandemic, whilst the Industry sector saw an increase in floorspace in the same period. Changes in the Retail and Other sector are less notable.
Overall, in the 22 year period since 31 March 2001:
- the total floorspace of the Retail sector has increased by 8%, from 96.3 to 103.9 million metres squared
- the Office sector has increased by 4%, from 79.5 to 83.1 million metres squared
- the Industry sector has decreased by 2%, from 344.9 to 337.8 million metres squared
- the Other sector has increased by 12%, from 50.5 to 56.8 million metres squared
In the latest financial year (1 April 2022 to 31 March 2023):
- the total floorspace of the Retail sector has decreased by 793,090 metres squared (1%)
- the Office sector has decreased by 1,464,320 metres squared (2%)
- the Industry sector has increased by 2,739,530 metres squared (1%)
- the Other sector has increased by 221,250 metres squared (less than 1%)
5.2 Rateable value per metre squared
Figure 13: Rateable value per metre squared in England and Wales
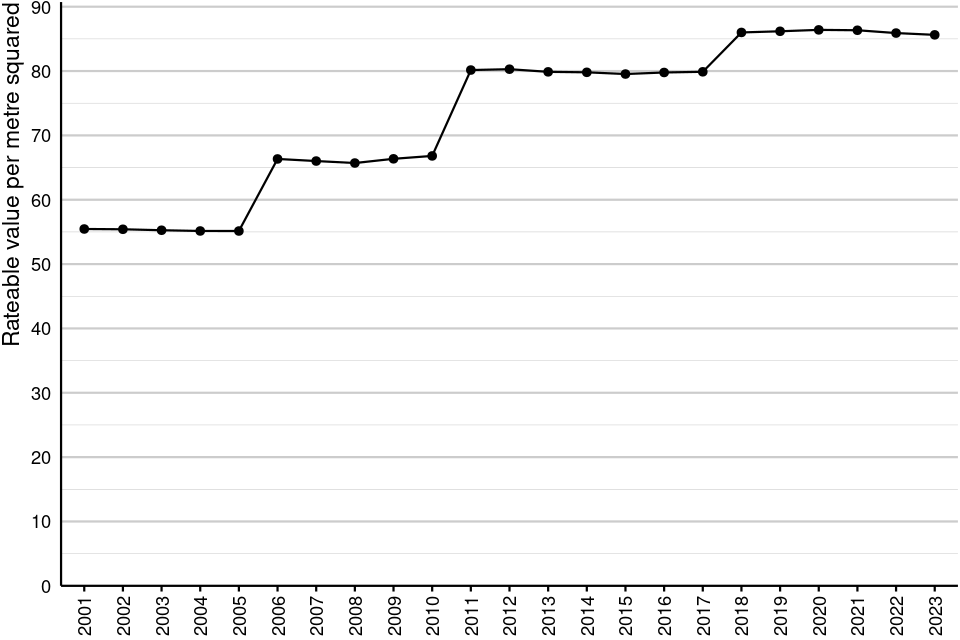
Source: NDR Business Floorspace, 2023 (Table 1.2)
Figure 13 shows the RV per metre squared in England and Wales at 31 March of each year from 2001 to 2023. Each sharp increase results from the end of a revaluation cycle and the introduction of a new Rating List. Since 31 March 2018 (the first year of the 2017 Rating List), total RV has remained constant at £86.
Figure 14: Rateable value per metre squared by sector in England and Wales
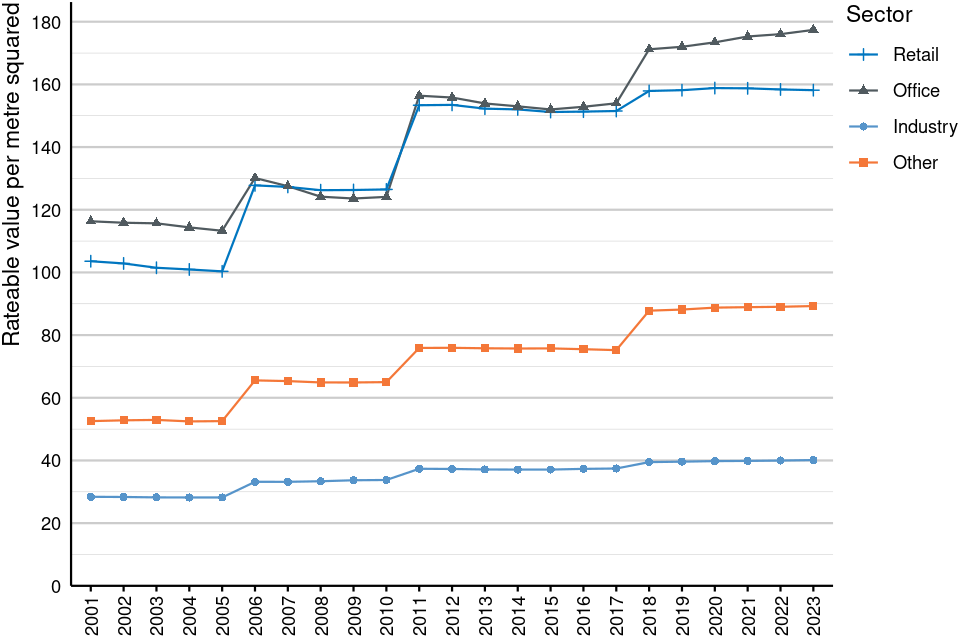
Source: NDR Business Floorspace, 2023 (Tables 2.2, 3.2, 4.2 & 5.2)
Figure 14 shows the RV per metre squared of each sector in England and Wales at 31 March of each year from 2001 to 2023. As in figure 13, each sharp increase results from the end of a revaluation cycle and the introduction of a new Rating List. Since 31 March 2018 (the first year of the 2017 Rating List):
- the RV per metre squared of the Retail sector has increased by less than 1%; it was £158 in both 2018 and 2023
- the Office sector has increased by 4%, from £171 to £177
- the Industry sector has increased by 2%, from £39 to £40
- the Other sector has increased by 2%, from £88 to £89
In the latest financial year (1 April 2022 to 31 March 2023):
- the RV per metre squared of the Retail sector did not change from £158
- the Office sector increased from £176 to £177
- the Industry sector did not change from £40
- the Other sector did not change from £89
5.3 Properties excluded from floorspace statistics
This section describes properties which are not valued using their internal floor area, for example, Hotels. More information on which special categories are excluded from floorspace and rateable value per metre squared counts can be found in the Metadata files.
Figure 15: Number of rateable properties excluded from floorspace statistics in England and Wales
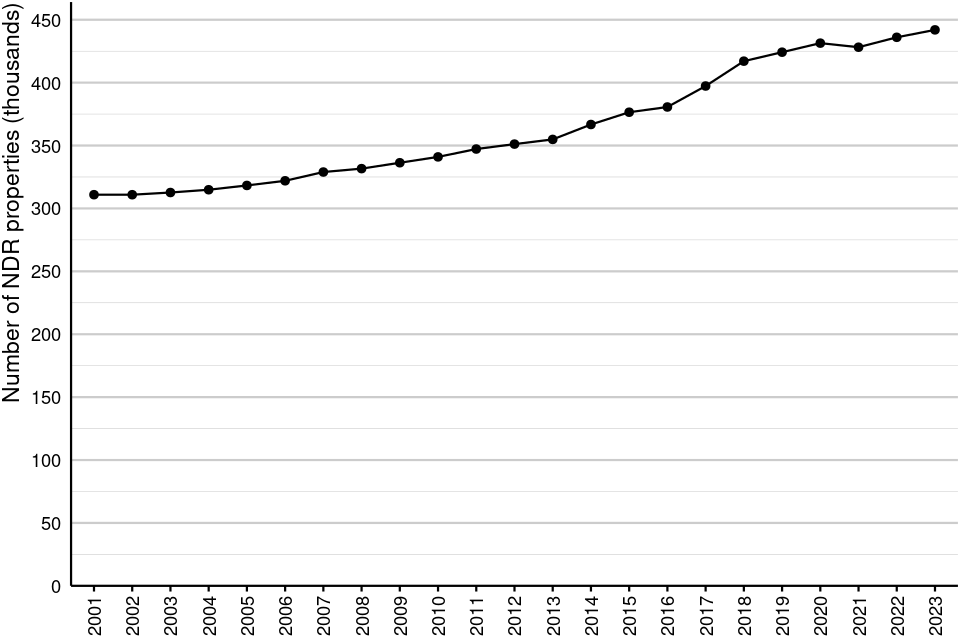
Source: NDR Business Floorspace, 2023 (Table 6.1)
Figure 15 shows the total number of properties excluded from floorspace statistics in England and Wales at 31 March of each year from 2001 to 2023. Over that time, the number of properties without a floorspace has increased by 42%, from 311 thousand to 442 thousand. Between 1 April 2022 and 31 March 2023, the number increased from 436 thousand by 1%. At 31 March 2023, properties without a floorspace accounted for 21% of the total properties.
Figure 16: Total rateable value of properties excluded from floorspace statistics in England and Wales
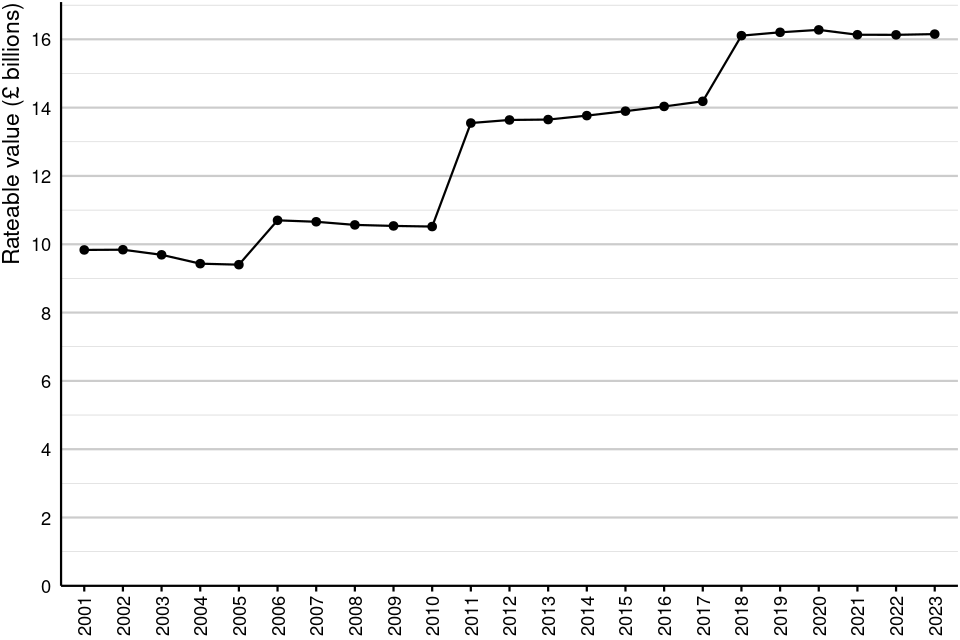
Source: NDR Business Floorspace, 2023 (Table 6.2)
Figure 16 shows the total RV of properties excluded from floorspace statistics in England and Wales at 31 March of each year from 2001 to 2023. Each sharp increase in total RV results from the end of a revaluation cycle and the introduction of a new Rating List. Since 31 March 2018 (the first year of the 2017 Rating List), the total RV of properties without a floorspace has increased by less than 1%, from 16.1 billion to 16.2 billion. At 31 March 2023, the RV of properties without a floorspace accounted for 24% of the total RV.
6. Further Information
More information about this release can be found in the Background Information document
Further information on the area codes used in this can be found on the ONS website
More information on statistics at the VOA can be found on the Agency’s website: About VOA statistics
Timings of future releases are regularly placed on the VOA research and statistics calendar
We will keep the format of this document under review to continue improving the presentation of our statistics, and welcome feedback from users on the value of the information provided in this commentary – please forward any comments to the Statistics Inbox