Response times to fires attended by fire and rescue services, England, April 2019 to March 2020
Updated 18 June 2021
Applies to England

© Crown copyright 2021
This publication is licensed under the terms of the Open Government Licence v3.0 except where otherwise stated. To view this licence, visit nationalarchives.gov.uk/doc/open-government-licence/version/3 or write to the Information Policy Team, The National Archives, Kew, London TW9 4DU, or email: psi@nationalarchives.gov.uk.
Where we have identified any third party copyright information you will need to obtain permission from the copyright holders concerned.
This publication is available at https://www.gov.uk/government/statistics/response-times-to-fires-attended-by-fire-and-rescue-services-england-april-2019-to-march-2020/response-times-to-fires-attended-by-fire-and-rescue-services-england-april-2019-to-march-2020
Frequency of release: Annual
Forthcoming releases: Home Office statistics release calendar
Home Office responsible statistician: Deborah Lader
Press enquiries: pressoffice@homeoffice.gov.uk
0300 123 3535
Public enquiries: firestatistics@homeoffice.gov.uk
This release presents statistics on the average response times to fire incidents in the financial year 2019/20 (1 April 2019 to 31 March 2020) for fire and rescue services (FRSs) in England.
Key results
The average total response time to primary fires in England in 2019/20 was 8 minutes and 43 seconds: a decrease of six seconds since 2018/19. Total response time to secondary fires in 2019/20 decreased by 24 seconds to 9 minutes 18 seconds compared with 2018/19. Response times have generally increased over the past decade.
The average response times to primary fires attended by FRSs during the COVID-19 lockdown showed two phases:
In 5 of the first 8 weeks of lockdown, response times were below the expected range based on 2015-19 data.
In 2 of the next 6 weeks of lockdown, response times were above the expected range based on 2015-19 data.
In half of the weeks of lockdown, response times were within the expected range based on 2015-2019 data.
1. Total response times
This chapter details changes in average total response times to fires in England from 2009/10 to 2019/20, as well as by type of Fire and Rescue Authority (FRA, rural/urban and metropolitan/non-metropolitan classifications).
Total response time is the minutes and seconds elapsed from the time of call to the arrival of the first vehicle to the incident.
Key results
-
The average total response time to primary fires (potentially more serious fires that harm people or cause damage to property)[footnote 1] in England in 2019/20 was 8 minutes and 43 seconds: a decrease of six seconds since 2018/19 but an increase of six seconds from five years previously in 2014/15.
-
Three types of primary fires showed a decrease in average response times in 2019/20 (dwellings by two seconds, road vehicles by three seconds and other outdoor[footnote 2] fires by 28 seconds), while the response time to other building fires increased by two seconds compared with 2018/19.
-
Average total response time to secondary fires in 2019/20 (which can broadly be thought of as smaller outdoor fires, not involving people or property) decreased by 24 seconds to 9 minutes 18 seconds compared with 2018/19, driven by the exceptionally high number of secondary fires in July 2018.
1.1 Total response times by type of fire attended
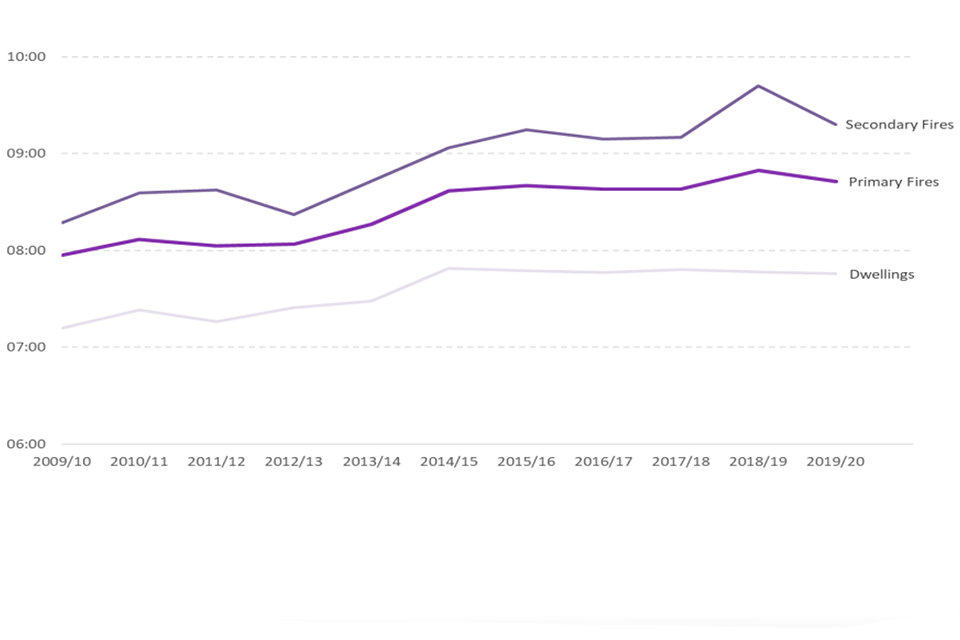
Overall, response times to fires have increased gradually over the past 20 years. There was a general plateau from 2014/15 to 2017/18 but following increases in 2018/19 the 2019/20 responses times have generally decreased (see Figure 1.1). The average total response time to primary fires in 2019/20 was 8 minutes and 43 seconds, an increase of 46 seconds over the past decade.
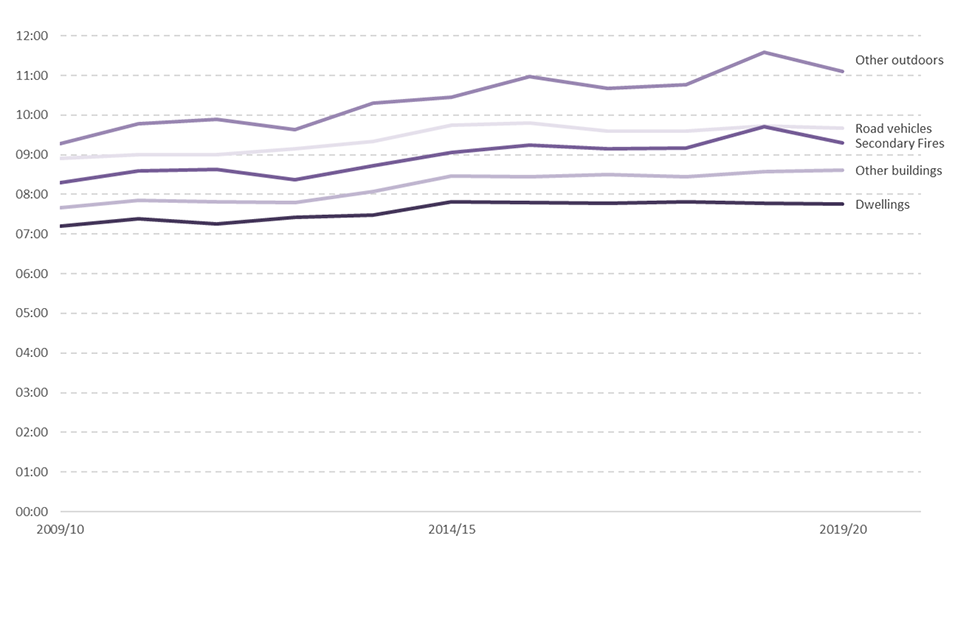
Whilst response times to all primary fires increased by 46 seconds over the past decade and decreased by six seconds in the past five years, the pattern across different types of fire was varied (see Table 1.1).
The average response time to dwelling fires in 2019/20 was 7 minutes 45 seconds. Of these, the average response time to fires in flats was 7 minutes 0 seconds, compared with 8 minutes 13 seconds for houses/bungalows and 7 minutes 44 seconds for other dwellings. This probably reflects that most flats (70% of those included in the analysis for 2019/20) are in ‘predominantly urban’ locations (see Response times by type of fire and rescue authority) and therefore generally within closer proximity to a fire station than rural dwellings.
Figure 1.1: Average total response times (minutes) by type of fire, England; 2009/10 to 2019/20
Source: FIRE1001
Notes: See the definitions document for details on data prior to 2009/10.
Table 1.1: Response times to fires by type of fire with a summary of trends, England; 2019/20
| Type of Fire | 2019/20 | Change since 2018/19 | Change since 2014/15 | Change since 2009/10 |
|---|---|---|---|---|
| Primary Fires | 8m 43s | -6 seconds | +6 seconds | +46 seconds |
| Dwelling Fires | 7m 45s | -2 seconds | -4 seconds | +33 seconds |
| Other Building Fires | 8m 37s | +2 seconds | +9 seconds | +57 seconds |
| Road Vehicle Fires | 9m 40s | -3 seconds | -5 seconds | +46 seconds |
| Other Outdoor Fires | 11m 06s | -28 seconds | +39 seconds | +109 seconds |
| Secondary Fires | 9m 18s | -24 seconds | +15 seconds | +61 seconds |
Source: FIRE1001
The average response time to other building fires in 2019/20 was 8 minutes 37 seconds. Of these, the average response time to fires in other residential buildings (such as student halls of residence, nursing/care homes and hotels) was 8 minutes 7 seconds, compared with 8 minutes 41 seconds for non-residential buildings. This could reflect local prioritisation and the greater risk to lives.
The average response time to outdoor primary fires (11 minutes 6 seconds) and secondary fires (9 minutes 18 seconds) both decreased in the last year (by 28 seconds and 24 respectively). These decreases follow larger increases (48 seconds and 32 seconds respectively) in 2018/19 which reflected increased response times in the hot summer of 2018 when there was a large number of outdoor fires. This is fully explained in Response times to fires attended by fire and rescue services: England, April 2018 to March 2019. Over the past ten years these two measures have gradually increased, although as both are influenced by the weather, they are prone to fluctuations.
It should be noted that other outdoor fires are numerically the smallest of the main primary fire types and so are more prone to larger fluctuations (of both increases and decreases) as can be seen throughout the time series (Figure 1.1).
1.2 Total response times by type of fire and rescue authority (FRA)
Of the 45 fire and rescue authorities (FRAs), 26 showed a decrease in average total response time to primary fires between 2018/19 and 2019/20, 18 showed an increase and one showed no change. (Source: FIRE1001)
FRAs can be split into three rural-urban classifications (predominantly rural, significantly rural and predominantly urban)[footnote 3] and by whether they are metropolitan or non-metropolitan[footnote 4].
Table 1.2: Response times to primary fires by type of FRA with a summary of trends, England; 2019/20
| Type of FRS | 2019/20 | Change since 2018/19 | Change since 2014/15 | Change since 2009/10 |
|---|---|---|---|---|
| Predominately rural | 10m 28s | -6 seconds | +3 seconds | +47 seconds |
| Significantly rural | 9m 53s | -6 seconds | +27 seconds | +69 seconds |
| Predominately urban | 7m 37s | -4 seconds | -2 seconds | +35 seconds |
| Metropolitan | 7m 07s | -5 seconds | -13 seconds | +24 seconds |
| Non-metropolitan | 9m 46s | -6 seconds | +19 seconds | +62 seconds |
Source: FIRE1001
As shown in Figure 1.2, average response times to primary fires are lower in predominantly urban areas and quicker still in the subset of predominantly urban FRAs which are metropolitan. The difference in average total response times between predominantly urban and predominantly rural FRAs has been around two to three minutes every year since 2009/10. All types of FRA have shown gradual increases in average response time over the past decade. Over the past five years the story is more mixed. (Source: FIRE1001) Table 1.2 provides a summary of the trends in the last year for response times to primary fires by rural-urban and metropolitan/non-metropolitan FRAs.
Figure 1.2: Average total response times (minutes) by type of fire authority, England; 2009/10 to 2019/20

Source: FIRE1001
2. Response times components
The total response time (from time of call to time of first arrival) can be further divided into call handling time, crew turnout time and drive time. This is the second year that these breakdowns of the average response time have been published, in response to user need and to help explain which parts of the emergency response chain have changed over time. These data are drawn from the electronic IRS and so are only available from 2009/10 onwards (FIRE1001).
Call handling time: from time of call to the station being alerted.
Crew turnout time: time between the station being alerted and the time the first vehicle departs, i.e. the time it takes for the firefighters to prepare to leave.
Drive time: from time the first vehicle leaves to the first vehicle arriving at the scene of the incident (not necessarily the same vehicle).
Key results
-
Call handling times for primary fires decreased by one second in 2019/20 to 1 minute 22 seconds, the fourth consecutive decrease since a peak of 1 minute 27 seconds in 2015/16.
-
Crew turnout times for primary fires decreased by three seconds in 2019/20 to 1 minute 35 seconds; crew turnout times have been generally decreasing since data became available in 2009/10.
-
Drive time for primary fires decreased by three seconds in 2019/20 to 5 minutes 46 seconds; drive times have been generally increasing since data became available in 2009/10.
Whilst there has been a long-term upward trend in total response times (Figure 1.1), over the past decade average call handling times and drive times have generally increased but average crew turnout time has decreased.
It is notable that dwelling fires have the quickest times in all three of the response time components, probably reflecting the relative ease with which a street address can be communicated on the telephone and the urgency with which an FRS responds to fires with the greatest potential risk to life. Other outdoor fires, by contrast, are typically among the slowest responses in all three categories, which could reflect the difficulty of describing an outdoor location without a street address (call handling) and the difficulty of finding it once mobile (drive time).
A range of possible factors could have contributed to the long-term increase in total response time to primary fires (Figure 1.1). These may include changing traffic levels, ‘drive to arrive’ policies[footnote 5] and control staff typically asking more questions of the caller to better assess the risk and attendance needed. The possibility that changes to crew health and safety policies (e.g. that firefighters should dress in their personal protective equipment before boarding the appliance rather than en route in a moving vehicle) could be increasing response times seems unlikely as there has been a sustained reduction in crew turnout times. Analysis addressing the cause of the increase in fire response times in England, published in 2009,[footnote 6] concluded that rising traffic levels was the primary cause. This was based on data from 1996 to 2006 and the national situation may have changed since then, but an updated analysis is outside the scope of this statistics publication.
However, it is difficult to isolate the impact of any of these individual factors, and there may also be other factors, locally or nationally, which affect response times, such as urban sprawl and new housing developments outdating the strategic positioning of fire stations.
Table 2.1 Average response times to fires by response time component and type of fire with a summary of trends, England; 2019/20
| Type of fire | Response time component | 2019/20 | Change since 2018/19 | Change since 2014/15 | Change since 2009/10 |
|---|---|---|---|---|---|
| Primary Fires | Call handling | 1m 22s | -1 sec | no change | +20 secs |
| Primary Fires | Crew turnout | 1m 35s | -3 secs | -10 secs | -27 secs |
| Primary Fires | Drive time | 5m 46s | -3 secs | +17 secs | +53 secs |
| Dwelling Fires | Call handling | 1m 13s | -1 sec | -2 secs | +17 secs |
| Dwelling Fires | Crew turnout | 1m 22s | -3 secs | -11 secs | -26 secs |
| Dwelling Fires | Drive time | 5m 10s | +2 secs | +9 secs | +42 secs |
| Secondary Fires | Call handling | 1m 41s | -6 secs | -6 secs | +26 secs |
| Secondary Fires | Crew turnout | 1m 32s | -3 secs | -8 secs | -22 secs |
| Secondary Fires | Drive time | 6m 05s | -15 secs | +29 secs | +57 secs |
The response time components for primary fires by FRA type show that the plateau and slight decrease in primary total response times seen in Figure 1.1 between 2015/16 and 2017/18 were largely the result of decreases in crew turnout times in all FRA types, while the changes in total response time in 2018/19 and 2019/20 resulted from increases in drive time in all FRA types.
Although crew turnout times for predominantly rural FRAs typically took a minute to a minute and a half longer than predominantly urban ones in each year, likely due to the higher proportion of on-call (‘retained duty system’) firefighters who first need to get to a station once alerted, it was the predominantly rural FRAs which showed the greatest decrease in crew turnout time since 2012/13.
3. Distribution of total response times
The previous chapters present (mean) average response times, but many FRSs measure their performance based on the proportion of incidents attended within various target times. Fire statistics table FIRE1004 provides incident counts by one-minute bands (including 60 minutes) for primary and secondary fires.
Key results
In England in 2019/20:
- Over half (55%) of primary fires were responded to within eight minutes, while the most frequent response time band was six to seven minutes (15%).
- Over half (51%) of dwelling fires were responded to within seven minutes, while the most frequent response time band was six to seven minutes (17%).
- Over half (55%) of other building fires were responded to within eight minutes, while the most frequent response time band was six to seven minutes (15%).
- Over half (59%) of secondary fires were responded to within nine minutes, while the most frequent response time band was six to seven minutes (13%).
Figures 3.1 and 3.2 show the frequency distribution of total response times by one-minute bands for fires in dwellings and other buildings in England. The shapes of the curves reflect both the long-term reduction (i.e. decreasing height of the curves) in the total number of fires between 2009/10 and 2019/20 (decreases of 26% and 35% for dwellings and other buildings, respectively; table FIRE0102) and the increasing response times to those fires (i.e. the distribution of the curves moving to the right).
Figure 3.1: Number of fires attended by FRSs in one-minute total response time bands for fires in dwellings, England; 2009/10, 2014/15, 2018/19 and 2019/20
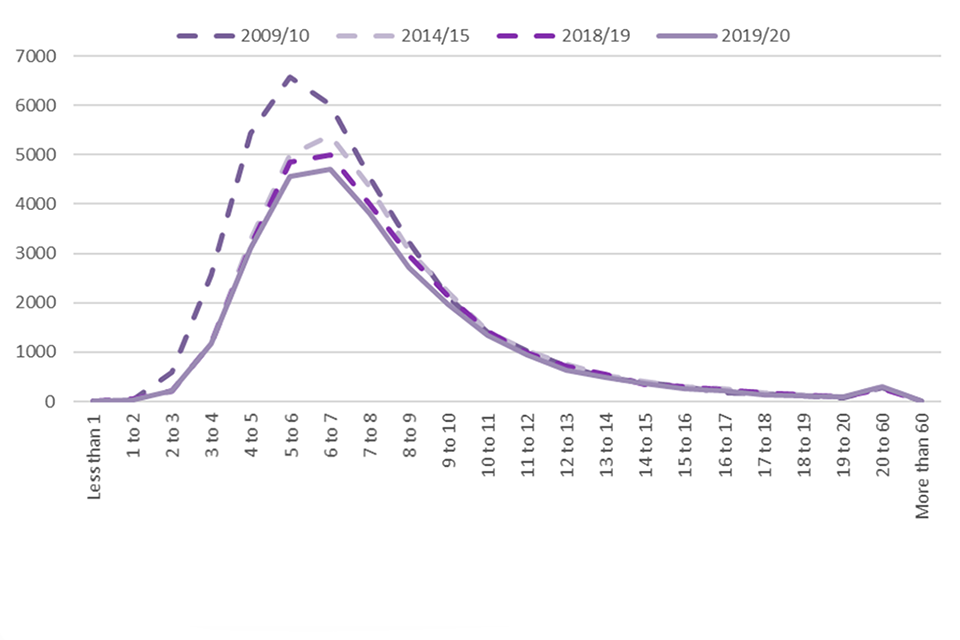
Figure 3.2: Number of fires attended by FRSs in one-minute total response time bands for fires in other buildings, England; 2009/10, 2014/15, 2018/19 and 2019/20

4. Response times and outcomes
There is no straightforward relationship between response times and the outcomes of a fire, as the type of fire and the time elapsed before the fire was discovered (both outside the control of FRSs) as well as other factors will also have an influence on the outcome. However, it is sometimes assumed that slower response times would be associated with greater instances of casualties/rescues and larger areas of damage due to the later starting of firefighting activities.
Key results
- The average total response time to dwelling fires involving casualties and/or rescues in England in 2019/20 was 7 minutes 37 seconds, this was unchanged compared with 2018/19 but an increase of 45 seconds since 2009/10.
- The average total response time to dwelling fires without casualties and/or rescues in England in 2019/20 was 7 minutes 46 seconds, this was two seconds fewer than in 2018/19 but an increase of 32 seconds since 2009/10.
- In 2019/20, the average area of fire damage to dwellings (excluding those incidents with areas of damage over 5,000m2) in England remained unchanged compared with 2018/19 - at the same time the average response time to dwelling fires decreased by two seconds (Source: FIRE0204, FIRE1001).
- In 2019/20, the average area of fire damage to other buildings (excluding those incidents with areas of damage over 1,000m2) in England increased by less than one per cent compared with 2018/19 - at the same time the average response time to other building fires increased by two seconds (Source: FIRE0305, FIRE1001).
Dwelling fires with casualties (including fatalities) and/or rescues have had consistently faster average response times than the majority of dwelling fires where no casualties and/or rescues were involved ( Figure 4.1). Although these comprise a relatively small number of incidents (10% of dwelling fires in the calculations since 2009/10 involved casualties and/or rescues) so are potentially more susceptible to fluctuations in average response times, the pattern is consistent across all years in the series. This difference in response times to dwelling fires with casualties and/or rescues compared with those without is most strongly apparent in the drive time (six seconds faster in 2019/20) - this suggests that, while dwelling fires are responded to most quickly of all primary fire types (Table 1.1), response times appear to reduce even more for higher risk incidents which are likely to involve casualties or rescues, if it has been possible to collect this information from the caller.
As noted in Chapter 1, the long-term trend has been an increase in total response times, yet the average area of damage in both dwelling and ‘other building’ fires has been decreasing (Figure 4.1, Figure 4.2). This would seem counterintuitive as it could be assumed that increased response time would lead to increased spread. However, this assumption may be being countered by improved early detection (the proportion of households with a working smoke alarm has remained high[footnote 7]), the gradual replacement of old furnishings with newer materials with improved fire resisting properties, new buildings with sprinkler systems and numerous other factors which are difficult to quantify.
Figure 4.1: Average total response times (RT) to dwelling fires with and without casualties or rescues and average extent of damage (excluding 5,000+ m2) for dwelling fires, England; 2009/10 to 2019/20
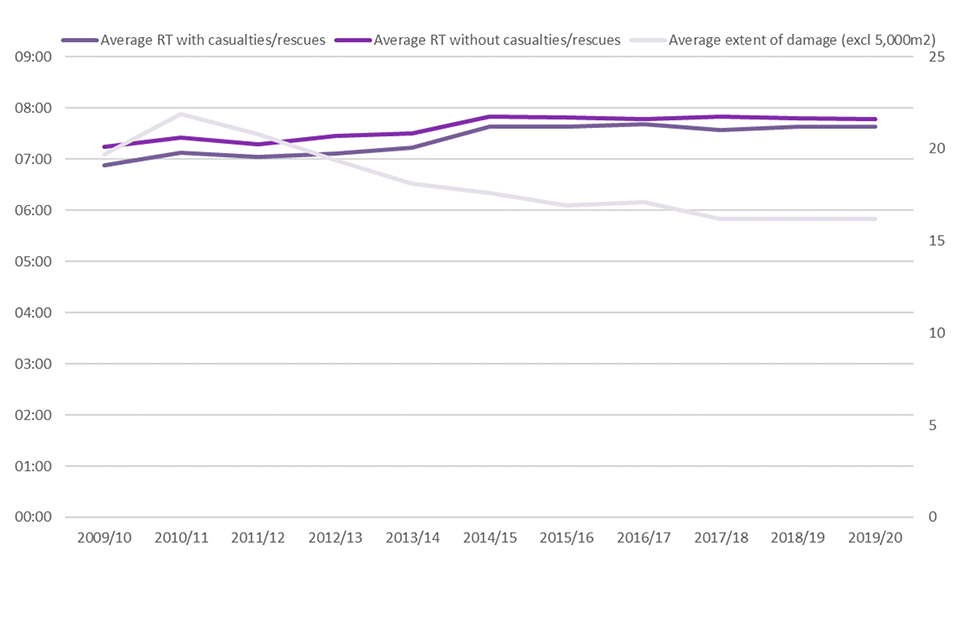
Figure 4.2: Average total response times (RT) to other building fires with and without casualties or rescues and average extent of damage (excluding 1,000+ m2) for other building fires, England; 2009/10 to 2019/20

5. Fire and rescue response times during COVID-19 National Lockdown
In response to the coronavirus (COVID-19) pandemic, lockdown restrictions came into effect from 23rd March 2020 and imposed strict limits on daily life. These included significant restrictions on freedom of movement and a requirement by law for a range of businesses to close.
This section shows, for primary and secondary fires attended by FRSs, response times to fires on a weekly basis under the national lockdown (22nd March 2020 to 27th June 2020) compared against a baseline of the average of the previous five years (2015 to 2019).
Whilst the timespan of the national lockdown goes past the end of March 2020 (and hence the usual end date of this release) given the quality of the data are sufficient at the national level, the importance of the topic area and that timeliness is a key principal in the GSS’s Quality statistics in government this analysis is included now, rather than in a future release.
Weekly figures are highly susceptible to fluctuation and so an upper and lower range, using the mean and standard deviation of the 2015-2019 baseline figures, was calculated. Any figures beyond this range would fall outside of what would be expected, although these results could be explained by various factors such as bank holiday dates, the weather and not simply the lockdown.
Key results
- The average response times to primary fires attended by FRSs during lockdown showed two phases. In the first eight weeks between 22nd March and 16th May 2020, five weeks showed an average response time below what was expected (i.e. below the lower dotted line in Figure 5.1). These could be explained by lower traffic levels resulting in quicker drive times.
- In the following six weeks between 17th May and 27th June 2020, two weeks showed an average response time above what was expected (i.e. above the higher dotted line in Figure 5.1), possibly reflecting the hot weather and an increased number of outdoor fires in these weeks.
- The average response times to secondary fires attended by FRSs during lockdown were in the range that would be expected (i.e. between the dotted lines in Figure 5.2) for the nine of the 14 weeks, however for five weeks (10th May to 13th June 2020) the response time was above what was expected, again possibly reflecting the hot weather and an increased number of outdoor fires in these weeks.
Figure 5.1: Average response time to primary fires, England, 22nd March to 27th June 2020 compared with the 2015-2019 baseline

Figure 5.2: Average response time to secondary fires, England, 22nd March to 27th June 2020 compared with the 2015-2019 baseline

6. Further information
This release contains statistics about incidents attended by fire and rescue services (FRSs) in England. The statistics are sourced from the Home Office’s online Incident Recording System (IRS). This system allows FRSs to complete an incident form for every incident attended, be it a fire, a false alarm or a non-fire incident (also known as a Special Service incident). The online IRS was introduced in April 2009. Previously, paper forms were submitted by FRSs and an element of sampling was involved in the data compilation process.
Fire and Rescue Incident Statistics and other Home Office statistical releases are available via the Statistics at Home Office pages on the GOV.UK website.
Data tables linked to this release and all other fire statistics releases can be found on the Home Office’s ‘Fire statistics data tables’ page.
Guidance for using these statistics and other fire statistics outputs, including a Quality Report, is available on the fire statistics guidance page.
The information published in this release is kept under review, taking into account the needs of users and burdens on suppliers and producers, in line with the Code of Practice for Statistics. If you have any comments, suggestions or enquiries, please contact the team via email using firestatistics@homeoffice.gov.uk or via the user feedback form on the fire statistics collection page.
6.1 Analysis of changes to methodology
Analysis of whether heat and/or smoke damage only incidents are included in these statistics was published last year in Response times to fires attended by fire and rescue services: England, April 2018 to March 2019 alongside an explanation of how the three elements of response times are calculated.
6.2 Revisions
The IRS is a continually updated database, with FRSs adding incidents daily. The figures in this release refer to records of incidents that occurred up to and including 30 June 2020. This includes incident records that were submitted to the IRS by 16 September 2020, when a snapshot of the database was taken for the purpose of analysis. As a snapshot of the dataset was taken on 16 September 2020, the statistics published may not match those held locally by FRSs and revisions may occur in the future. This is particularly the case for statistics with relatively small numbers, such as fire-related fatalities. For instance, this can occur because coroner’s reports may mean the initial view taken by the FRS will need to be revised; this can take many months, even years, to do so.
6.3 COVID-19 and the impact on the IRS
The figures presented in Chapters 1 to 4 of this release relate to incidents attended by FRSs during the period 1 April 2019 to 31 March 2020. In response to the coronavirus pandemic, restrictions in England and Wales started from 12 March 2020 and the first national lockdown was applied on 23 March 2020, which imposed strict limits on daily life.
The start of the restrictions and the first eight days of lockdown are therefore captured in IRS data for the year ending March 2020. Chapter 5 looks at the response times to fires during the first quarter of 2020/21, covering the first COVID-19 national lockdown period.
Home Office statisticians have been monitoring incidents on the IRS since the beginning of the Covid-19 pandemic lockdown to ensure that data quality has not been reduced, and that all incidents are recorded. In addition, FRSs were asked to upload the information more quickly after attending an incident so that the IRS could be used to produce Management Information to monitor the impact of COVID-19 on FRSs capacity.
6.4 Changes to this release and future releases
This release has been published using the new Home Office statistical release template. We welcome comments on the new format of release. Please send any comments to FireStatistics@homeoffice.gov.uk.
6.5 Other related publications
Home Office publish five other statistical releases covering fire and rescue services:
- Fire and rescue incident statistics, England: provides statistics on trends in fires, casualties, false alarms and non-fire incidents attended by fire and rescue services in England, updated quarterly.
- Detailed analysis of fires attended by fire and rescue services in England: focuses on fires attended by fire and rescue services across England, fire-related fatalities and non-fatal casualties in those fires; including analyses of the causes of fires and smoke alarms ownership and operation.
- Detailed analysis of non-fire incidents attended by fire and rescue services, England: focuses on non-fire incidents attended by fire and rescue services across England, including analysis on overall trends, fatalities and non-fatal casualties in non-fire incidents, and further detailed analysis of different categories of non-fire incidents.
- Fire and rescue workforce and pensions statistics: focuses on total workforce numbers, workforce diversity and information regarding leavers and joiners; covers both pension fund income and expenditure and firefighters’ pension schemes membership; and includes information on incidents involving attacks on firefighters.
- Fire prevention and protection statistics, England: focuses on trends in smoke alarm ownership, fire prevention and protection activities by fire and rescue services.
The Ministry of Housing, Communities & Local Government publish one statistical release on fire:
- English housing survey: fire and fire safety report: focuses on the extent to which the existence of fire and fire safety features vary by household and dwelling type.
Fire statistics are published by the other UK nations:
Scottish fire statistics and Welsh fire statistics are published based on the IRS. Fire statistics for Northern Ireland are published by the Northern Ireland Fire and Rescue Service using data from a system similar to the Incident Recording System, which means that they are not directly comparable to English, Welsh and Scottish data.
This statistical bulletin is produced to the highest professional standards and is free from political interference. It has been produced by statisticians working in accordance with the Home Office’s Statement of compliance with the Code of Practice for Official Statistics, which covers Home Office policy on revisions and other matters. The Chief Statistician reports to the National Statistician with respect to all professional statistical matters and oversees all Home Office Statistics products with respect to the Code, being responsible for their timing, content and methodology.
-
For more detailed technical definitions of different types of fire, see the Fire statistics definitions document. ↩
-
Other outdoor fires are fires in either primary outdoor locations, or fires in non-primary outdoor locations that have casualties or five or more pumping appliances attending. For a full definition of other outdoor locations, please refer to the Fire statistics definitions document. ↩
-
As defined by the Department for Environment, Food and Rural Affairs’ ‘2011 Rural-Urban Classification of Local Authorities and other geographies’. ↩
-
Metropolitan FRAs are a subset of those in the predominantly urban category, while non-metropolitan comprises those in predominantly rural, significantly rural and the remainder of predominantly urban FRAs. ↩
-
‘Drive to arrive’ policies require drivers to modify driving depending on risk, in order to reduce the number of incidents whilst mobile. ↩
-
Communities and Local Government: ‘Review of Fire and Rescue Service response times - Fire Research Series 1/2009’. ↩
-
See Fire prevention and protection statistics, England, April 2018 to March 2019. ↩