Ozone (O3)
Updated 30 April 2024

© Crown copyright 2024
This publication is licensed under the terms of the Open Government Licence v3.0 except where otherwise stated. To view this licence, visit nationalarchives.gov.uk/doc/open-government-licence/version/3 or write to the Information Policy Team, The National Archives, Kew, London TW9 4DU, or email: psi@nationalarchives.gov.uk.
Where we have identified any third party copyright information you will need to obtain permission from the copyright holders concerned.
This publication is available at https://www.gov.uk/government/statistics/air-quality-statistics/concentrations-of-ozone
Accredited Official Statistics
Air quality statistics in the UK, 1987 to 2023 - Ozone (O3)
Updated 30 April 2024
1. Why measure O3?
Ozone (O3) is a gas which is damaging to human health, causing irritation of the respiratory tract, eyes, nose and throat, as well as asthma attacks. Ozone can damage wild plants, crops, forests and some materials. Ozone can also react with other chemicals in the air to form particulate matter, or smog, which is also harmful to health.
Ozone is found at ground-level and in the stratosphere. The stratosphere is the region of the atmosphere which exists between 10 and 50 kilometres above ground-level. Ozone is naturally occurring at these altitudes, where it forms a protective layer shielding us from the sun’s radiation. However, at ground level, ozone has adverse effects on human health and the environment. It is ground-level ozone which is reported on in this publication, and we monitor concentrations to establish the risk ozone poses to human health and the environment.
In contrast to many air pollutants measured in the UK, there are no major emission sources of ozone itself. Ozone is formed and removed from the atmosphere through a wide range of chemical reactions and physical processes, the timescales of which range from minutes to years. For example, sunlight can trigger a complex series of chemical reactions between nitrogen dioxide and volatile organic compounds (VOCs), which can result in the formation of ozone.
The pollutants involved in the formation of ozone are known as precursor pollutants, and these can be both man-made and naturally occurring. Most of the ozone experienced in the UK is a consequence of emissions of methane (to which the UK contributes) and of ozone generated from NOx and VOC emissions outside the UK - see Air Quality Expert Group report ‘Ozone in the UK’).
The interdependence between concentrations of ozone and its precursor pollutants makes both assessing and tackling exposure to ozone difficult. Precursor pollutants can chemically react to form ozone, but other pollutants can also inhibit ozone formation or reduce its concentrations, such as nitric oxide from car exhaust fumes. What matters is both the amount and the ratio of pollutants (e.g. NO, NO2, VOC’s, carbon monoxide and methane) in the atmosphere, and measuring this can help quantify any perverse outcomes of tackling exposure to other pollutants like nitric oxide. Another layer of complexity in assessing exposure to ozone is that once formed, ozone can travel long distances and can reach high concentrations far from the original sources of pollution.
The Air Quality Standards Regulations (2010) set the target that that a three-year average of 8-hour mean concentrations of O3 should not exceed 120 µg/m3 more than 25 times.
2. Trends in concentrations of O3 in the UK
2.1 Annual mean concentrations of O3 in the UK, 1987 to 2023
The O3 index shows the annual mean of the daily maximum 8-hour mean, averaged over all sites that had annual data capture greater than or equal to 75 per cent. The shaded areas represent the 95 per cent confidence interval for the annual mean concentration for urban background sites and rural background sites. Annual means for individual sites can be found in the O3 statistical tables which accompany this report.
Figure 13: Annual mean concentrations of O3 in the UK, 1987 to 2023

Download the data for this chart in CSV format
Urban background O3 pollution has shown a long-term increase.
In 2023, the annual average daily maximum eight hour mean concentration of ozone reached 66.8 µg/m3 in urban areas, which is the highest value in the time series. This was an increase of 3 per cent compared to 2022.
From the start of the time series in 1992 to the mid-2000s, urban background ozone concentrations were increasing. Concentrations fluctuated from the mid-2000s to 2016 with no obvious trend.
Urban background ozone concentrations have followed an upward trend from 2017 and since 2018 concentrations have consistently been higher than at any other point since monitoring began, with 2023 being highest in the time series. Particularly hot and sunny weather occurred in summer 2022, and 2023 was on average the hottest year globally since records began - see Met Office blog. These conditions would likely have contributed towards more ozone formation than usual.
There has been a gradual convergence between urban background and rural background concentrations over time. This is likely due to the reduction in emissions of nitrogen oxides in urban areas across the UK (e.g. from road transport and industrial fuel combustion), which can locally suppress ozone concentrations.
Rural background O3 pollution has shown no clear long-term trend.
The average daily maximum eight hour mean concentration has fluctuated since the start of the time series in 1987 and was 73.2 µg/m3 in 2023. This is a 1 per cent decrease from the highest levels on record in 2022. Since 2018, rural background concentrations of ozone have been on an upward trend. The future trend in concentrations is largely dependent on global emissions of ozone precursor pollutants.
Ozone concentrations are typically higher in rural areas compared to urban areas. This is because there are typically fewer pollutants in rural areas to degrade ozone or inhibit its formation.
3. Average hours spent in ‘Moderate’ or higher O3 pollution
This metric measures the annual trend in the number of hours on average that concentrations are recorded at levels that may have impacts on human health. For O3, ‘Moderate’ air pollution (which requires action by citizens who are vulnerable to the health impacts of air pollution) is triggered when the latest 8-hour running mean concentration is greater than 100 µg/m3. The coloured areas relate to the categories of the Daily Air Quality Index - see Table 20 in the statistical tables that accompany this release.
Figure 14: Mean hours when O3 pollution was ‘Moderate’ or higher for rural background sites, 1987 to 2023
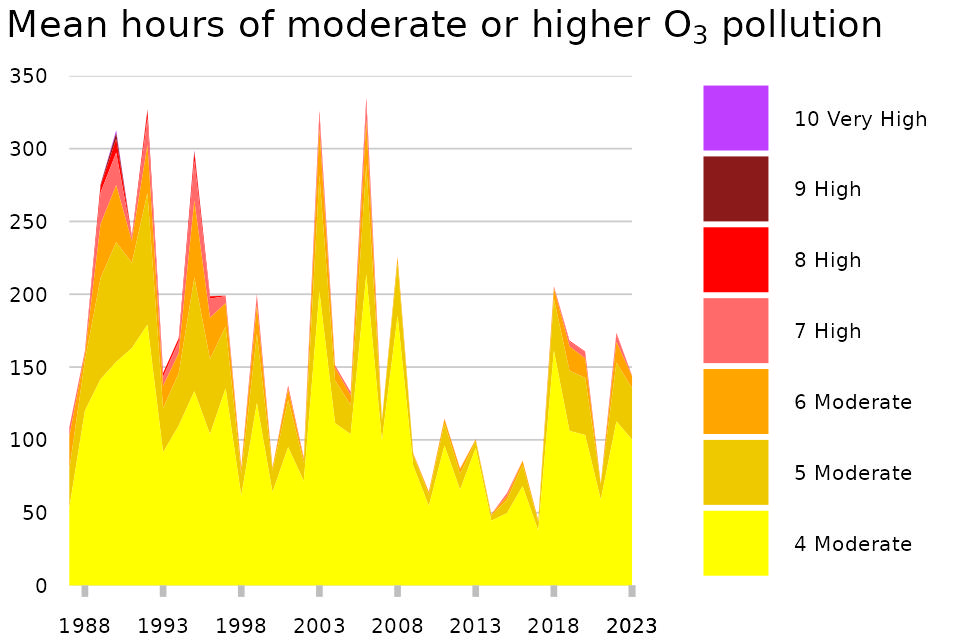
Download the data for this chart in CSV format
Figure 15: Mean hours when O3 pollution was ‘Moderate’ or higher for urban background sites, 1992 to 2023
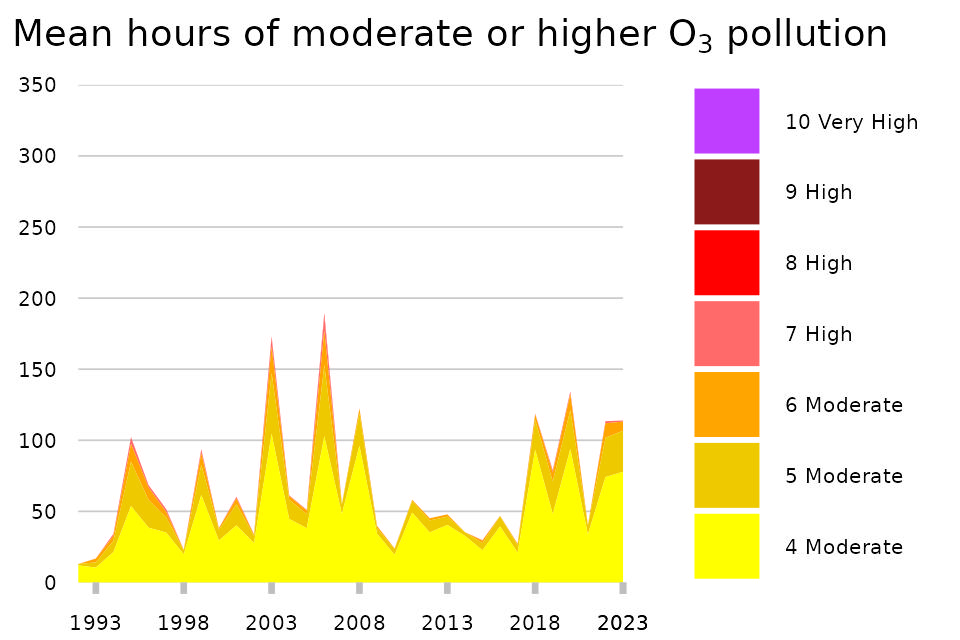
Download the data for this chart in CSV format
Since 2018, urban and rural background monitoring sites recorded an increased number of hours of ‘Moderate’ or higher O3 air pollution, following a decade of a relatively low number of hours.
At urban background sites between 2017 and 2020 there was a large increase in the number of hours for which the mean O3 concentration over the previous 8 hours exceeded 100 µg/m3 to 134 hours in 2020, the highest value in over a decade. Overall, the time series remains volatile, with a considerably lower mean number of hours in 2021 (40 hours) followed by relatively high levels since, with 114 hours in 2023.
There was a similar rise in rural background concentrations between 2017 and 2019. This was followed by a modest decrease in the number of hours of ‘Moderate’ or higher O3 pollution between 2019 and 2020 at rural background sites, though values remained relatively high (166 hours). Despite a dip in 2021, in 2023 the figure was still relatively high at 149 hours per site.
The overall trend in the rural indicator is a long-term decrease interrupted by several years where moderate pollution was more common. The long-term decrease is likely driven by reductions in global emissions of substances that lead to the formation of ozone such as nitrogen oxides and volatile organic compounds.
The overall trend in the urban indicator is less clear. The high variability over time and notable peaks can partly be explained by conditions during the hot, sunny summers of 2003, 2006, 2018, 2019, 2020, 2022 and 2023. The strong influence of weather on ozone concentrations means that a long time series is required to distinguish between weather effects and the effect of changes in pollutant emissions. In 2020, reductions in NOx concentrations in urban environments as a result of COVID-19 restrictions were probably also a large contributing factor to increased ozone pollution, since less NO will have been available to react with ozone and inhibit its formation.
4. Temporal variations in concentrations of O3 in the UK, 2023
4.1 Monthly variations
The O3 index shows the monthly mean, averaged over all included sites that had monthly data capture greater than or equal to 75 per cent in 2023. The shaded areas represent the 95 per cent confidence interval for the monthly mean concentration at urban background sites and rural background sites.
Figure 16: Monthly mean daily maximum 8-hour mean concentrations of O3 in the UK, 2023
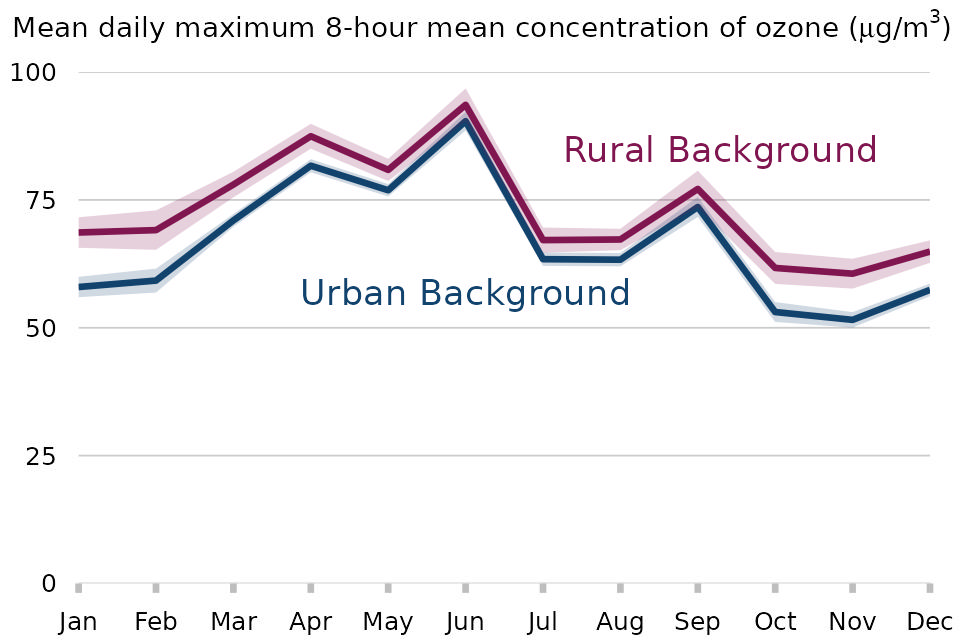
Download the data for this chart in CSV format
For O3 the greatest average concentrations tend to occur during the spring and summer months. Stagnant air can lead to the build-up of precursor pollutants, while more sunlight and higher temperatures can increase the rates of chemical reactions that generate ozone.
In 2023, the month that had the greatest ozone concentrations was June, for both rural and urban monitoring sites (with monthly mean concentrations of 93.6 µg/m3 and 90.4 µg/m3 respectively). June in 2023 was notably warm, dry and sunny - see Met Office blog. There was also a peak in ozone concentrations in September, which coincided with a significant heatwave across the UK - see Met Office blog. These sunny spells would have increased the rate of chemical reactions between the precursor pollutants that form ozone.
5. Sections in this release
Background to concentrations of air pollutants
Concentrations of nitrogen dioxide
Concentrations of particulate matter (PM10 and PM2.5)
Days with ‘Moderate’ or higher air pollution (includes sulphur dioxide)