eNews issue 33, October 2018
Published 26 October 2018

© Crown copyright 2018
This publication is licensed under the terms of the Open Government Licence v3.0 except where otherwise stated. To view this licence, visit nationalarchives.gov.uk/doc/open-government-licence/version/3 or write to the Information Policy Team, The National Archives, Kew, London TW9 4DU, or email: psi@nationalarchives.gov.uk.
Where we have identified any third party copyright information you will need to obtain permission from the copyright holders concerned.
This publication is available at https://www.gov.uk/government/publications/enews-from-gad-issue-33-october-2018--2/enews-issue-33-october-2018
eNews from GAD Issue 33, Oct 2018 - Supporting effective decision-making and robust reporting
Welcome to eNews – GAD’s regular newsletter. Planning for the future effectively requires more than thinking about expected future events. We also need to consider how other scenarios could markedly change our overall situation. An integrated approach is essential to prioritise well and to maximise our chances of avoiding setbacks and capturing opportunities. The Government has taken a major step forward in its future planning by publishing an overview of its plans for 57 key fiscal risks to our public finances and hence our whole economy. Colin Wilson looks at this effort and how it can be built on further.
Openness about government plans is a key part of what has been achieved. Another form of openness, responsible sharing of information by some public service pension schemes, has led to benefits for public and private spheres of the pension and life insurance industries. Jenny Bullen explains this in more depth.
Finally, we at GAD are opening up our knowledge of developments in understanding how long we may live. We regularly apply this knowledge to help inform public sector decision making, and our new bulletin will support this further.
I hope that you enjoy this issue. As always, previous issues of eNews are available on our website www.gov.uk/gad.

Martin Clarke, Government Actuary
News from GAD
Report on the health of Local Government pensions
GAD has completed its first statutory review of the 91 separate Local Government Pension Scheme (LGPS) funds in England and Wales. The review process aims to provide transparency and effective oversight of the LGPS. consistency, solvency and long term cost efficiency. It included extensive engagement with stakeholders both one to one and at roadshows around the UK, and built on the previous dry run exercise. The report, published by the Ministry of Housing Communities and Local Government in September, outlines our finding that overall the LGPS is in a strong financial position.
Developments
Pensions policy update
DWP are working on a number of strands of pensions policy following on from the March 2018 White Paper on protecting Defined Benefit pension schemes (see GAD Technical Bulletin). Plans have now been published to clarify and strengthen trustee’s investment duties, particularly in relation to environmental, social and governance considerations. A ministerial update to Parliament confirmed the government’s plans for two consultations this autumn on how to facilitate consolidation and in relation to proposals for Collective DC schemes. Findings from the government’s feasibility study into the pensions dashboard are also due to be published shortly
Pension Protection Fund round-up
The PPF is currently consulting on draft rules setting out how they intend to charge the Pension Protection Levy on Defined Benefit pension schemes in 2019-20. The PPF state that their strong funding position means that, despite record levels of claims last year, they are able to keep the levy rules relatively stable. In addition, revised actuarial factors will come into force from 1 November and it is also expected that some statutory valuation assumptions will be updated at that time, following a recent consultation. The PPF has also commented on a recent European court ruling which may require compensation levels to be increased for a select group of members.
Independent Review of the Financial Reporting Council
Earlier this year, the government commissioned an independent review of the regulator for auditors, accountants and actuaries, to report by the end of 2018. Welcomed by the FRC and led by Sir John Kingman, the review’s aim is to make the FRC the best in class for corporate governance and transparency, while helping it to fulfil its role of safeguarding the UK’s business environment. GAD has recently responded to the review’s call for evidence in relation to the arrangements for actuarial regulation. The Institute and Faculty of Actuaries has published its response.
Whole of Government Accounts
HM Treasury has published the Whole of Government Accounts for the year ended 31 March 2017. Consolidating the audited accounts of over 7,000 organisations, these accounts have a wider scope than other National Accounts measures and provide a mechanism for holding government to account for its long term financial performance.
Sustainability of public finances
The Office for Budget Responsibility published its Fiscal Sustainability Report in July. Public finances are likely to come under significant pressure over the longer term due to an ageing population and upward pressure on health spending. The government’s plans to address this are part of the suite of risk management explored by Colin Wilson in his article in this edition.
Managing fiscal risk openly and more effectively
Responsible management of United Kingdom public finances is key to sustaining delivery of public services and strengthening the economy. This is a task involving many significant areas of uncertainty. The government has published a report detailing its approach for managing a broad range of these risks, setting a new standard for transparency and openness. We outline what has been achieved and consider some ideas for further progress.
What has been achieved?
The Managing Fiscal Risk: government response to the 2017 Fiscal risks report (MFR), was published in July 2018 by HM Treasury. It represents the first completion of a new cycle of assessing and actively managing risks to the public finances. This cycle was set in motion in 2015 when Parliament approved a new requirement for the Office for Budget Responsibility (OBR) to publish a comprehensive review of financial risks to tax revenues, public spending and the public sector balance sheet. They were also asked to conduct a stress test. This ‘what if’ analysis examines both immediate and longer term implications of a severe economic crisis on the United Kingdom public finances. The Government is required to respond to each review within a year of publication.
In its first Fiscal Risks Report (FRR) in 2017 the OBR identified 57 fiscal risks. Examples include the risk of future financial crises, increasing demand for health and social care, and changing tax revenues. The chart below summarises the subset of risks OBR identified as the main threats to long term fiscal sustainability.
The OBR’s report drew on, and developed, previous analysis of risks used to inform its other assessments and projections. The Government’s response sets out existing approaches to managing these risks and plans to proactively manage them in future
Why is proactively addressing fiscal risks important?
Public sector decision makers need to consider not only the most likely future outlook for the public finances, but also the likelihood and scale of impact of alternatives around the central forecast. Many of the risks and issues MFR considers are implications of, or can be influenced by, Government actions. Therefore public services can be more robustly delivered through proactively planning to limit or avoid the most significant possible adverse events and to increase exposure to future opportunities.
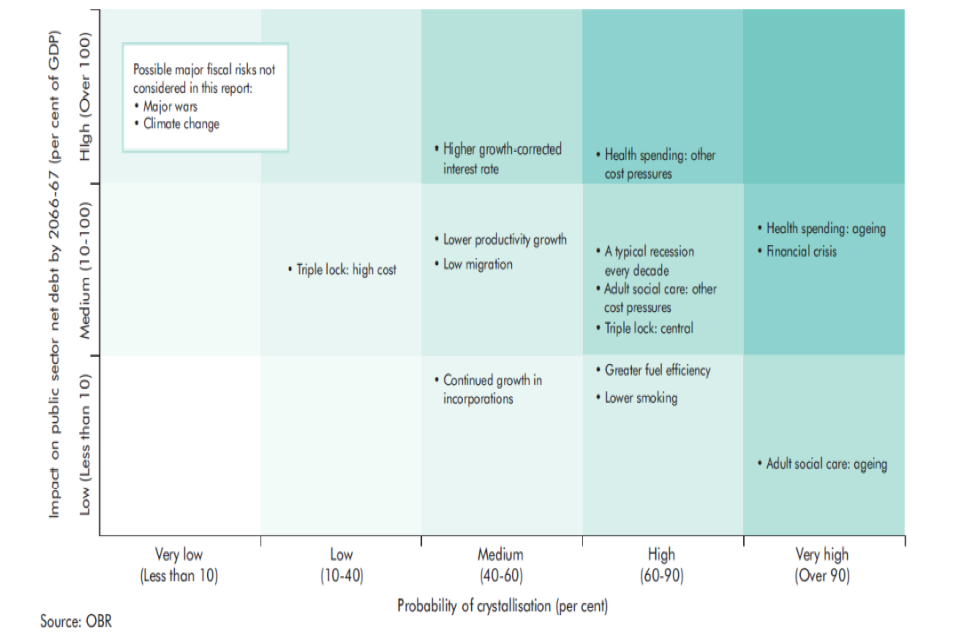
Figure 1: Sources of risk to long term fiscal sustainability identified by the FRR
What can be improved further?
MFR has provided an unprecedented opportunity for parliamentary and public scrutiny, but also for analysts across government to better understand the full landscape of public finance risk management. It is the most comprehensive such public report in the world and sets a high standard among developed nations. That said, there is still scope for further development of the underlying analysis and reporting for subsequent iterations. For example:
- How accurate are the methods that are currently used to quantify risks and could they be developed further?
- Can they be used to assess the levels of both gross and net risk, i.e. before and after mitigating actions?
- How cost-effective are these mitigating actions?
- What is the highest acceptable degree of risk that the government can tolerate in a given area, and are mitigating actions sufficient to bring risk within this?
In practice the extent to which these questions can be sensibly answered will be limited in some cases, but even asking the questions may lead to additional insights into the risk management process.
Public sector balance sheet
One example of where these questions are particularly relevant is the public sector balance sheet. That is the government’s holdings of assets and liabilities. Risks can arise in a number of ways, from uncertainty around the returns from sale of assets (eg student loans), to sudden reclassifications that move substantial assets or liabilities on to or off the public sector balance sheet (both requiring extra care and management, for example National Rail). Many different measures can be considered, which vary in how and what they measure.
An area where improved analysis may be particularly helpful is the increasing range of financial government guarantees that may be called upon. Examples include “Help to Buy” mortgage schemes, and promises of support to pension schemes of former nationalised industries. GAD has been able to help departments which hold these contingent liabilities to address the questions above. This is an area in which work is continuing, including as part of the HM Treasury Balance Sheet Review.
“An area where improved analysis may be particularly helpful is the increasing range of financial government guarantees … ”
Considering interactions
The OBR FRR identifies that both its own and previous Government analysis is often focussed risk-by-risk, one issue at a time. Yet part of the challenge associated with many of these significant risk exposures is that in practice they are interlinked. For example, the ageing of the UK population both affects the cost of pensions provided by the government and also adds pressure to health and social care spending.
“part of the challenge … is that in practice [risks] are interlinked”
MFR outlines the government plans to manage each of these drivers of public spending increases, but their interrelationship can raise difficulties: the extent to which State Pension Age can be raised to realign the ratio of the working age population to those already retired depends on the success of efforts to ensure longer periods of life in good health. The latter is in turn an important theme affecting controlling health and care costs. Future analysis could be enhanced by developing methods to better capture the interactions between these risks.
Considering the context
This report considers high-level risks and the overall risk management framework. It is important also to ask how the framework facilitates the management of specific individual risks by the departments responsible. This is especially relevant where there are potential knock-on consequences elsewhere. For example, we might ask what risks the long-term decline of Defined Benefit pensions poses for future benefits expenditure. This issue will undoubtedly inform DWP policy development. How much analysis of the potential financial implications is it worth carrying out and what is the significance to the overall risks to future revenue and expenditure?
In some instances the existence of an exposure to risk is closely linked to the intent of government policy itself. An example is the risk of the State Pension triple lock adding to pension costs. Equal depth of analysis and management of these risks as for those with more incidental connection to policy is necessary for both effective policy decision making and robust delivery of these policies and consistent with further improving transparency and accountability.
However, we shouldn’t lose sight of the huge progress in openness and value of pulling all this information together in one place. We look forward to GAD’s ongoing participation in further enhancements of government’s financial risk management.
GAD contributes data for mortality tables
Unprecedented levels of public sector pension data have been included in the latest Continuous Mortality Investigation (CMI) analysis of mortality rates for retired pension scheme members. GAD has contributed to bringing parties together, and to carefully preparing and anonymising the data. This example shows the potential for benefits for both public and private sectors, if responsible methods for sharing sensitive data can be found.
What analysis has been undertaken?
The CMI’s self administered pension schemes (“SAPS”) experience project produces impartial analysis of how long pensioners live. They construct tables of mortality rates and other practical tools which are widely used by actuaries to value pension scheme liabilities, inform decisions around how benefits are to be funded and also in setting prices for and managing life insurance products. The CMI is owned and run by the UK actuarial profession, the Institute and Faculty of Actuaries.
The public sector data, together with similar data from medium size and larger private sector schemes, has been used to prepare new “S3” series tables. Analysis by the Pensions Regulator in June 2018 showed that more than 90% of recent pension valuations used the existing CMI SAPS mortality series. CMI’s consultation for registered users on its initial draft versions of the tables closed in mid September.
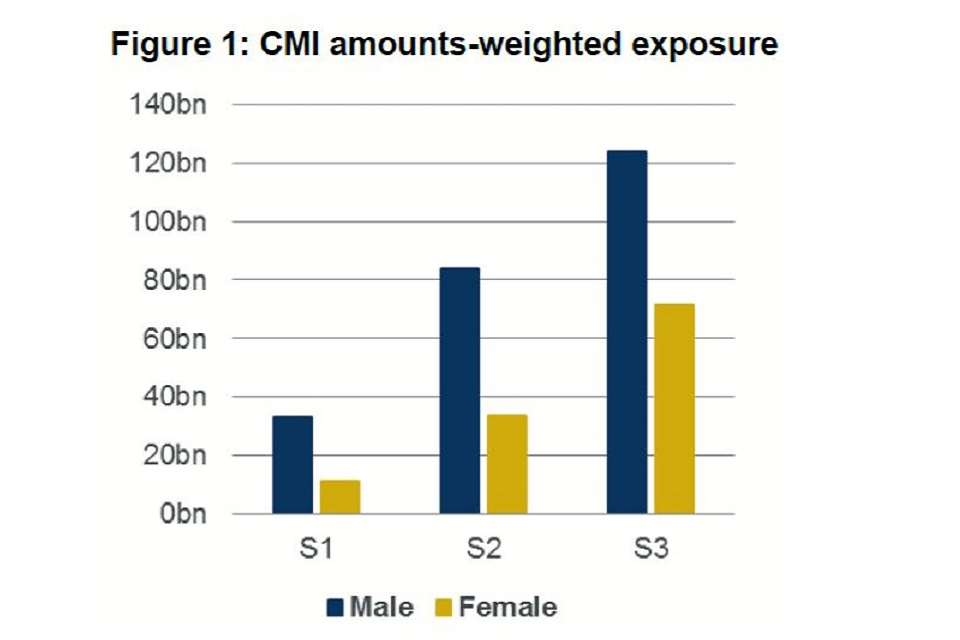
Figure 1: CMI amounts-weighted exposure
How was the data managed?
Only a subset of the detailed information pension scheme administrators hold about members is needed for CMI’s analysis, eg date of birth, and size of pension. For the subset of public sector pension schemes who agreed to share data, GAD was careful to ensure that its submission was limited to essential information and appropriately anonymised and compliant with our duties under the EU General Data Protection Regulation (GDPR). The key steps taken included:
- Removing individual and scheme identifiers
- Rounding birthdays and other dates to nearest month.
- Using a dummy value in place of the largest pensions
What are the potential benefits?
The additional data submitted by GAD has notably increased the amount of data used to prepare the S3 tables compared to the existing S1 and S2 tables. The chart above compares the amounts-weighted exposures each table is derived from, broadly the amounts of pension paid to members of the schemes included.
What is the benefit of this increased pool of underlying evidence? Consider projecting the pattern of future cash flows for a group of individuals in a given pension scheme or group of life insurance policies. This requires numerous assumptions, including for the pattern of future lifespans of the particular group of individuals. These patterns vary across different workforces but also over time, as the CMI have found via examining the SAPS data. Hence only relatively recent data on length of life can be used, but even for large schemes this means too little data to derive reliable mortality rates. So actuaries typically scale an appropriate SAPS table to produce rates that match the expected level of future mortality. The greater volume of data has allowed CMI to produce a more extensive selection of tables. This provides a better ability to create assumptions to reflect different expected future patterns. This is helpful to inform decisions having a permanent effect on future cashflows, for example improving pension scheme benefits or setting a level premium to be paid for the lifetime of a given life insurance policy.
Potential benefits if sensitive data can be shared safely and appropriately are not limited to pensions. NHS patient records are another example. If you would like to discuss these issues further, please get in touch.
Sharing mortality insights from experts
The length of time any of us will live individually is shrouded by uncertainty. However when the actual lifespans of a large group are considered, predictable patterns emerge. Tracking these over time has enabled demographers and actuaries to monitor the rise of length of life and project future longevity. GAD has a long track record both in contributing to this body of knowledge and applying it practically. GAD has decided to produce a twice yearly bulletin to summarise new findings with a focus on practical implications.
Who is this bulletin for?
This bulletin is aimed at anyone in the public sector whose role involves taking decisions which may be influenced by changing expectations for future life expectancy and other closely related demography issues. As you might expect this includes those having responsibility for public sector pension arrangements in a variety of roles such as scheme managers, those with governance responsibilities, and even those with regulatory roles. It may also be useful to those looking at future resource planning over a variety of timescales where the aggregate of individual lifespans is an important factor.
Those who are already experts within the field of monitoring and projecting length of human life, both practitioners and those more purely involved in research, may still find GAD’s practitioner viewpoints provide a useful alternate perspective on mortality and longevity.
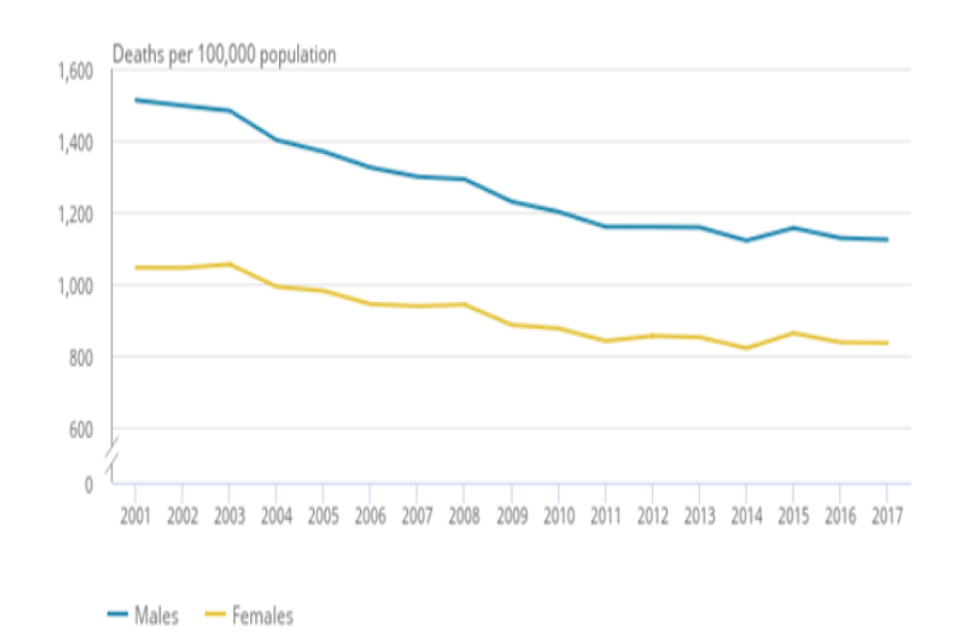
Age standardised mortality rates, 2001-17 England and Wales
What will the bulletin offer?
The bulletin will use a plain English style to communicate the practical relevance and broader context of emerging developments in mortality and longevity. It will highlight what other information is related to topical issues, both already published and also forthcoming and as illustrated by the examples to the right with both UK specific and wider international relevance. The hope is that setting out the evolving landscape in our own terms will provide opportunities for starting constructive conversations.
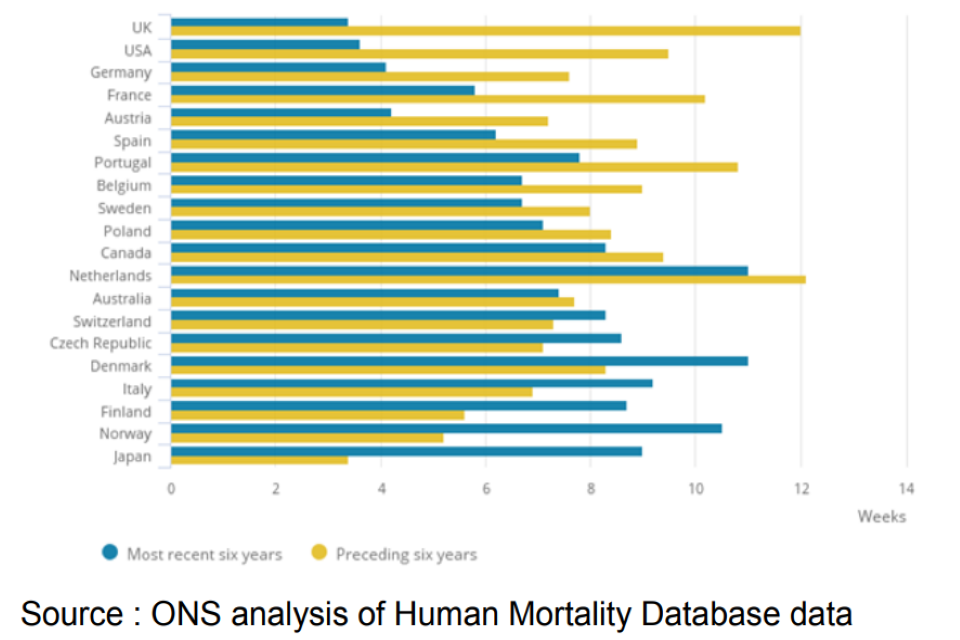
Average annual increase in period life expectancy at age 65 Males, selected countries
Source: Office for National Statistics (ONS)
Source: ONS analysis of Human Mortality Database data eNews from GAD subscribers will be given the option to subscribe to the GAD mortality insights bulletin once the first edition of this new bulletin is available.
GAD contacts
Email: enquiries@gad.gov.uk, Telephone: 020 7211 2601. For details of our management team and office address please visit: https://www.gov.uk/gad#people
Disclaimer
The information in this publication is not intended to provide specific advice. For our full disclaimer, please see the GAD publications page.
The Government Actuary’s Department is proud to be accredited under the Institute and Faculty of Actuaries’ Quality Assurance Scheme.