Local authority capital expenditure and receipts in England: 2019 to 2020 final outturn
Published 5 November 2020
Applies to England

© Crown copyright 2020
This publication is licensed under the terms of the Open Government Licence v3.0 except where otherwise stated. To view this licence, visit nationalarchives.gov.uk/doc/open-government-licence/version/3 or write to the Information Policy Team, The National Archives, Kew, London TW9 4DU, or email: psi@nationalarchives.gov.uk.
Where we have identified any third party copyright information you will need to obtain permission from the copyright holders concerned.
This publication is available at https://www.gov.uk/government/statistics/local-authority-capital-expenditure-and-receipts-in-england-2019-to-2020-final-outturn/local-authority-capital-expenditure-and-receipts-in-england-2019-to-2020-final-outturn
In this release:
- Capital expenditure by local authorities in England totalled £26.3 billion in 2019-20, down £251 million (1%) in real terms from 2018-19.
- Expenditure on highway & transport services totalled £7.5 billion in 2019-20 and remained the largest area of spend, however expenditure was down £468 million (6%) in real terms from the previous year.
- Expenditure on housing services totalled £6.1 billion in 2019-20, up £533 million (10%) in real terms from the previous year. It also remained the second largest area of spend.
- Prudential borrowing continued to be the largest source of financing at £11.5 billion, and was up £1.3 billion (13%) in real terms from 2018-19. The amount of expenditure financed from this source has doubled since 2015-16.
- Capital receipts totalled £2.8 billion, £1.3 billion (31%) lower in real terms compared to 2018-19.
Release date: 05 November 2020
Date of next release: Autumn 2021
Contact: Capital Data team Capital.Data@communities.gov.uk
Media enquiries: 0303 444 1209 NewsDesk@communities.gov.uk
1. Introduction
Capital expenditure comprises the buying, constructing or improving physical assets, such as buildings, land, vehicles and other miscellaneous property, including streetlights and road signs. It also includes grants and advances that authorities make to other bodies for capital purposes. Because of the project-based nature of capital expenditure, there can be relatively larger variance in expenditure over time compared with revenue expenditure.
This release provides the final outturn for local authority capital expenditure and receipts in the financial year April 2019 to March 2020. These data are derived from Capital Outturn Returns (COR), collated by the Data, Analytics and Statistics Division of the Ministry of Housing, Communities & Local Government (MHCLG). COR forms capture local authority capital expenditure and receipts by economic category and service area, as well as a breakdown of how expenditure is financed, prudential system information, and accumulated capital receipts and major repairs reserve levels. COR service areas are consistent with the Service Reporting Code of Practice (SeRCOP).
A provisional outturn was published in a Statistical Release in July. This was based on information from Capital Payments and Receipts Returns 4 (CPR4) submitted by local authorities in England.
Table 1a: Local authority capital expenditure & other transactions and capital receipts by category: forecast and final outturn, England, 2017-18 to 2019-20
Real terms series, all monetary figures in 2019-20 prices (£ millions)
| 2017-18 | 2018-19 | 2019-20 | ||||
|---|---|---|---|---|---|---|
| Category | Forecast (adjusted) | Outturn (final) | Forecast (adjusted) | Outturn (final) | Forecast (adjusted) | Outturn (final) |
| Acquisition of land & existing buildings | 2,175 | 4,224 | 5,056 | 4,539 | 5,337 | 4,237 |
| New construction, conversion & renovation | 16,979 | 14,519 | 13,741 | 13,425 | 14,233 | 13,763 |
| Vehicles, plant, furniture & equipment | 1,585 | 1,415 | 1,434 | 1,336 | 1,280 | 1,651 |
| Intangible fixed assets | 271 | 273 | 368 | 301 | 399 | 273 |
| Total expenditure on fixed assets | 21,011 | 20,431 | 20,599 | 19,600 | 21,250 | 19,923 |
| Expenditure on grants | 2,041 | 3,277 | 3,698 | 2,149 | 3,724 | 2,569 |
| Expenditure on loans and other financial assistance | 1,687 | 1,896 | 2,645 | 2,960 | 2,451 | 2,082 |
| Acquisition of share and loan capital | 217 | 846 | 581 | 1,825 | 538 | 1,708 |
| Total financial expenditure | 3,945 | 6,019 | 6,924 | 6,934 | 6,713 | 6,359 |
| Total capital expenditure | 24,956 | 26,449 | 27,523 | 26,534 | 27,963 | 26,282 |
| - of which GLA: | 3,089 | 3,443 | 4,180 | 5,081 | 5,456 | 5,156 |
| Payment of LSVT levy | 0 | 0 | 0 | 0 | 0 | 0 |
| Expenditure treated as capital by virtue of a Section 16(2)(b) Direction [footnote 1] | 42 | 151 | 61 | 253 | 70 | 179 |
| Total capital expenditure & other transactions | 24,998 | 26,600 | 27,583 | 26,786 | 28,033 | 26,461 |
| Total capital receipts | 3,390 | 3,457 | 2,976 | 4,076 | 2,558 [footnote 2] | 2,823 |
Sources: CER 2017-18 – 2019-20, COR 2017-18 – 2019-20
Table 1b: Local authority capital expenditure & other transactions and capital receipts by category: forecast and final outturn, England, 2017-18 to 2019-20
Cash terms table, all monetary as reported (£ millions)
| 2017-18 | 2018-19 | 2019-20 | ||||
|---|---|---|---|---|---|---|
| Category | Forecast (adjusted) | Outturn (final) | Forecast (adjusted) | Outturn (final) | Forecast (adjusted) | Outturn (final) |
| Acquisition of land & existing buildings | 2,075 | 4,030 | 4,936 | 4,430 | 5,337 | 4,237 |
| New construction, conversion & renovation | 16,200 | 13,853 | 13,413 | 13,105 | 14,233 | 13,763 |
| Vehicles, plant, furniture & equipment | 1,512 | 1,351 | 1,399 | 1,304 | 1,280 | 1,651 |
| Intangible fixed assets | 259 | 260 | 359 | 294 | 399 | 273 |
| Total expenditure on fixed assets | 20,047 | 19,494 | 20,108 | 19,133 | 21,250 | 19,923 |
| Expenditure on grants | 1,947 | 3,127 | 3,610 | 2,098 | 3,724 | 2,569 |
| Expenditure on loans and other financial assistance | 1,610 | 1,809 | 2,581 | 2,889 | 2,451 | 2,082 |
| Acquisition of share and loan capital | 207 | 807 | 567 | 1,781 | 538 | 1,708 |
| Total financial expenditure | 3,764 | 5,743 | 6,758 | 6,768 | 6,713 | 6,359 |
| Total capital expenditure | 23,811 | 25,236 | 26,866 | 25,901 | 27,963 | 26,282 |
| - of which GLA: | 2,948 | 3,285 | 4,081 | 4,960 | 5,456 | 5,156 |
| Payment of LSVT levy | 0 | 0 | 0 | 0 | 0 | 0 |
| Expenditure treated as capital by virtue of a Section 16(2)(b) Direction [footnote 1] | 40 | 144 | 59 | 247 | 70 | 179 |
| Total capital expenditure & other transactions | 23,851 | 25,380 | 26,926 | 26,147 | 28,033 | 26,461 |
| Total capital receipts | 3,235 | 3,299 | 2,905 | 3,978 | 2,558 [footnote 2] | 2,823 |
Sources: CER 2017-18 – 2019-20, COR 2017-18 – 2019-20
2. Capital expenditure and receipts by economic category
Local authorities report capital expenditure, incurred by buying, building or improving capital assets, and capital receipts, received from the sale of a capital asset.
Total capital expenditure is divided into total expenditure on fixed assets, which includes spending on tangible and intangible fixed assets, and total financial expenditure, which includes grants, loans, and acquisitions of share or loan capital for capital purposes.
The capital expenditure and receipts data in Tables 1a and 1b for 2015-16 and 2016-17 are available in the source workbook made available alongside this publication.
As shown in Table 1a and Figure 1, capital expenditure by local authorities in England totalled £26.3 billion in 2019-20, down £251 million (1%) in real terms from 2018-19. This is the first time in the last five years that capital expenditure has fallen, mainly due to a decrease in financial expenditure of £575 million (8%) in real terms from 2018-19.
- Expenditure on fixed assets totalled £19.9 billion in 2019-20, up £323 million (2%) in real terms from the previous year.
- Expenditure on new construction, conversion & renovation was £13.8 billion in 2019-20, up £338 million (3%) in real terms from the previous year. It remains the biggest capital expenditure for local authorities, accounting for 52% of all capital expenditure in 2019-20.
- Expenditure on acquisition of land & existing buildings was lower in 2019-20 at £4.2 billion, £302 million (7%) in real terms less than in 2018-19. This is the first time in the last five years that this expenditure has fallen.
- Expenditure on vehicles, plant, furniture & equipment was up £315 million (24%) in real terms than in 2018-19.
- Expenditure on intangible assets decreased by £28 million (9%) to £273 million in real terms in 2019-20.
Capital receipts totalled £2.8 billion in 2019-20, £1.3 billion (31%) lower in real terms than in 2018-19.
Figure 2 shows the difference between unadjusted forecasts, adjusted forecasts and outturn data for total capital expenditure since 2015-16. Forecasts are adjusted as local authority forecasts are consistently higher than subsequent outturn. Differences between them can be caused by slippage in timings of projects, changes in service priorities or in financial capabilities of an authority throughout the year.
Figure 1: Local authority capital expenditure in real terms by economic category, England, 2015-16 to 2019-20
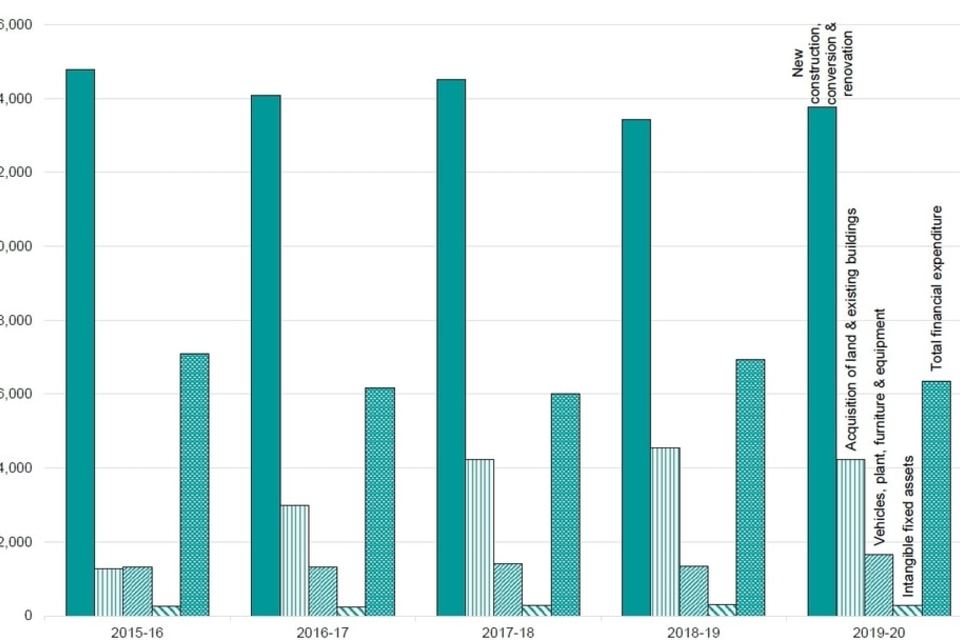
Figure 1: Local authority capital expenditure in real terms by economic category, England, 2015-16 to 2019-20
Figure 2: Total capital expenditure in real terms: unadjusted forecast, adjusted forecast, and final outturn, England, 2015-16 to 2019-20
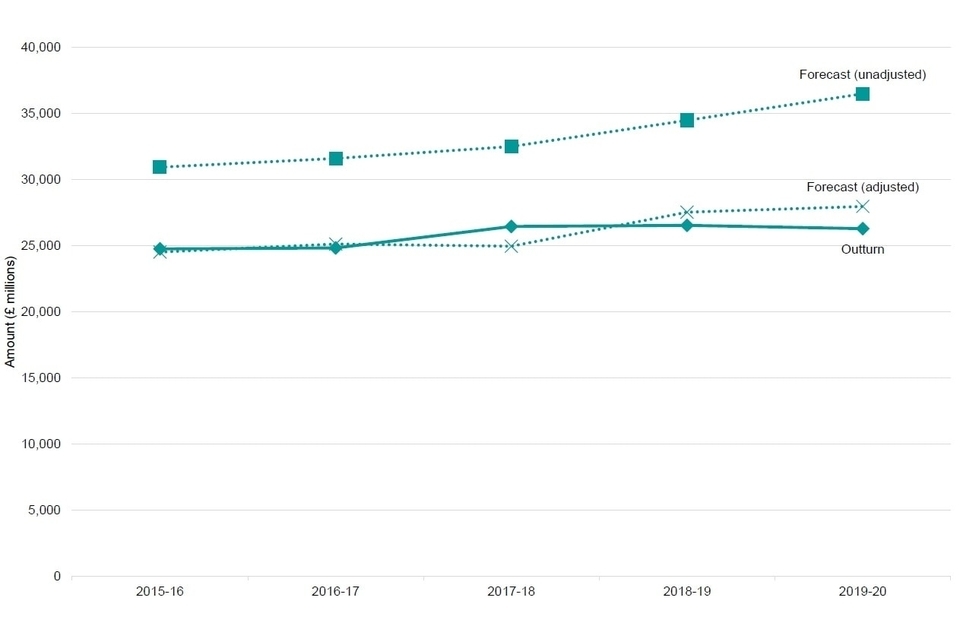
Figure 2: Total capital expenditure in real terms: unadjusted forecast, adjusted forecast, and final outturn, England, 2015-16 to 2019-20
Table 2a: Local authority total capital expenditure by service: final outturn, England, 2015-16 to 2019-20
Real terms series, all monetary figures in 2019-20 prices (£ millions)
| 2015-16 | 2016-17 | 2017-18 | 2018-19 | 2019-20 | |
|---|---|---|---|---|---|
| Service | Outturn (final) | Outturn (final) | Outturn (final) | Outturn (final) | Outturn (final) |
| Education [footnote 3] | 3,493 | 3,277 | 2,988 | 2,483 | 2,310 |
| Highways & Transport | 9,078 | 8,336 | 6,923 | 7,941 | 7,473 |
| - of which GLA | 4,709 | 3,808 | 2,092 | 3,709 | 3,877 |
| Social Care | 285 | 333 | 306 | 345 | 371 |
| Public Health | 11 | 20 | 10 | 20 | 21 |
| Housing | 5,032 | 5,011 | 5,877 | 5,519 | 6,052 |
| - of which London Boroughs | 1,855 | 1,882 | 2,213 | 1,971 | 2,295 |
| - of which GLA | 283 | 177 | 762 | 929 | 785 |
| Culture & Related Services | 1,167 | 1,071 | 1,144 | 1,132 | 1,242 |
| Environmental & Regulatory Services | 794 | 660 | 1,246 [footnote 4] | 624 | 712 |
| Planning & Development Services | 1,843 | 1,778 | 1,674 | 1,722 | 1,891 |
| Digital Infrastructure | : | : | : | : | 139 |
| Police | 668 | 670 | 957 | 697 | 759 |
| Fire & Rescue Services | 188 | 195 | 165 | 153 | 163 |
| Central Services [footnote 5] | 1,627 | 2,374 | 2,041 | 1,778 | 1,881 |
| Trading [footnote 6] | 566 | 1,273 | 3,118 | 4,121 | 3,269 |
| Total Capital Expenditure | 24,752 | 24,826 [footnote 7] | 26,449 | 26,534 | 26,282 |
Sources: COR 2015-16 – 2019-20
Figure 3: Local authority capital expenditure in real terms by service, England, 2015-16 to 2019-20
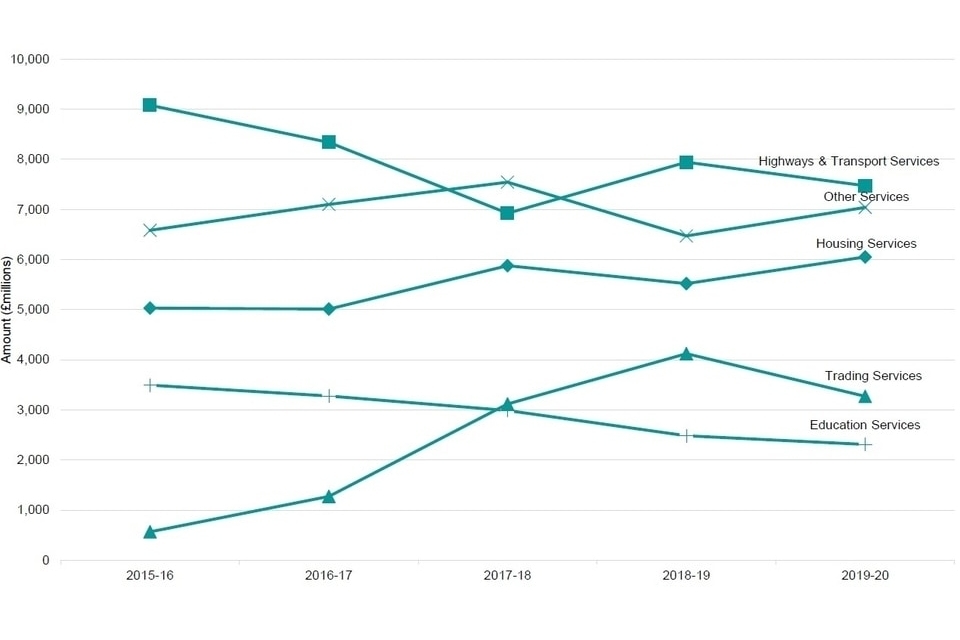
Figure 3: Local authority capital expenditure in real terms by service, England, 2015-16 to 2019-20
3. Capital expenditure by service area
Local authorities report capital expenditure and receipts across 13 service areas, as shown in Table 2a. Figure 3 shows how capital expenditure across these service areas has changed since 2015-16.
In 2019-20, highways & transport, housing, trading and education services continued to attract the majority of local authority capital expenditure, accounting for £19.1 billion (73%) of all capital expenditure. Their patterns compared with 2018-19 were:
- Expenditure on highways & transport services totalled £7.5 billion in 2019-20, down £468 million (6%) in real terms from the previous year. About half of the expenditure was by the Greater London Authority (GLA) and movement from one year to the next in the England total has been driven by changes in spend by the GLA.
- Expenditure on housing services totalled £6.1 billion in 2019-20, up £533 million (10%) in real terms from the previous year. This was driven by increases in expenditure across London Boroughs. Expenditure on housing by London Boroughs was £2.3 billion, £323 million (16%) higher in real terms than in 2018-19.
- Expenditure on trading services totalled £3.3 billion in 2019-20, down £852 million (21%) in real terms from the previous year. This follows a large increase from £566 million in 2015-16 to £4.1 billion in 2018-19 (in 2019-20 prices).
- Expenditure on education services totalled £2.3 billion in 2019-20, down £173 million (7%) in real terms from the previous year. Spending on this area has decreased every year since the introduction of academisation in 2010-11.
Table 3: Local authority total capital expenditure and total capital receipts: provisional and final outturns by service, England, 2019-20
Cash terms table, all monetary figures as reported (£ millions)
| Service | Provisional | Outturn | Change | % Change |
|---|---|---|---|---|
| Education | 2,446 | 2,310 | -136 | -5.6% |
| Highways & Transport | 7,230 | 7,473 | 243 | 3.4% |
| - of which GLA | 3,859 | 3,877 | 18 | 0.5% |
| Social Care | 374 | 371 | -3 | -0.7% |
| Public Health | 29 | 21 | -8 | -27.5% |
| Housing | 5,782 | 6,052 | 270 | 4.7% |
| - of which London Boroughs | 2,254 | 2,295 | 41 | 1.8% |
| - of which GLA | 728 | 785 | 57 | 7.9% |
| Culture & Related Services | 1,170 | 1,242 | 72 | 6.1% |
| Environmental & Regulatory Services | 749 | 712 | -37 | -4.9% |
| Planning & Development Services | 2,040 | 1,891 | -150 | -7.3% |
| Digital Infrastructure | 167 | 139 | -28 | -16.8% |
| Police | 769 | 759 | -10 | -1.3% |
| Fire & Rescue Services | 165 | 163 | -2 | -1.5% |
| Central Services [footnote 8] | 2,160 | 1,881 | -279 | -12.9% |
| Trading [footnote 9] | 2,856 | 3,269 | 413 | 14.5% |
| Total Capital Expenditure | 25,937 | 26,282 | 345 | 1.3% |
| Total Capital Receipts | 2,532 | 2,823 | 292 | 11.5% |
Sources: CPR4 2019-20 and COR 2019-20
4. Difference between 2019-20 provisional and final outturn
Table 3 details the change in the pattern of expenditure on the service categories between provisional and final outturn 2019-20.
Capital Payments Returns (CPR) are collected on a quarterly basis. For the first three quarters (CPR1-3), local authorities only provide all services total figures for capital expenditure and receipts. For the fourth quarter (CPR4), they provide a service level breakdown, financing, and prudential data. CPR4 data are provisional outturn figures.
The level of capital spending varies between CPR4 and COR because local authority accounts are not yet finalised when CPR4 is collected.
Local authorities in England reported £26.3 billion of total capital expenditure at final outturn, £345 million (1%) more than was reported at provisional outturn.
The changes between provisional and final outturn are shown in Table 3 for each service areas. The largest changes compared with 2018-19 were:
- Trading services had the largest positive revision. Final total capital expenditure was £3.3 billion, £413 million (15%) more than the £2.9 billion reported in the provisional release. Typically this category shows more spend at final outturn due to recategorisation as local authorities are reminded to report commercial acquisitions in this category. Other categories, notably central services, show lower spend at final outturn as a result of this.
Final total capital receipts were £2.8 billion, £292 million (12%) more than the £2.5 billion reported in the provisional release.
Table 4a: Financing of local authority capital expenditure by source: final outturn, England, 2015-16 to 2019-20
Real terms series, all monetary figures in 2019-20 prices (£ millions)
| Source | 2015-16 | 2016-17 | 2017-18 | 2018-19 | 2019-20 | |
|---|---|---|---|---|---|---|
| Total capital grants | 11,873 | 10,862 | 8,499 | 9,338 | 8,249 | |
| Grants from central government departments | 9,976 | 8,483 | 6,360 | 7,270 | 6,032 | |
| Grants from European structural & investment funds | 124 | 14 | 28 | 69 | 47 | |
| Grants from private developers & leaseholders, etc. | 1,168 | 1,186 | 1,247 | 1,284 | 1,183 | |
| Grants from non-departmental public bodies [footnote 10] | 552 | 502 | 282 | 301 | 446 | |
| Grants from the National Lottery | 52 | 63 | 75 | 47 | 55 | |
| Grants from Local Enterprise Partnerships [footnote 11] | - | 613 [footnote 12] | 507 | 367 | 485 | |
| Total capital receipts | 2,400 | 2,482 | 2,902 | 3,238 | 2,235 | |
| Total revenue resources | 5,087 | 4,263 | 4,340 | 4,045 | 4,434 | |
| Housing Revenue Account | 847 | 810 | 659 | 628 | 516 | |
| Major Repairs Reserve | 1,984 | 1,752 | 1,707 | 1,753 | 1,805 | |
| General Fund (CERA) | 2,256 | 1,701 | 1,975 | 1,664 | 2,113 | |
| Total prudential borrowing [footnote 13] | 5,201 | 7,243 | 10,545 | 10,160 | 11,493 | |
| Loans & other financial assistance from Local Enterprise [footnote 11] | - | - | 3 | 34 | 27 | |
| Other borrowing & credit arrangements not supported by central government | 5,201 | 7,243 | 10,542 | 10,126 | 11,466 | |
| Total resources used to finance capital expenditure [footnote 14] | 24,560 | 24,850 | 26,287 | 26,780 | 26,411 |
Sources: COR 2015-16 – 2019-20
Figure 4: Financing of local authority capital expenditure in real terms by source, England, 2015-16 to 2019-20
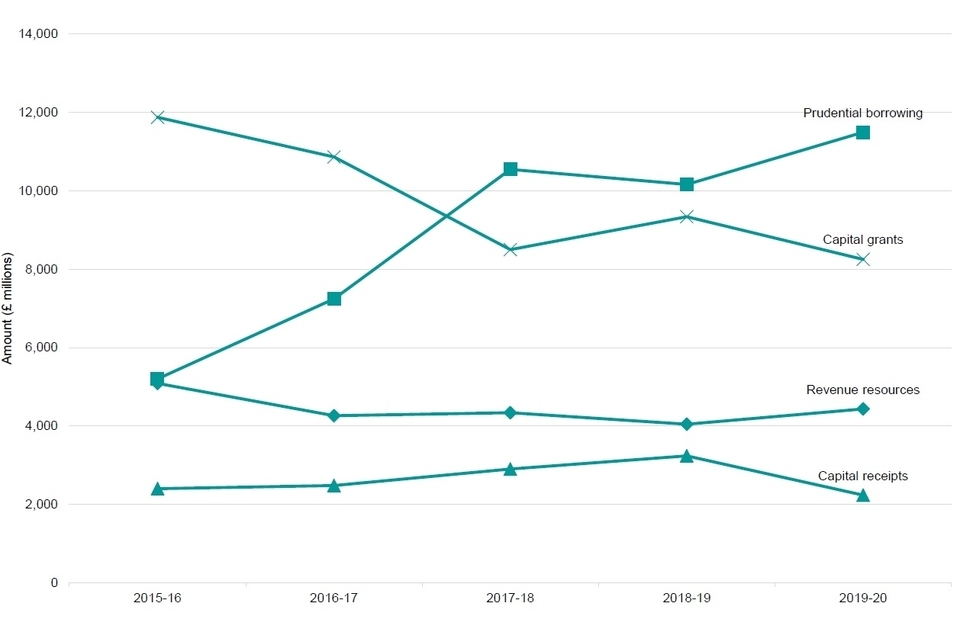
Figure 4: Financing of local authority capital expenditure in real terms by source, England, 2015-16 to 2019-20
5. Financing of capital expenditure
Authorities finance their capital spending in a number of ways. A breakdown of the main elements of local authority capital funding is given below:
- Capital grants are provided by government departments and other organisations. The majority of governmental grants are not ring-fenced, giving authorities’ flexibility to choose how to spend this money, provided it is used for capital purposes.
- Prudential borrowing is borrowing freely undertaken by the local authority within the affordability limits stated by their auditors, as specified in the Local Government Act 2003.
- Capital receipts are from the sale of capital assets.
- Revenue resources can be used by local authorities to support capital spend. There is no restriction on revenue funds being used in this way, although accounting convention prevents capital resources being used to cover revenue spend.
As shown in Figure 4, in comparison to 2015-16, local authorities in England financed a greater proportion of capital expenditure from prudential borrowing and a lesser proportion from capital grants, revenue resources and capital receipts in 2019-20. The amount of expenditure financed from this prudential borrowing doubled since 2015-16.
Prudential borrowing remained the largest source of financing of capital expenditure in 2019-20. It was £1.3 billion (13%) higher in real terms than in 2018-19.
As the second largest type of finance, capital grants totalled £8.2 billion, down £1.1 billion (12%) in real terms from previous year. The use of this source has fallen substantially from a peak of £11.8 billion in 2015-16.
6. Accompanying tables
Symbols used
| : | = Not available |
| 0 | = Zero or negligible |
| - | = Not relevant |
| (F) | = Forecast |
| (R) | = Revision |
Tables
Accompanying tables are available to download alongside this release. These are:
Table 1a: Local authority capital expenditure & other transactions and capital receipts by category: forecast and final outturn, England, 2015-16 to 2019-20 (Real terms table, all monetary figures in 2019-20 prices)
Table 1b: Local authority capital expenditure & other transactions and capital receipts by category: forecast and final outturn, England, 2015-16 to 2019-20 (Cash terms table, all monetary figures as reported)
Table 2a: Local authority total capital expenditure by service: final outturn, England, 2015-16 to 2019-20 (Real terms table, all monetary figures in 2019-20 prices)
Table 2b: Local authority total capital expenditure by service: final outturn, England, 2015-16 to 2019-20 (Cash terms table, all monetary figures as reported)
Table 3: Local authority total capital expenditure and total capital receipts: provisional and final outturns by service, England, 2019-20 (Real terms table, all monetary figures in 2019-20 prices)
Table 4a: Financing of local authority capital expenditure by source: final outturn, England, 2015-16 to 2019-20 (Real terms table, all monetary figures in 2019-20 prices)
Table 4b: Financing of local authority capital expenditure by source: final outturn, England, 2015-16 to 2019-20 (Cash terms table, all monetary figures as reported)
Table 5: Local authority total capital expenditure and total capital receipts: final outturn by service and category, England, 2019-20
Table 6: Local authority prudential system information: final outturn by category, England, 2019-20
Table 7a: Local authority prudential system information: net debt as at 31 March by class of authority, England, 2015-16 to 2019-20 (Real terms table, all monetary figures in 2019-20 prices)
Table 7b: Local authority prudential system information: net debt as at 31 March by class of authority, England, 2015-16 to 2019-20 (Cash terms table, all monetary figures as reported)
Table 8a: Local authority prudential system information: self-financed borrowing by class of authority, England, 2015-16 to 2019-20 (Real terms table, all monetary figures in 2019-20 prices)
Table 8b: Local authority prudential system information: self-financed borrowing by class of authority, England, 2015-16 to 2019-20 (Cash terms table, all monetary figures as reported)
All data in this release are available at local authority level for:
COR A1: Total capital expenditure and receipts, England, 2019-20
COR A2: Further details of capital expenditure on Social Care, Grants & Loans, Roads, Street Lighting & Road Safety, and Section 16(2)(b) Direction, England, 2019-20
COR B: Financing of capital expenditure, England, 2019-20
COR C: Prudential system information, England, 2019-20
COR D: Accumulated capital receipts and Major repairs reserve, England, 2019-20
2019 to 2020 supplementary data: Housing Revenue Account capital receipts, expenditure and financing
All tables and workbooks, as well as related statistical releases, can be accessed at: Local authority capital expenditure, receipts and financing
7. Technical Notes
Please see the accompanying technical notes document for further details. This can be found at: Local authority capital expenditure and receipts in England: 2019 to 2020 final outturn
Information on Official Statistics is available via the UK Statistics Authority website: The UK Statistical System
Information about statistics at MHCLG is available via the Department’s website: Statistics at MHCLG
-
Expenditure which does not fall within the definition of expenditure for capital purposes but is treated as capital expenditure by a direction under section 16(2)(b) of the Local Government Act 2003. ↩ ↩2
-
This figure was revised to correct a misreported value for forecast capital receipts by Milton Keynes Council. ↩ ↩2
-
Expenditure on education services from 2010-11 onwards is not comparable between years due to a number of schools changing their status to become academies from 2010-11, which are centrally funded rather than funded by local authorities. ↩
-
Includes Greater Manchester Waste Disposal Authority’s PFI buy-out (£521 million). ↩
-
Central services include court costs, local tax collection, and other core council services costs (such as IT). Some local authorities report commercial activity within this category. New categories and guidance were issued in Spring 2018 encouraging such expenditure to be recorded under Trading Services. ↩
-
Trading services include the maintenance of direct labour and service organisations, such as civic halls, retail markets and industrial estates, and commercial activity. Care should be taken when comparing across financial years because, a significant amount of commercial acquisitions, was reported under central services in 2016-17; these ought generally to be recorded as trading services. Reporting under the correct categories improved from 2017-18. ↩
-
Total capital expenditure excludes £170 million of transfer to other local authorities that could not be attributed to a specific service area. ↩
-
Central services include court costs, local tax collection, and other core council services costs (such as IT). Some local authorities report commercial activity within this category. New categories and guidance were issued in Spring 2018 encouraging such expenditure to be recorded under Trading Services. ↩
-
Trading services include the maintenance of direct labour and service organisations, such as civic halls, retail markets and industrial estates. ↩
-
Non-Departmental Public Bodies, organisations that are not government departments but which have a role in the processes of national government, such as the Sport England, English Heritage and Natural England. ↩
-
Before 2016-17, grants, loans & other financial assistance from Local Enterprise Partnerships were reported within grants from central government departments. ↩ ↩2
-
Includes loans & other financial assistance from Local Enterprise partnerships. Grants and loans & other financial assistance were not split until 2017-18. ↩
-
The Prudential System, which came into effect on 1 April 2004, allows local authorities to raise finance for capital expenditure - without Government consent - where they can afford to service the debt without extra Government support. ↩
-
From 2017-18 onwards, intra-local government transfers are net off both expenditure and financing. However, as grants and loans made to other local authorities as part of expenditure may not equal the use of grants and loans from other authorities to finance expenditure within a financial year, financing and expenditure may not match. ↩