HM Prison and Probation Service workforce quarterly: March 2026
Published 21 May 2026
Applies to England and Wales

© Crown copyright 2026
This publication is licensed under the terms of the Open Government Licence v3.0 except where otherwise stated. To view this licence, visit nationalarchives.gov.uk/doc/open-government-licence/version/3 or write to the Information Policy Team, The National Archives, Kew, London TW9 4DU, or email: psi@nationalarchives.gov.uk.
Where we have identified any third party copyright information you will need to obtain permission from the copyright holders concerned.
This publication is available at https://www.gov.uk/government/statistics/hm-prison-probation-service-workforce-quarterly-march-2026/hm-prison-and-probation-service-workforce-quarterly-march-2026
Main Points
| 65,038 FTE (full time equivalent) staff in post | This is a slight increase of 269 FTE (0.4%) of staff in post compared to 31 March 2025 and of 924 FTE (1.4%) since 31 December 2025. Public Sector Prisons have decreased by 775 (2.1%), although probation staff increased by 742 (3.5%). Of the staff in post, there were 35,930 FTE in Public Sector Prisons (PSP), 21,765 FTE staff in the Probation Service, 6,025 FTE staff in HQ and Frontline Support, and 1,318 FTE in the Youth Custody Service (YCS). |
| 21,984 FTE band 3-5 prison officers in post | This is a decrease of 732 FTE (3.2%) since 31 March 2025 and of 84 FTE (0.4%) prison officers compared to 31 December 2025. |
| 5,445 FTE band 2 operational support staff in post | This is a slight increase of 21 FTE (0.4%) since 31 March 2025 and of 92 FTE (1.7%) since 31 December 2025. |
| 5,573 FTE band 4 probation officers in post | This is a slight decrease of 84 FTE (1.5%) since 31 March 2025 but an increase of 119 FTE (2.2%) compared to 31 December 2025. In addition to the band 4 probation officers, there were 5,785 FTE band 3 probation services officers: an increase of 532 FTE (10.1%) since 31 March 2025 and of 386 FTE (7.1%) since 31 December 2025. |
| Leaving rate of 9.8% amongst band 3-5 prison officers | This is a decrease of 2.7 percentage points compared to the year ending 31 March 2025. The overall leaving rate across HMPPS over the past year stood at 9.1%, which is a decrease of 1.7 percentage points compared to the year ending 31 March 2025 of 10.7%. |
| Leaving rate of 5.7% amongst band 4 probation officers | This is a decrease of 1.6 percentage points compared to the year ending 31 March 2025. The leaving rate of band 3 probation services officers over the past 12 months was 10.1%, which is a slight decrease compared to 10.2 for the year ending 31 March 2025. |
This publication provides details of staffing levels, staff inflows and outflows, sickness absence rates, and protected characteristics for the directly employed workforce of HMPPS. Information presented covers PSP, the Probation Service, the YCS, HMPPS headquarters, and Frontline Support which provides direct operational support. Technical details and explanatory notes can be found in the accompanying Guide to HM Prison and Probation (HMPPS) Workforce Statistics.
Statistician’s comment
In this publication we are reporting on the HMPPS workforce as at 31 March 2026.
As at 31 March 2026, there were 65,038 FTE staff in post which was an increase of 269 FTE compared to March 2025. This increase was mainly due to increases in the Probation Service which saw an increase of 742 FTE (3.5%), and HQ and Frontline Support which saw an increase of 353 FTE (6.2%). However, these increases were partially offset by a decrease of 775 FTE (2.1%) in the Prison Service, and 52 FTE (3.8%) in Youth Custody Service staff. Since 31 December 2025, there has been an increase of 924 FTE staff in post (1.4%) across HMPPS, again driven by an increase in Probation Service (3.6%) and HQ and Frontline Support staff (3.1%).
Most Probation Service grades saw an increase over the last year with there being an increase of 532 FTE (10.1%) probation services officers as well as increases for other band 4-6 staff (9.1%), senior probation officers (4.6%) and other band 1-3 staff (1.5%). As at 31 March 2026, 5,573 FTE band 4 probation officers were in post which is a decrease of 84 (1.5%) compared to March 2025 but an increase of 119 FTE (2.2%) compared to December 2025. For the 2026/27 financial year, the department has committed publicly to onboarding at least 1,300 Trainee Probation Officers and will confirm whether it has met that commitment in the April 2027 transparency release.
There were 21,984 FTE band 3-5 prison officers in post in March 2026, which is a decrease of 732 FTE (3.2%) compared to March 2025 but there was an increase of 21 FTE (0.4%) in band 2 operational support staff in post over the same period.
The overall leaving rate across HMPPS was 9.1% in the 12 months to 31 March 2026, representing a decrease of 1.7 percentage points compared to the year ending March 2025. In the 12 months to 31 March 2026, there was a total of 6,317 staff who left HMPPS, which is a decrease of 1,249 (16.5%) compared to the year ending 31 March 2025.
Points to note
HM Prison and Probation Service
HMPPS is focused on supporting operational delivery and the effective running of prison and probation services across the public and private sectors. HMPPS works with a number of partners to carry out the sentences given by the courts, either in custody or the community. This publication covers the reporting period up to 31 March 2026 and therefore considers in detail quarterly staffing levels and staff inflows and outflows, for HMPPS and its predecessors, since 1 April 2019.
For ease, the statistics in this publication will be referred to as those of the HMPPS workforce (i.e. staff working in HMPPS and with a contract of employment with HMPPS, excluding all staff who were not an active member of the workforce and receiving pay on the relevant date from our staff in post counts, and those on secondment or loan outside of HMPPS but including staff on secondment or loan into HMPPS).
Staff employed by private sector establishments and other contractors are excluded. Community Rehabilitation Companies (CRCs) were private-sector suppliers of Probation and Prison-based rehabilitative services for offenders in England and Wales. In late June 2021, more than 7,000 staff from the CRCs came together with probation staff already in the public sector to form the new Probation Service. Prior to this movement, staff employed by CRCs were excluded.
Annex on HMPPS recruitment diversity
This annex, with official statistics in development, presents figures on Prison Officer and operational support grade (OSG) recruitment by diversity characteristics. From June 2021, recruitment statistics were introduced for HMPPS overall, HMPPS HQ and Frontline Support, Public Sector Prisons (including the YCS) and the Probation Service. This annex runs on a six-monthly production cycle and is only included in the June and December editions.
Annex on Prison and Probation Officer Recruitment
As of the June 2019 publication, this annex has been added to this bulletin which presents figures on probation officers in post, and their required staffing level, in addition it shows the number of trainee and qualified probation officers. Following on from the March 2024 publication, we have published quarterly hours adjusted Staff in Post, Target Staffing and Difference at establishment level for band 3-5 prison officers.
There is an annual transparency publication, called ‘Trainee Probation Officer starters’ published in the first week of April each year to confirm the number of Trainee Probation Officers onboarded into HMPPS for the previous financial year. A more detailed breakdown of those onboarded will continue to be provided in the mid-May publication of the Prison and Probation Officer Recruitment Annex.
Annex on ‘Great Place to Work for Veterans’ recruitment
This annex was introduced in 2022 and presents figures on staff recruited as part of the ‘Great Place to Work for Veterans’ recruitment campaign. This campaign started in April 2022. It is a simple one table annex and is repeated biannually, in the March and September publications. All externally advertised roles, at all grades across MoJ, utilise the Great Place to Work for Veterans scheme. This scheme allows eligible veterans to opt into the scheme, providing the opportunity for a guaranteed interview if they meet the minimum sift standard for that vacancy. Further information can be found at: https://www.civil-service-careers.gov.uk/great-place-to-work-for-veterans/
Annex showing the quarterly staff in post time series from March 2017
An annex containing the main breakdowns of staff in post for each quarter from March 2017 through to the latest data has been added from the December 2025 publication. This is so any hierarchy or grade mapping changes can be reflected in each historical quarterly data point and not just the quarters that are shown in the main tables.
Annex showing HMPPS ethnic minority representation
From the March 2026 publication an annex showing the self-reported ethnicity of staff in each prison and prison/probation region has been included and that this replaces the data that was previously published in the HMPPS Digest. This annex will be produced annually as part of the March publication.
Organisational Changes in last two years
-
From the December 2024 publication the Approved Premises teams have been grouped into one Approved Premises region rather than having the 7 different AP regions separately.
-
From December 2024 publication the prison regions for Midlands have been updated from three prison regions to two, East Midland and West Midlands. The prisons in each region can be found in the Technical Guide.
-
Lowdham Grange came into the public sector prison from the private sector on 1 August 2024. As at 30 September 2024 their staff accounted for 393 FTE, of which 254 FTE were band 3-5 prison officers.
-
The prison functions were updated in the September 2024 publication to align with the latest prison categories.
-
In June 2024 Cookham Wood was repurposed as an adult prison for category C males, but this change was not reflected in the June 2024 publication. This change was made in the September 2024 publication and all historical data was amended to reflect this change as well.
-
In the June 2024 publication the prison region Tees & Wear was renamed to North East and the prison region Long Term & High Security was split into two regions: Long Term & High Security North and Long Term & High Security South.
-
Since the June 2024 publication, Area Services has been renamed as Frontline Support following the introduction of the OneHMPPS programme.
1. Total HMPPS staff in post
65,038 FTE staff in post (as at 31 March 2026)
This is a slight increase of 269 FTE (0.4%) of staff in post compared to 31 March 2025 and of 924 FTE (1.4%) since 31 December 2025. Of the staff in post, there were 35,930 FTE in Public Sector Prisons (PSP), 21,765 FTE staff in the Probation Service, 6,025 FTE staff in HQ and Frontline Support, and 1,318 FTE in the Youth Custody Service (YCS).
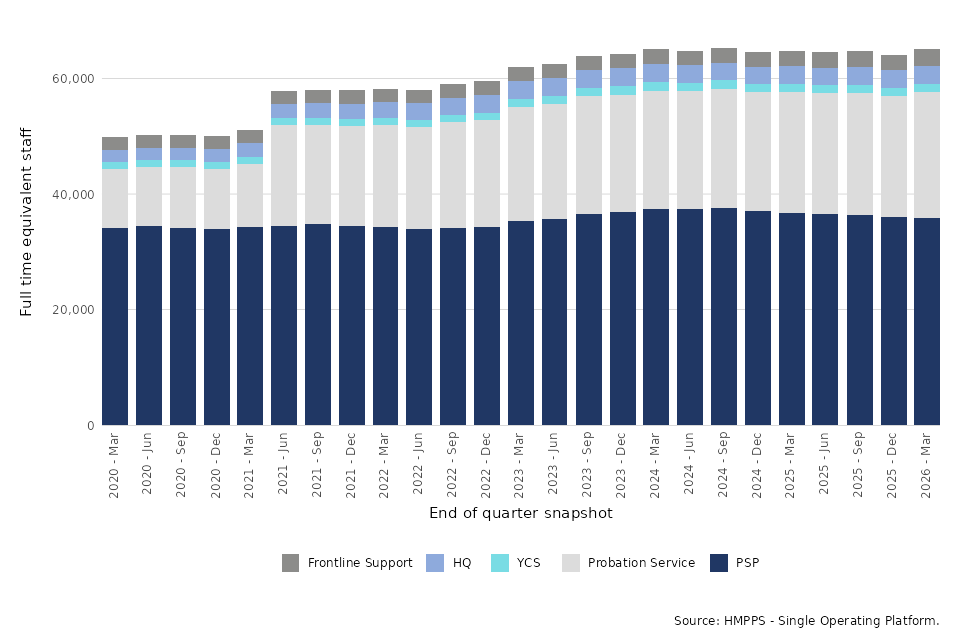
As at 31 March 2026, there were 65,038 full time equivalent (FTE), staff in post in HMPPS (Figure 1). This includes 35,930 FTE staff in PSP (55.2% of HMPPS staff), 21,765 FTE in the Probation Service (33.5% of HMPPS staff), 6,025 FTE in HMPPS HQ and Frontline Support (9.3% of HMPPS staff), and 1,318 FTE in the YCS (2.0% of HMPPS staff).
Compared to 31 March 2025, the overall staff numbers remained broadly consistent,although the different parts of HMPPS saw different staffing changes: FTE in PSP decreased by 775 (2.1%). FTE in the Probation Service increased by 742 (3.5%), FTE in HQ and Frontline Support increased by 353 (6.2%), and FTE in the YCS decreased by 52 (3.8%).
As at 31 March 2026, there were 28,420 FTE (43.7% of HMPPS staff) operational Prison Service staff (including YCS staff). This is a decrease of 801 FTE staff (2.7%) compared to 31 March 2025. Non-operational roles across PSP, YCS, and HMPPS HQ accounted for 14,438 FTE staff (22.2% of HMPPS staff), which is an increase of 286 FTE (2.0%) since 31 March 2025. There were 22,180 FTE staff[footnote 1] in Probation Service grades (34.1% of HMPPS staff): an increase of 784 (3.7%) FTE since 31 March 2025.
Figure 1 shows a big increase in Probation Service staff in June 2021, which was due to more than 7,000 staff from private sector CRCs coming together with probation staff already in the public sector in the new Probation Service.
Figure 1: Number of HMPPS staff in post on an FTE basis, 31 March 2020 to 31 March 2026 (Source: Table 1)
1.1 Length of Service
Across HMPPS overall, 27.7% of FTE staff in post had less than 3 years’ service, which was a decrease from 33.3% at 31 March 2025 and from 29.5% at 31 December 2025. 33.2% of HMPPS FTE staff in post had 10 years or more experience, representing no substantial change since 31 December 2025.
The proportion of band 3-5 prison officers with less than 3 years’ service at 31 March 2026 fell to 30.8% compared to 37.5% as at 31 March 2025. The proportion of band 3-5 prison officers in post with 10 years or more experience remained broadly the same between 31 March 2025 and 31 March 2026, and stands at 25.1%. This corresponds to 5,512 FTE staff with 10 years or more experience at 31 March 2026.
The proportion of band 2 OSG FTE staff with less than 3 years’ service decreased from 49.6% at 31 March 2025 to 43.3% at 31 March 2026, and the proportion of those with 10 years or more experience decreased from 23.4% at 31 March 2025 to 22.8% at 31 March 2026.
It should be noted that the National Probation Service was created on 1 June 2014 and service prior to this is not captured in our data. Therefore, the figures relating to the length of service of Probation Service staff, which are included in the HMPPS overall figures, do not necessarily represent their full experience but rather the length of service from entry to HMPPS. The situation is different for the over 7,000 staff who transferred from the CRCs in June 2021 and for them their service prior to their date of transfer is included.
Length of service information has been calculated for HMPPS staff from the most recent hire date. Where staff have transferred in from another government department or have transferred in through HMPPS taking over a function, length of service is calculated from entry to HMPPS.
2. Band 3-5 prison officers and band 2 operational support staff
21,984 FTE band 3-5 prison officers in post (as at 31 March 2026)
This is a decrease of 732 FTE (3.2%) since 31 March 2025 and of 84 FTE (0.4%) prison officers, compared to 31 December 2025. The overall resourcing picture across the prison workforce is broadly stable. However, there are some challenges with staff experience at a national level, as well as persistent recruitment and retention challenges in certain areas of the country.
5,445 FTE band 2 operational support staff in post (as at 31 March 2026)
This corresponds to a slight increase of 21 FTE (0.4%) since 31 March 2025 and 92 FTE (1.7%) operational support staff since 31 December 2025.
The key operational grades in public sector prisons are the band 3-5 prison officers. They consist of band 3 prison officers, band 4 officer specialists, band 4 supervising officers, and band 5 custodial managers.
Figure 2: Number of band 3-5 prison officers in post on an FTE basis, 31 March 2020 to 31 March 2026 (Source: Table 3)
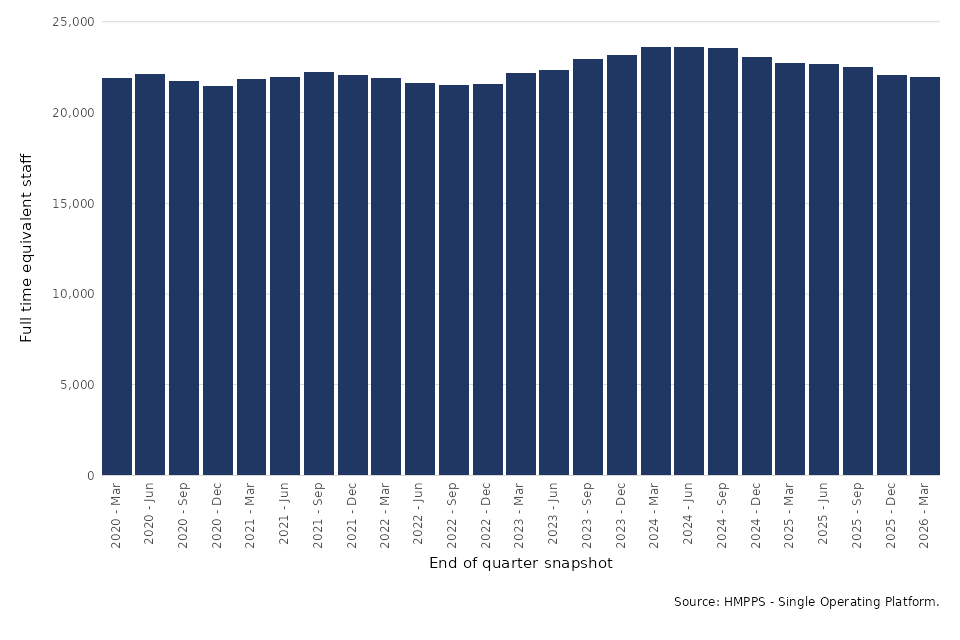
Figure 3 shows a quarterly trend of band 3-5 appointments and leavers since 2019/20. Over the year to 31 March 2026, 2,305 band 3-5 officers were appointed (consisting of direct new recruits and existing staff who converted to a band 3 officer grade), a decrease of 321 (12.2%) compared to 2,626 in the previous year. Looking at the quarterly figures, the headcount of new band 3-5 officer appointments increased by 238 (73.0%) from 326 between October and December 2025 to 564 between January and March 2026 (Table 17).
The headcount of band 3-5 prison officers who left HMPPS in the year ending 31 March 2026 was 2,312, which is a decrease of 743 (24.3%) compared to the year ending 31 March 2025. Examining reasons for leaving, 60.9% of prison officers who left in the year ending 31 March 2026 resigned from their roles (down from 66.3% in the year ending 31 March 2025). Of the other prison officers who left HMPPS in the year ending 31 March 2026, 24.9% were dismissed and 7.9% retired; the proportion dismissed is up from 21.1% compared to previous year while the number retiring is down from 6.2%.
Figure 3: Newly appointed band 3-5 prison officers and band 3-5 prison officer leavers, April 2019 to 31 March 2026 (Source: Table 17)

Joiners and leavers are not the only movements into and out of the band 3-5 officer grouping. There are also typically differences in the proportion of new joiners and older officers who work part time as well as movements between grades, such as internal movements to non-frontline roles or promotions to operational managers. Changes such as staff switching from full time to part time also have the effect of reducing the FTE of officers available as they progress through their career. For these reasons, the change in FTE does not directly reflect the difference between the number of joiners and leavers.
The number of band 2 OSG staff who joined HMPPS in the year ending 31 March 2026 was 1,072: an increase of 98 (10.1%) compared to the previous year ending 31 March 2025. There was an increase of 110 (11.4%) since the year ending 31 December 2025. The number of band 2 OSG staff who left HMPPS was 722, which is a decrease of 155 (17.7%) compared to the year ending 31 March 2025 and of 48 (6.2%) compared to the year ending 31 December 2025.
3. Probation practitioners and senior probation officers
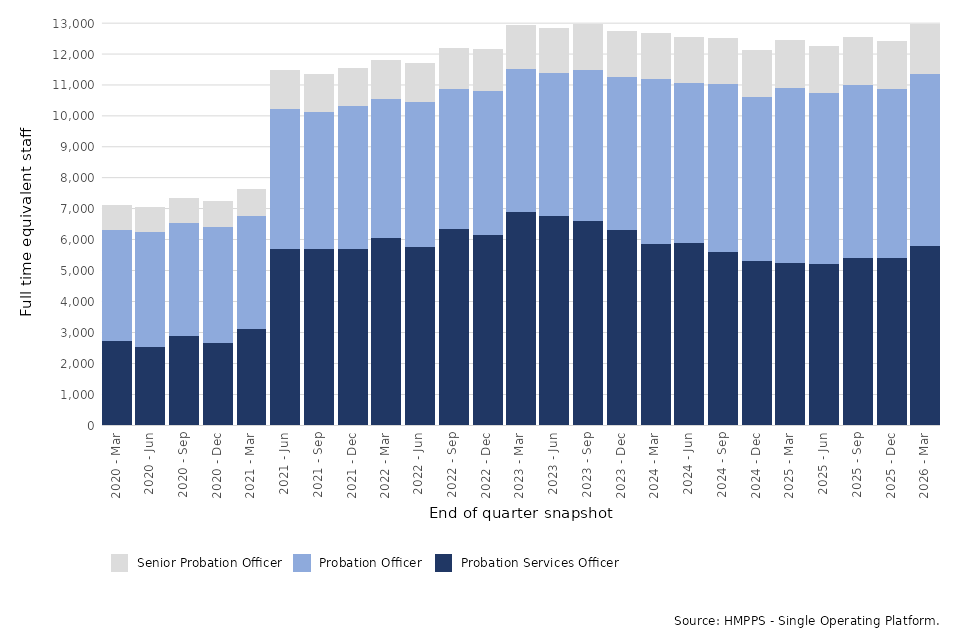
5,573 FTE band 4 probation officers in post (as at 31 March 2026)
This figure is a slight decrease of 84 FTE (1.5%) since 31 March 2025 but an increase of 119 FTE (2.2%) probation officers compared to 31 December 2025. In addition to the band 4 probation officers, there were 5,785 FTE band 3 probation services officers: an increase of 532 FTE (10.1%) since 31 March 2025 and of 386 FTE (7.1%) since 31 December 2025.
Key grades in the Probation Service include band 3 probation services officers, band 4 probation officers (collectively known as probation practitioners), as well as band 5 senior probation officers. Staff who are training to be a probation officer work as a probation services officer during their training, so a proportion of the probation services officers in post will be working towards the professional probation officer qualification.
In the June 2019 publication a statistics annex was added to this bulletin which presents figures on the number of trainee and qualified probation officers in post, alongside required staffing levels.
As at 31 March 2026, there were 5,785 FTE band 3 probation services officers in post, an increase of 532 FTE (10.1%) over the past year and an increase of 386 FTE (7.1%) over the quarter. For the 2026/27 financial year, the department has committed publicly to onboarding at least 1,300 Trainee Probation Officers and will confirm whether it has met that commitment in the April 2027 transparency release. There were 5,573 FTE band 4 probation officers, representing a slight decrease of 84 FTE (1.5%) over the past year but an increase of 119 FTE (2.2%) compared to the previous quarter; and 1,604 FTE band 5 senior probation officers, showing an increase of 70 (4.6%) over the previous year and of 39 (2.5%) since the last quarter (Figure 4).
Figure 4: Number of probation officers, probation services officers and senior probation officers in post on an FTE basis, 31 March 2020 to 31 March 2026 (Source: Table 3)
In the past year, 1,445 probation services officers were appointed, some of whom will be training to become qualified probation officers. This is an increase of 221 (18.1%) compared to the year ending 31 March 2025 and of 194 (15.5%) compared to the number appointed in the year ending 31 December 2025.
Within the Probation Service, there were 5,554 FTE probation officers in post, a shortfall of 1,556 FTE against the target staffing level of 7,110 FTE. There were 2,128 staff, equivalent to 2,092 FTE, undertaking the PQiP training as of 31 March 2026. The shortfall in probation officers has decreased relative to the December release due to an increase in probation officer staff in post. Over the same period, probation officer target staffing remained unchanged (please refer to the Prison and Probation Officer Recruitment Annex for more details).
In the past year, 586 probation services officers left the service. This is a decrease of 28 (4.6%) compared to the year ending 31 March 2025 but an increase of 37 (6.7%) compared to the number who left in the year ending 31 December 2025.
4. Joiners and Leavers
Leaving rate of 9.8% amongst band 3-5 prison officers (for the 12 months ending 31 March 2026)
This is a decrease of 2.7 percentage points compared to the year ending 31 March 2025. The overall leaving rate across HMPPS over the past year stood at 9.1%, which is a decrease of 1.7 percentage points compared to the year ending 31 March 2025 of 10.7%
Over the past year, 6,677 staff joined HMPPS, which is a decrease of 512 (7.1%) compared to the year ending 31 March 2025. In recent years, HMPPS has introduced recruitment strategies to address staffing gaps through initiatives that aim to attract wider candidates to the role, and strengthen experience. HMPPS will continue to apply these strategies as required to address local labour market challenges.
The joiners consisted of 3,446 across PSP, 139 in the YCS, 2,772 in the Probation Service, and 320 in HMPPS HQ and Frontline Support. Compared to the year ending 31 March 2025, these numbers of joiners represent a decrease of 13.4% for PSP, of 25.7% for YCS, of 0.5% for Probation Service, but an increase of 35.0% for HMPPS HQ and Frontline Support. There were 1,389 Trainee Probation Officers starting PQiP training in the Probation Service in 2025/26, compared to 1,057 in 2024/25 (please refer to the Prison and Probation Officer Recruitment Annex for more details).
There was a decrease of 1,249 (16.5%), leavers across HMPPS compared to the year ending 31 March 2025, with 3,839 leavers from PSP (a decrease of 19.5%), 173 from YCS (a decrease of 24.5%), 1,994 from the Probation Service (a decrease of 8.7%), and 311 from HMPPS HQ and Frontline Support (a decrease of 18.8%).
4.1 Leaving Rates[footnote 2]
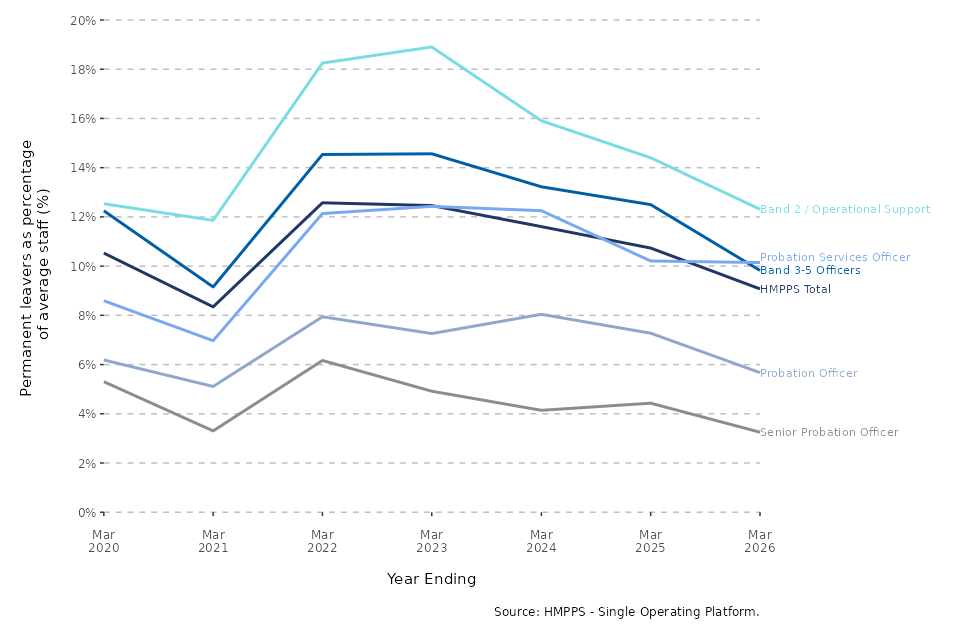
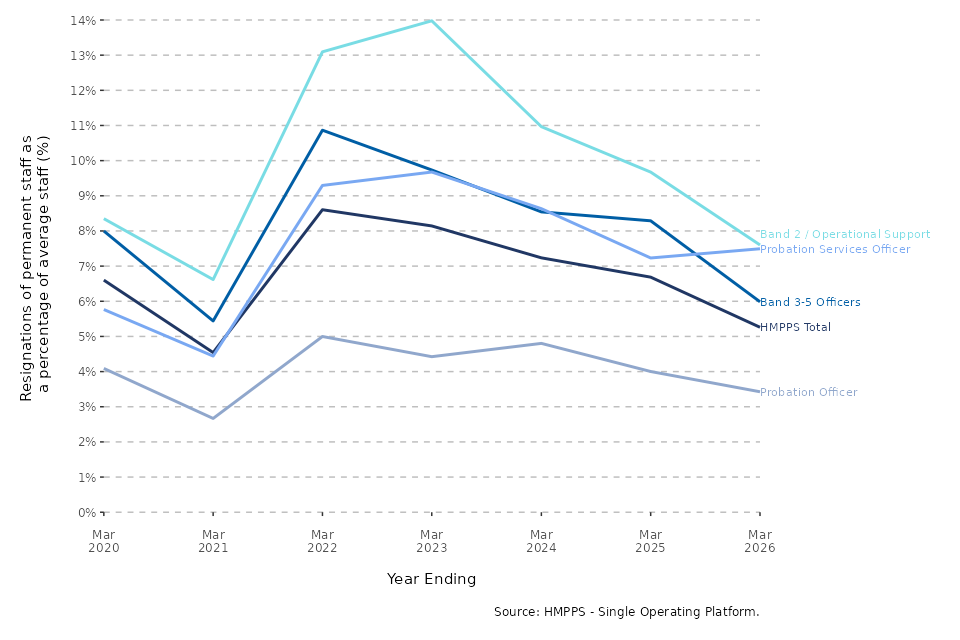
The overall HMPPS leaving rate for the year to 31 March 2026 was 9.1% compared to 10.7% for the year to 31 March 2025 (Figure 5); a decrease of 1.7 percentage points. For the year up to 31 March 2021, the increased uncertainty in the employment market following the COVID-19 pandemic may have contributed to the drop in the number of resignations during most of the year, therefore impacting on the overall reduced leaving and resignation rates. Most grades have shown a decrease over the last 3 years and the latest leaving rates for most grades are similar to pre-pandemic levels.
The leaving rate for staff in the Probation Service overall in the year ending 31 March 2026 was 8.6%, which is a decrease of 1.0 percentage point since the year ending 31 March 2025. In the operational grades within the Probation Service, the leaving rate was highest amongst probation services officers at 10.1%: which was a slight decrease of 0.1 percentage points from the year ending 31 March 2025. Leaving rates for probation officers and senior probation officers stood at 5.7% (a decrease of 1.6 percentage points) and 3.3% (a decrease of 1.2 percentage points), respectively, compared to the year to 31 March 2025.
Figure 5: Annual leaving rates of permanent staff in key operational grades (excluding VEDSR), from the 12 months to 31 March 2020 to the 12 months to 31 March 2026 (Source: Table 11)
4.2 Resignation Rates[footnote 3]
The overall HMPPS resignation rate for the 12 months to 31 March 2026 was 5.3%, compared to 6.7% for the year to 31 March 2025 (Figure 6). For band 3-5 officers, the resignation rate was 6.0% in the year ending 31 March 2026, which is a decrease of 2.3 percentage points since the year ending 31 March 2025. The resignation rate for OSG staff was 7.6% for the year ending 31 March 2026, which is a decrease of 2.1 percentage points since the year ending 31 March 2025.
For the Probation Service grades the resignation rate was 5.4% for the year ending 31 March 2026. This represents a decrease of 0.7 percentage points compared to the year ending 31 March 2025. Amongst the operational grades within the Probation Service, probation services officers had the highest resignation rate at 7.5%.
Figure 6: Annual resignation rates of permanent staff in key operational grades, from the 12 months to 31 March 2020 to the 12 months to 31 March 2026 (Source: Table 12)
5. Sickness absence
HMPPS staff lost an average of 12.4 working days to sickness absence in the 12 months ending 31 March 2026
This represents an increase of 0.6 Average Working Days Lost (AWDL) compared to the year ending 31 March 2025 (11.8 working days lost).
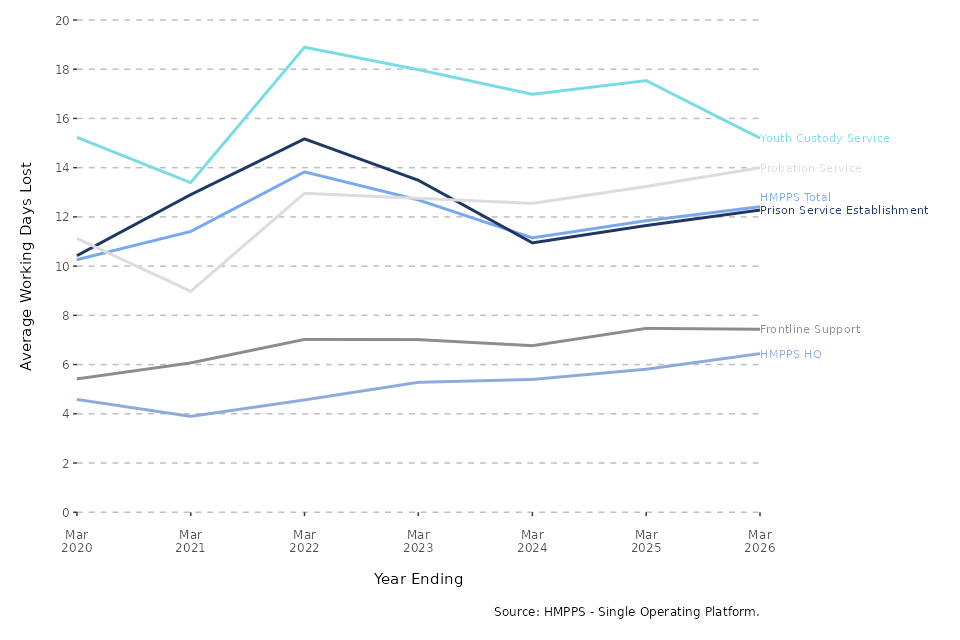
In the year ending 31 March 2026, HMPPS staff lost an average of 12.4 working days to sickness absence. This is an increase from 11.8 average working days lost for the year ending 31 March 2025, and an increase of 2.2 days compared to the predominantly COVID-19 free year ending 31 March 2020.
YCS staff had the highest sickness absence rate at 15.2 AWDL, followed by the Probation Service (14.0 AWDL), PSP (12.3 AWDL), and HQ and Frontline Support (6.9 AWDL) (Figure 7). Compared to the year ending 31 March 2025, these represent a decrease of 2.3 days for YCS, an increase of 0.8 days for Probation Service, an increase of 0.6 days for PSP, and an increase of 0.3 days for HQ and Frontline Support staff.
Figure 7: Average working days lost to sickness absence, 12 months to 31 March 2020 to 12 months to 31 March 2026 (Source: Table 18)
The most common category of sickness absence in terms of days lost was mental ill health, corresponding to 42.9% of working days lost in the past year. This category was most prevalent for probation officers, where 60.2% of working days lost were attributed to mental ill health.
For HMPPS overall the category that accounted for the second largest proportion of working days lost was musculoskeletal system (17.7%). Together the top two categories accounted for 60.6% of all working days lost.
6. Equality and Diversity
Data on the protected characteristics of ethnicity, disability, sexual orientation, and religion/belief are collected from self-reported, non-compulsory fields. Consequently, only figures for which self-reported rates have reached a threshold of 60% or above have been reported in the following section. Representation rates show the percentage within a specified category out of all those who have reported (i.e. excluding those who have not responded or those who have indicated they do not wish to provide their information).
For staff in post as at 31 March 2026 the main representation rates were as follows; 55.2% of staff were female, 18.0% were from ethnic minority backgrounds, 18.0% were disabled, 8.1% were Lesbian, Gay, Bisexual and Other (LGBO) and 9.6% were non-Christian.
For new staff joining in the 12 months to 31 March 2026 the main representation rates were as follows; 52.6% of staff were female, 41.3% were from ethnic minority backgrounds, 11.2% were disabled, 9.1% were LGBO and 12.5% were non-Christian.
For staff leaving in the 12 months to 31 March 2026 the main representation rates were as follows; 51.1% of staff were female, 21.7% were from an ethnic minority background, 20.1% were disabled, 8.3% were LGBO and 10.9% were non-Christian.
6.1 Age
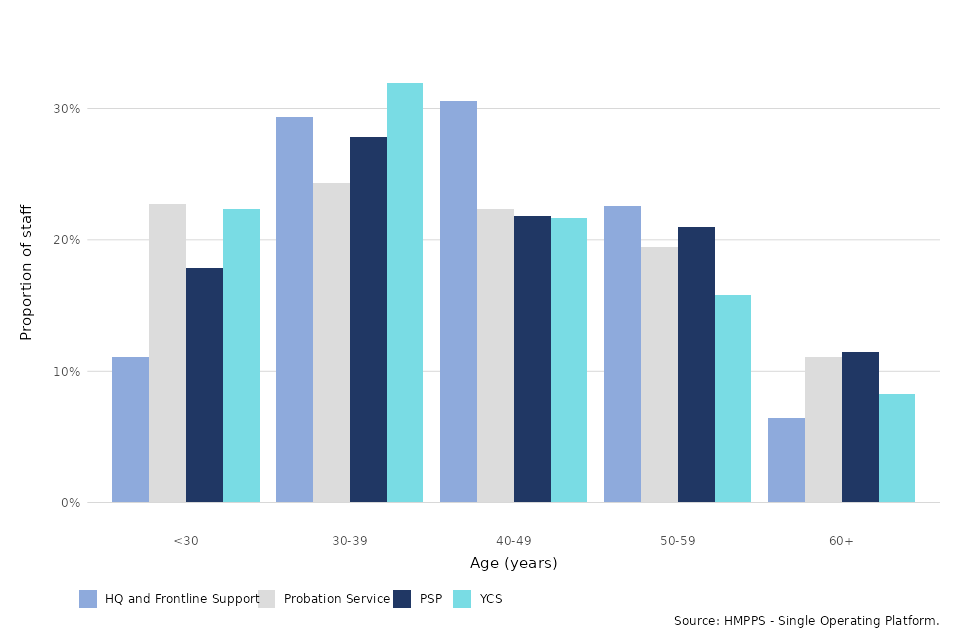
The largest individual age group across all of HMPPS at 31 March 2026 was 30-39 year olds with 18,597 staff (26.9%). The number of staff aged under 30 decreased by 740 in the 12 months to 31 March 2026 compared to the previous year and made up 19.0% of the HMPPS workforce. HQ and Frontline Support had the oldest workforce, consisting of 59.6% of staff who were aged 40 or over. This is compared to 54.3% among PSP staff, 52.9% among Probation Service staff, and 45.7% among YCS staff. Those aged under 30 make up the highest proportion of joiners (43.6%) overall, and those aged under 30 make up the highest proportion of leavers (25.7%) overall.
Figure 8: Age of HMPPS staff, as at 31 March 2026 (Source: Table 5)
6.2 Gender
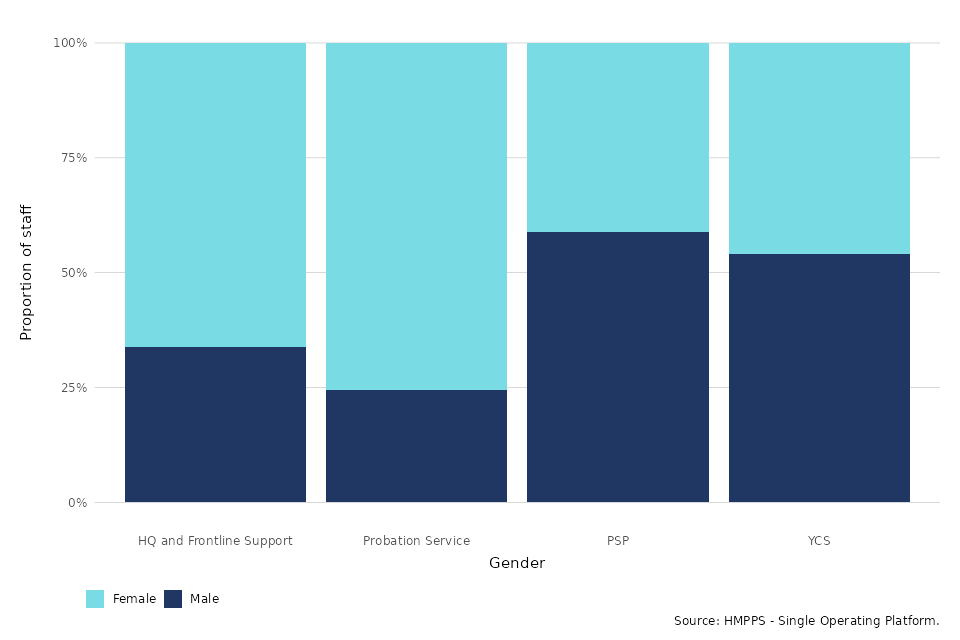
As at 31 March 2026, 55.2% of HMPPS staff overall were female, which is no substantial change compared to the previous year. Female representation was highest within the Probation Service at 75.5%, compared to 66.2% in HQ and Frontline Support, 45.9% in the YCS, and 41.2% in PSP. Across all of HMPPS, over the 12 months to 31 March 2026, 52.6% of joiners and 51.1% of leavers were female. The MoJ HR system holds demographic data on staff. In the HR system there is a database field called Gender. The Gender field is sex or legal gender and can only be one of two options – male or female. It is filled in for all staff when new staff records are created using details to confirm identity (i.e. name, date of birth, address) from official documentation supplied by the successful job applicant. However, it is possible for members of staff to later update this data field themselves if they want to without having to provide a Gender Recognition Certificate. The Office for Statistics Regulation recognises that this is an evolving area both for society and statistics, so advice and guidance is likely to change over time.
Figure 9: Gender of HMPPS staff, as at 31 March 2026 (Source: Table 5)
6.3 Full time/part time status
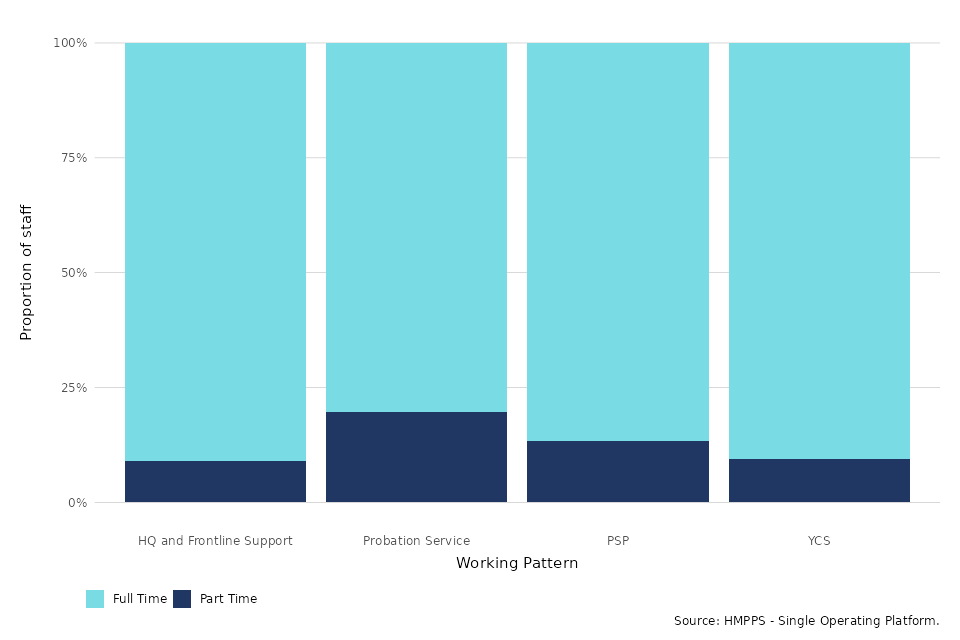
Full time/part time is a status that may fluctuate across an individual’s career. Part time as a grouping covers a wide range of working patterns and working hours. Within HMPPS overall, 15.1% of the workforce were identified as working part time, representing no substantial change compared to the previous year. Working on a part time basis is more common amongst staff in the Probation Service. As at 31 March 2026, 19.6% of Probation Service staff were working part time, compared to 13.5% of staff in PSP, 9.5% of staff in YCS, and 8.9% of staff in HQ and Frontline Support. Only 6.5% of joiners worked on a part time basis, which is to be expected given this period usually marks the start of an individual’s career, whilst 22.5% of leavers were recognised as having part time status.
Figure 10: Working pattern of HMPPS staff, as at 31 March 2026 (Source: Table 5)
6.4 Ethnicity
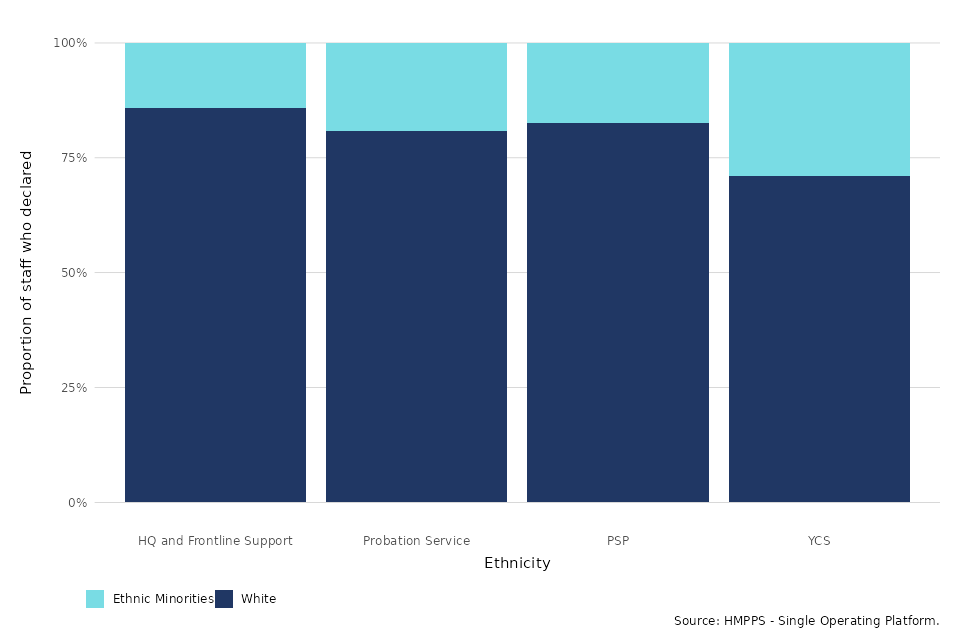
As at 31 March 2026, 18.0% of HMPPS staff who had reported their ethnicity were from ethnic minority backgrounds, which is an increase of 1.9 percentage points compared to the previous year. HQ and Frontline Support had the lowest representation rate with 14.2% of staff who reported their ethnicity being from ethnic minority backgrounds (a slight increase of 0.6 percentage points since 31 March 2025), compared to 17.5% of staff in PSP (an increase of 2.9 percentage points since 31 March 2025), 19.2% of staff in Probation Service (no substantial change since 31 March 2025), and 29.0% of staff in YCS (an increase of 2.5 percentage points since 31 March 2025). In the 12 months to 31 March 2026, 21.7% of leavers across all of HMPPS who had reported their ethnicity were from ethnic minority backgrounds.
Figure 11: Ethnicity of HMPPS staff, as at 31 March 2026 (Source: Table 5)
6.5 Other Protected Characteristics
As at 31 March 2026, 18.0% of HMPPS staff who had reported their disability status were disabled. YCS had the lowest representation rate with 13.2% of staff who reported their disability status being disabled, compared to 13.8% of staff in PSP, 17.5% of staff in HQ and Frontline Support, and 25.1% of staff in Probation Service. In the 12 months to 31 March 2026, 11.2% of joiners and 20.1% of leavers across all of HMPPS who had reported their disability status were disabled.
As at 31 March 2026,Lesbian, Gay, Bisexual and Other (LGBO) staff represented 8.1% of HMPPS staff who had reported their sexual orientation. HQ and Frontline Support had the lowest representation rate with 7.4% of staff who reported their sexual orientation identifying as LGBO, compared to 7.5% of staff in YCS, 7.8% of staff in PSP, and 8.7% of staff in Probation Service. In the 12 months to 31 March 2026, 9.1% of joiners and 8.3% of leavers across all of HMPPS who had reported their sexual orientation were LGBO.
As at 31 March 2026, 9.6% of HMPPS staff who had reported their religion or belief followed another (non-Christian) religion. PSP had the lowest representation rate with 8.3% of staff following a non-Christian religion, compared to 9.3% of staff in HQ and Frontline Support, 11.5% of staff in Probation Service, and 13.1% of staff in YCS. In the 12 months to 31 March 2026, 12.5% of joiners and 10.9% of leavers across all of HMPPS who had reported their religion were non-Christian.
No data are currently presented or available for the other protected characteristics of Marriage and Civil Partnership, Pregnancy and Maternity.
Data are not collected for Gender Reassignment as those in receipt of gender recognition certificates are recorded as their legal gender, and are not identified as being transgender in accordance with the Gender Recognition Act 2004 and the Equality Act 2010.
Further Information
Accompanying files
As well as this bulletin, the following products are published as part of this release:
-
A range of tables showing more detailed breakdowns of the staff in post, starters, leavers and sickness data covered in the bulletin.
-
A spreadsheet of data showing the quarterly staff in post data back to March 2017.
-
A new annex presenting statistics of staff in post by self-reported ethnicity in Probation Service regions and Public Sector Prisons and the Youth Custody Service, by prison and region.
-
A technical guide providing details of the HMPPS workforce structure as well as how the data are collected and processed. Information on the revisions policy and disclosure relevant to HMPPS staffing data is also included.
-
A supplementary annex presenting statistics on the staff recruited as part of the ‘Great Place to Work for Veterans’ recruitment campaign.
-
A supplementary annex presenting statistics on probation officers in post, their required staffing level, and the number of trainee and qualified probation officers. In addition, it includes published quarterly hours adjusted Staff in Post, Target Staffing and Difference at establishment level for Band 3-5 Prison Officers.
Official Statistics
The statistics in this bulletin are classified as official statistics. The Statistics and Registration Service Act 2007 defines ‘official statistics’ as all those statistical outputs produced by the UK Statistics Authority’s executive office (the Office for National Statistics), by central Government departments and agencies, by the devolved administrations in Northern Ireland, Scotland, and Wales, and by other Crown bodies (over 200 bodies in total). The statistics in this bulletin comply with all aspects of the Code of Practice for Official Statistics. The Code encourages and supports producers of statistics to maintain their independence and to ensure adequate resourcing for statistical production. It helps producers and users of statistics by setting out the necessary principles and practices to produce statistics that are trustworthy, high quality and of public value.
Official Statistics in development
Official statistics in development are a subset of newly developed or innovative official statistics undergoing evaluation. They are developed under the guidance of the Head of Profession for Statistics (HoP) and published to involve users and stakeholders in the assessment of their suitability and quality at an early stage. Therefore, we would like to receive feedback as to how useful they are, whether a different analysis would be preferable, or any other comments about them. If you wish to send any views you may have about these Official statistics in development, please use the contact details below.
Contact
Press enquiries should be directed to the Ministry of Justice press office:
https://www.gov.uk/government/organisations/ministry-of-justice/about/media-enquiries
Other enquiries about these statistics should be directed to:
Rob Hartley
Workforce and Equalities Statistics Team
Analysis Directorate
Ministry of Justice
10 South Colonnade
London
E14 4PH
Email: robert.hartley@justice.gov.uk
Next update: 20 August 2026
URL: www.gov.uk/government/collections/national-offender-management-service-workforce-statistics
© Crown copyright
Produced by the Ministry of Justice
Alternative formats are available on request from robert.hartley@justice.gov.uk
```
-
This includes staff in Probation Service grades working in other parts of HMPPS. ↩
-
Percentage of staff with a permanent contract of employment who left HMPPS, including individuals who have retired early, but excluding staff who left due to voluntary early departure schemes and redundancy (VEDSR). ↩
-
Percentage of staff with a permanent contract of employment who resigned from HMPPS. ↩