Guide to interpretation of healthy child programme indicators from CSDS data
Published 6 October 2026
Applies to England

© Crown copyright 2026
This publication is licensed under the terms of the Open Government Licence v3.0 except where otherwise stated. To view this licence, visit nationalarchives.gov.uk/doc/open-government-licence/version/3 or write to the Information Policy Team, The National Archives, Kew, London TW9 4DU, or email: psi@nationalarchives.gov.uk.
Where we have identified any third party copyright information you will need to obtain permission from the copyright holders concerned.
This publication is available at https://www.gov.uk/government/statistics/child-and-maternal-health-profiles-october-2026-update/guide-to-interpretation-of-healthy-child-programme-indicators-from-csds-data
Summary
The indicators published in October 2026 in the early years topic of the Fingertips child and maternal health profile provide information derived from the Community Services Data Set (CSDS) on:
- health visiting activity
- breastfeeding
- child development outcomes
The indicators include data for England for financial year 2017 to 2018 to financial year 2024 to 2025.
These indicators do not replace the official statistics derived from the voluntary Interim Reporting (IR) collection. Rather, they provide an additional source of intelligence to complement the IR-based measures while work continues to improve the completeness and quality of healthy child programme (HCP) data recorded in CSDS. Publishing the indicators now enables commissioners, providers and national bodies to better understand the strengths and limitations of current CSDS data and to track improvements in coverage and data quality over time before the IR collection is discontinued. This work builds on the Community Services Data Set and healthy child programme: data quality review and associated data dashboard, which were published on 9 June 2026.
The official statistics data for 2025 to 2026 from the IR collection will be published on 3 November 2026.
The 7 new indicators
The 7 indicators published in Fingertips in October 2026 are:
- infants whose mothers received an antenatal review, CSDS-based (official statistics in development)
- infants who have received a new birth review, CSDS-based (official statistics in development)
- infants who have received a 6 to 8 week review, CSDS-based (official statistics in development)
- children who received a 12 month review, CSDS-based (official statistics in development)
- children who have received a 2 to 2 and a half year review, CSDS-based (official statistics in development)
- children aged 2 and a half years who reached the expected level of development, CSDS-based (official statistics in development)
- breastfeeding prevalence at 6 to 8 weeks of age, CSDS-based (official statistics in development)
These are official statistics in development and provide local, regional and national intelligence on the health and development of infants and young children, and on the delivery of mandated universal health visiting reviews. This is to support population health monitoring, service planning and improvement.
Information about how each indicator is calculated is available in the ‘definitions’ data view in Fingertips.
They will be the only indicators for the HCP because the voluntary aggregate IR data collection will cease.
These indicators, and the supporting indicators listed below, will be updated annually on a schedule to be confirmed.
Supporting indicators
The indicators above are accompanied by supporting indicators, which have been produced for data validation purposes. These are:
- infants aged 30 days (1 month) in CSDS as percentage of Office for National Statistics (ONS) live births
- infants aged 56 days (8 weeks) in CSDS as percentage of ONS live births
- infants aged 56 days (8 weeks) in CSDS with a breastfeeding status recorded between 42 and 63 days old as percentage of infants aged 56 days in CSDS
- children aged 457 days (15 months) in CSDS as percentage of ONS mid-year population estimate age 1 year
- children aged 914 days (2 and a half years) in CSDS as percentage of ONS mid-year population estimate age 2 years
- children aged 914 days (2 and a half years) in CSDS with an Ages and Stages Questionnaires Third Edition (ASQ-3) assessment for all 5 domains recorded between 691 and 914 days old as percentage of children aged 914 days in CSDS
These supporting indicators are not available in Fingertips, but are published on GOV.UK in the Child and maternal health profiles: October 2026 update.
The denominators for the Fingertips indicators have been validated against the supporting indicators describing the number of infants or children in CSDS for the relevant age group. An indicator will only be published if the number of infants or children in the denominator is at least 80% of the ONS live births or ONS mid-year population estimate, for infants and children respectively.
For the Fingertips indicator describing breastfeeding prevalence, the denominator is also checked to ensure that at least 80% of infants have a breastfeeding status recorded.
For the Fingertips indicator describing children reaching the expected level of development, the denominator is also checked to ensure that at least 80% of children have an ASQ-3 assessment recorded for each of the 5 domains in the assessment.
Appropriate uses of the statistics
Fingertips indicators cover a range of health and wellbeing themes. They are designed to support joint strategic needs assessments (JSNA) and commissioning to improve health and wellbeing and reduce inequalities. As the quality of data in CSDS improves, these new indicators can be used for:
- benchmarking against national and regional values as well as other UTLAs
- understanding variation between areas, sexes, ethnicities and deprivation deciles
- tracking trends in service delivery to the population of each UTLA, breastfeeding prevalence and child development outcomes
However, while the quality of data is improving it is not appropriate to:
- benchmark between UTLAs without consideration of data quality
- assume observed differences reflect actual delivery
Furthermore, it is not appropriate to directly compare with the indicators based on IR without considering methodological differences.
Important information for users
Providers of publicly funded health services have been mandated to submit data to CSDS since November 2017. However, some UTLAs do not have sufficient numbers of children in CSDS to meet the validation criteria.
Where there are sufficient children in the data, values have been published for the percentage of children who received each mandated review from a health visiting team. Where this value is low it may reflect that the reviews have not been carried out or have not been submitted to CSDS.
Trends should be interpreted carefully, with consideration given to whether changes are reflective of changes in service delivery or recording practices.
For the indicator ‘children aged 2 and a half years who reached the expected level of development, CSDS-based’, at least 80% of the children recorded in CSDS as being resident in the area and aged 2 and a half must have an assessment recorded in all 5 domains of the ASQ-3. This threshold has not yet been reached for England or any of the 9 statistical regions.
For the indicator ‘breastfeeding prevalence at 6 to 8 weeks of age, CSDS-based’, at least 80% of the infants recorded in CSDS as being resident in the area and aged 56 days must have a breastfeeding status recorded. This threshold has not yet been reached for England or any of the 9 statistical regions.
These new indicators, while not exactly the same, do have comparable indicators in IR that would be expected to fall within a broadly consistent range of values and analysis of the differences is included in this guide. There is no comparable IR-based indicator for ‘infants whose mothers received an antenatal review, CSDS-based’. For the other 6 new indicators we have compared each with its equivalent in IR.
Data quality and coverage
Although submission of data to CSDS has been mandated since 2017, coverage and data quality varies between providers and, therefore, UTLAs. Some UTLAs do not have sufficient numbers of children in CSDS to meet the validation criteria.
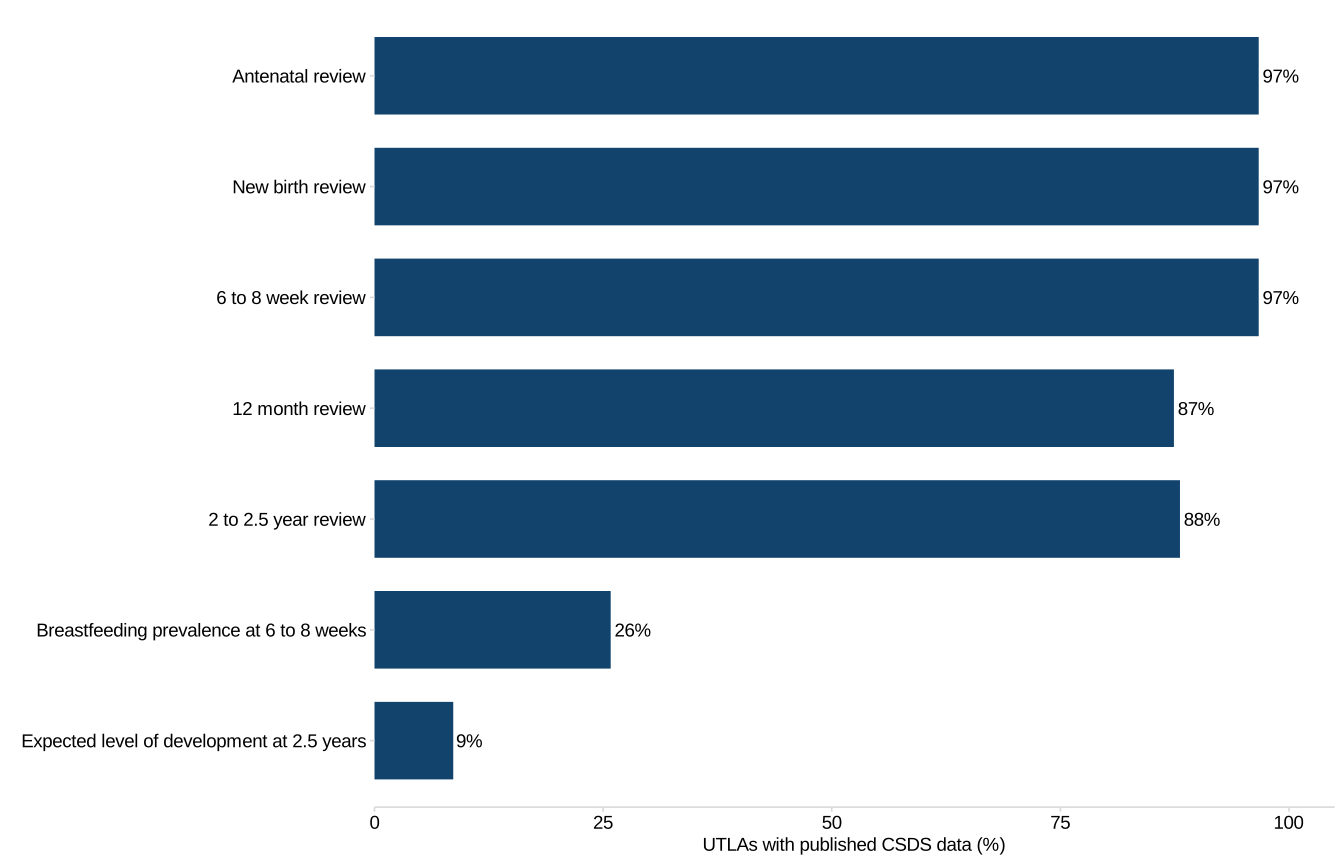
Table 1 shows the number of UTLAs with data published for each indicator, and the number of UTLAs where the data published is a poor match for the similar IR-based indicator or where there was no IR data available for comparison, in the latest year of data, 2024 to 2025. The 2 indicators are categorised as a poor match if the difference between them is more than 20 percentage points. Detailed analysis of the comparability with existing statistics is below. Figure 1 shows the percent of UTLAs with data published for each indicator in the same time period.
There are 153 UTLAs in England, but data has been combined for Cornwall and the Isles of Scilly, and for Hackney and the City of London. Therefore the total number of UTLAs is 151 in this analysis.
Table 1: number and percentage of UTLAs with published data for each indicator
| Indicator | Number of UTLAs with data published | Number of UTLAs with data published that is a poor match with IR data or has missing IR data |
|---|---|---|
| Infants whose mothers received an antenatal review, CSDS-based (official statistics in development) | 146 (97%) | not applicable |
| Infants who have received a new birth review, CSDS- based (official statistics in development) | 146 (97%) | 78 (53% of those published) |
| Infants who have received a 6 to 8 week review, CSDS-based (official statistics in development) | 146 (97%) | 82 (56% of those published) |
| Children who received a 12 month review, CSDS-based (official statistics in development) | 132 (87%) | 65 (49% of those published) |
| Children who have received a 2 to 2 and a half year review, CSDS-based (official statistics in development) | 133 (88%) | 66 (50% of those published) |
| Children aged 2 and a half years who reached the expected level of development, CSDS-based (official statistics in development) | 13 (9%) | 0 (0% of those published) |
| Breastfeeding prevalence at 6 to 8 weeks of age, CSDS-based (official statistics in development) | 39 (26%) | 9 (23% of those published) |
Figure 1: percent of UTLAs with data published for each indicator
Inequality breakdowns
We have only been able to include a breakdown by sex at England level, for indicators with a total value published for England. No breakdown is provided for antenatal reviews as sex may not be known at the time of the review.
Although valid ethnicity information is available for more than 80% of children in most age groups and financial years, ethnicity breakdowns are not currently presented. This reflects ongoing work to develop a consistent approach to assigning ethnicity across data sources prior to publication.
When lower layer super output area (LSOA) 2021 data is made available through the NHS Data Access Request Service (DARS), we will be able to publish a breakdown of each indicator by deprivation deciles.
Comparability with existing statistics
While these new indicators are not a direct replacement for the indicators based on the voluntary aggregate IR data collection, due to different definitions and methods, the comparable indicators would be expected to fall within a broadly consistent range of values.
This analysis classifies UTLAs into 6 categories for each comparable indicator. The values are a:
- good match if the difference between the CSDS-based value and the IR value is less than or equal to 10 percentage points
- reasonable match if the difference between the CSDS-based value and the IR value is more than 10 percentage points but less than or equal to 20 percentage points
- poor match if the difference between the CSDS-based value and the IR value is more than 20 percentage points.
Areas are described as having:
- missing CSDS and IR data if data in the CSDS source was too poor for publication and data in the IR source was not submitted or was too poor for publication
- missing CSDS data if the data in this source was too poor for publication, but there was published data from IR
- missing IR data if the data in this source was not submitted or too poor for publication, but there was data from CSDS good enough for publication
Analysis by indicator
Table 2 shows the count of UTLAs in each category for each comparable indicator, for financial year ending 2025. Figure 2 shows this in a chart.
Table 2: count of UTLAs in each category for comparable indicators
| Indicator | UTLAs with good match | UTLAs with reasonable match | UTLAs with poor match | UTLAs with missing CSDS and IR data | UTLAs with missing CSDS data only | UTLAs with missing IR data only | Total UTLAs |
|---|---|---|---|---|---|---|---|
| Infants who have received a new birth review | 47 (31%) | 21 (14%) | 74 (49%) | 0 (0%) | 5 (3%) | 4 (3%) | 151 |
| Infants who have received a 6 to 8 week review | 36 (24%) | 28 (19%) | 78 (52%) | 1 (1%) | 4 (3%) | 4 (3%) | 151 |
| Children who received a 12 month review | 45 (30%) | 22 (15%) | 62 (41%) | 2 (1%) | 17 (11%) | 3 (2%) | 151 |
| Children who have received a 2 to 2 and a half year review | 47 (31%) | 20 (13%) | 6 0 (40%) | 3 (2%) | 15 (10%) | 6 (4%) | 151 |
| Children aged 2 and a half years who reached the expected level of development | 4 (3%) | 9 (6%) | 0 (0%) | 11 (7%) | 127 (84%) | 0 (0%) | 151 |
| Breastfeeding prevalence at 6 to 8 weeks of age | 27 (18%) | 3 (2%) | 0 (0%) | 5 9 (39%) | 53 (35%) | 9 (6%) | 151 |
Figure 2: UTLAs by category for comparable indicators
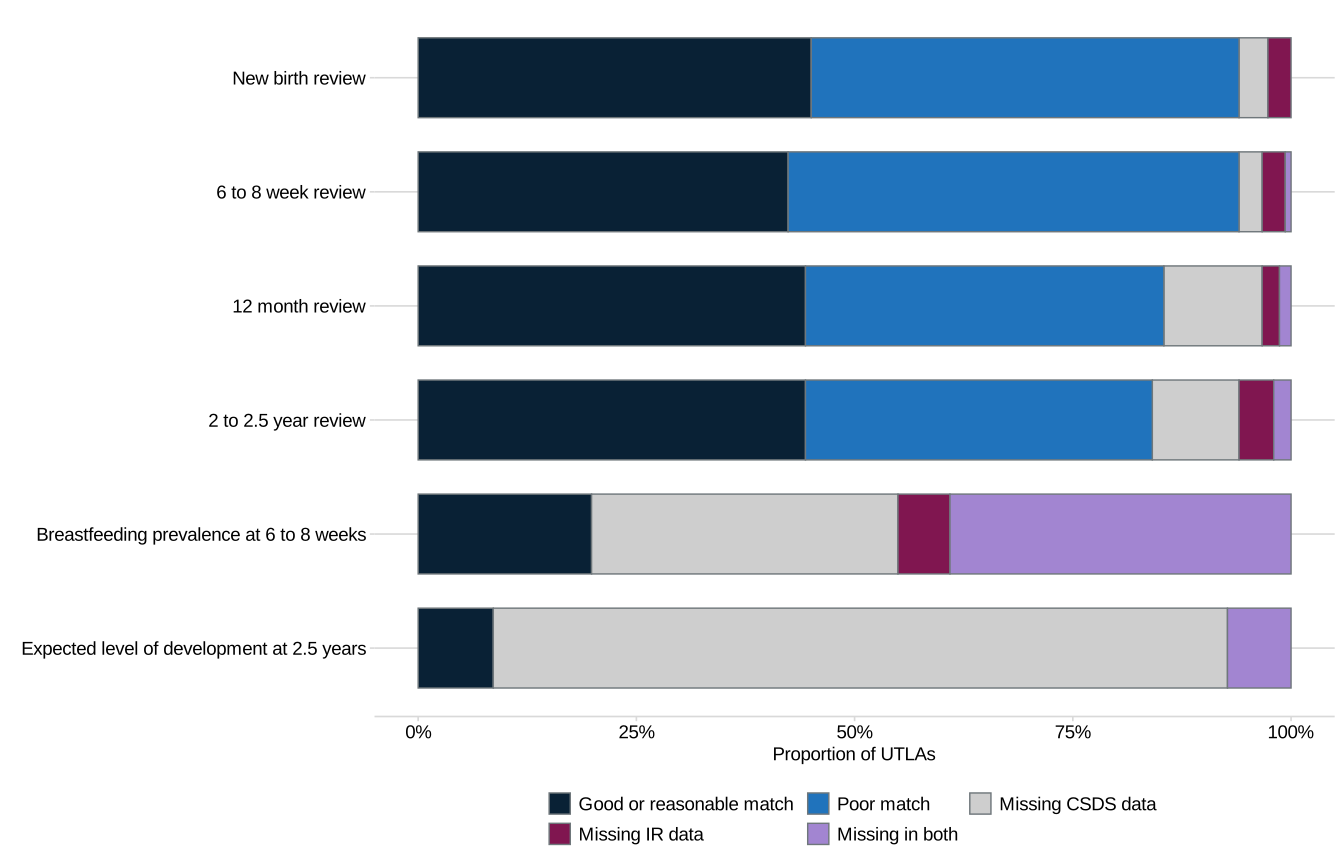
For each of the indicators on delivery of reviews, there is a large discrepancy between CSDS and IR. In some UTLAs there is over 90 percentage points difference between the 2 collections. However, nearly 50% of UTLAs have a good or reasonable match between the 2 collections.
For the expected level of development and breastfeeding indicators, most UTLAs have missing CSDS or IR data, but where there is data from both sources the match is either good or reasonable. No areas have a poor match. There is more missing data in both CSDS and IR for breastfeeding. For the expected level of development indicator, there is missing data in CSDS for the majority of UTLAs.
Analysis by UTLA
Scatterplots are another way to show the relationship between the indicator values in CSDS and the same indicator values in IR by UTLA.
Figure 3: indicator values for 2 to 2.5 year reviews in CSDS plotted against the values in IR
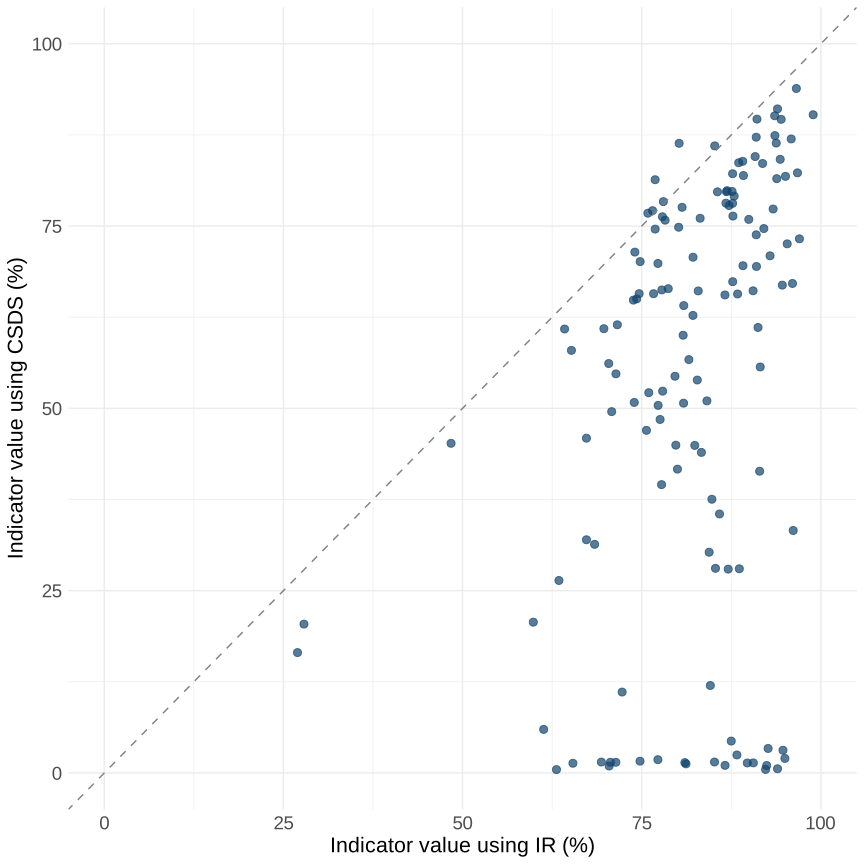
For all reviews, as shown for 2 to 2.5 year reviews in figure 3, there is little relationship between the values in CSDS and the values in IR. The picture is suggestive of poor recording of reviews in CSDS for a significant number of UTLAs. If there was a close relationship then values would be close to the dotted line for all UTLAs. A very small number of UTLAs have a higher percentage of completed reviews in CSDS than IR (denoted when UTLAs are above the line of equality (the dotted line) in the scatter plot).
The charts for breastfeeding (see figure 4) and children reaching the expected level of development (see figure 5) show that there is a significant amount of missing data. However, for the small number of UTLAs that are recording these outcomes, there is a fairly close relationship with the figures in IR.
Figure 4: indicator values for breastfeeding in CSDS plotted against the values in IR
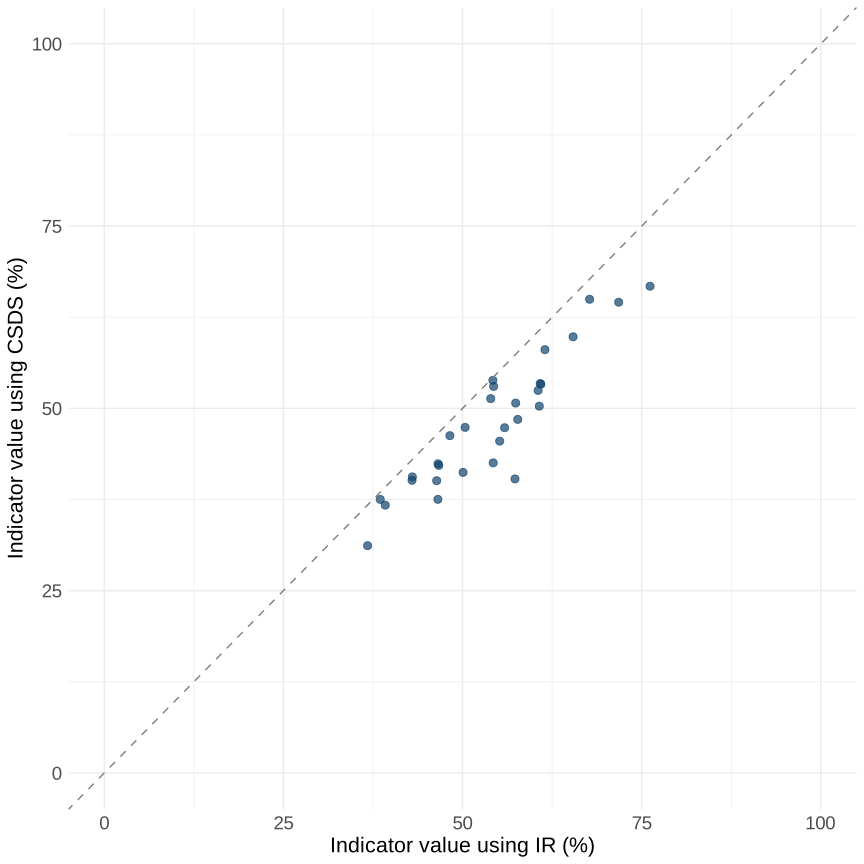
Figure 4 shows indicator values for breastfeeding prevalence at 6 to 8 weeks based on CSDS and IR, for the 30 UTLAs that had data from both sources in financial year ending 2025. It shows a fairly close relationship between the 2 different indicators for areas where there is data from both sources.
Figure 5: indicator values for expected level of development in CSDS plotted against the values in IR
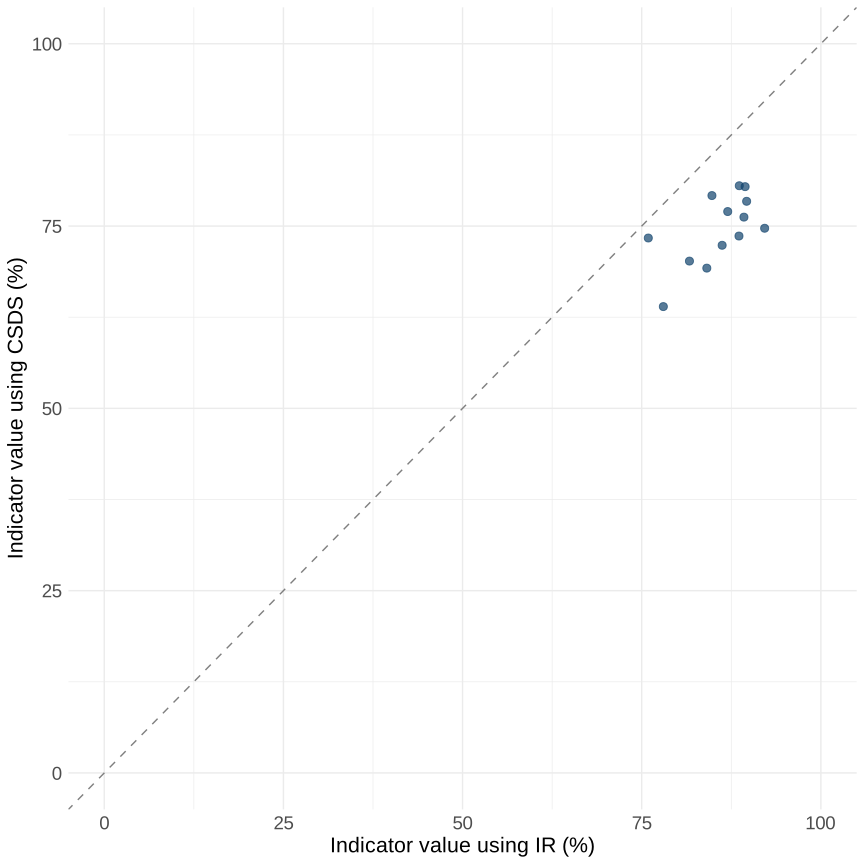
Figure 5 shows indicator values for children reaching the expected level of development at age 2 and a half based on CSDS and IR, for the 13 UTLAs that had data from both sources in financial year ending 2025. It shows a fairly close relationship between the 2 different indicators for areas where there is data from both sources.
Strengths and limitations
Strengths
CSDS is a mandated administrative data set meaning that all providers of publicly funded health services should be submitting data to the data set. Noting that there is an initial burden in setting up the CSDS collection, using this mandated data set in place of the voluntary IR collection will then reduce the burden for commissioners and providers of HCP.
Because CSDS is a patient-level data set, detailed analysis is possible. Breakdowns by sex have been included at England level, where appropriate, for the indicators published in October 2026. When data quality improves, breakdowns by ethnicity will be added. When LSOA 2021 is included in the data, breakdowns by deprivation decile will be added.
In addition, there is further potential to join CSDS to other data sets. For example, it could be joined to the Maternity Services Data Set (MSDS) to explore differences in service delivery, child development outcomes and breastfeeding related to birth outcomes such as multiple births, caesarean sections, and time spent in a special care baby unit (SCBU). It will also be possible to explore differences correlated with the age of mothers.
Areas with good quality data in CSDS could have extra analysis produced showing patterns in health visiting activity, child development outcomes and breastfeeding related to demographic factors in their communities.
Improving data quality in CSDS will also support academic research into the data. University College London (UCL) has created the Education and Child Health Insights from Linked Data (ECHILD) database linking health and education data, including CSDS and children’s social care data. Improved data quality in CSDS is part of improving this resource, the outputs from which can inform future government policy.
Limitations
UTLAs have been able to validate the IR data they submit, making sure it matches their understanding of levels of service delivery. This will not be possible in the same way with CSDS, although UTLAs can apply through DARS for a commissioner’s view of the data. However, this is only available after the HCP provider has submitted the data. NHS England publishes statistics each month describing what has been submitted to CSDS. These are released 2 months in arrears and are in the public domain. Commissioners can view these statistics to assure themselves that data submitted to CSDS matches their expectations.
The IR data collection has multiple opportunities for UTLAs to amend data they believe to be incorrect. The data submission timetable for CSDS does not include multiple opportunities to amend data. Monthly data is submitted around 2 weeks after the end of the month. A corrected or updated version can then be submitted the following month, so around 6 weeks after the end of the month. No further changes to the data can be made. It is therefore important that data is submitted to CSDS on time and accurately.
The large number of UTLAs with sufficient numbers of children in CSDS to meet the validation criteria, but very low reported percentages of children receiving mandated reviews, may indicate incomplete recording of reviews in CSDS in some areas. CSDS data alone cannot be used to determine whether low reported coverage reflects low delivery of reviews, incomplete recording, or both. While the voluntary IR collection is not directly comparable to CSDS and does not provide complete national coverage, it can provide context on the scale of review activity. The comparisons presented in this report suggest that the very low levels of activity reported in CSDS for some UTLAs are unlikely to be explained by low levels of service delivery alone and may therefore reflect data quality issues in CSDS.
Where rates of health visiting services delivery have increased this may reflect improvements in the recording of the activity rather than an increase in the activity itself.
Future development
Improvements in data quality in CSDS should soon be evident in these indicators, following extensive work by the Office for Health Improvement and Disparities (OHID) and NHS England to support UTLA commissioners and their providers of the HCP in financial years ending 2026 and 2027. When the quality has improved sufficiently, the data quality flags in Fingertips will be removed and the indicators can be designated as ‘official statistics’.
Questions about the indicators can be sent to pha-ohid@dhsc.gov.uk.
OHID has produced guidance for providers of the healthy child programme on completing CSDS. This is supplementary to the CSDS tools and guidance published by NHS England.
For support on CSDS submissions contact NHS England’s National Service Desk on 0300 303 5035 or email ssd.nationalservicedesk@nhs.net.