Youth Matters Fund Programme: priority places methodology
Published 13 November 2026
Applies to England

© Crown copyright 2026
This publication is licensed under the terms of the Open Government Licence v3.0 except where otherwise stated. To view this licence, visit nationalarchives.gov.uk/doc/open-government-licence/version/3 or write to the Information Policy Team, The National Archives, Kew, London TW9 4DU, or email: psi@nationalarchives.gov.uk.
Where we have identified any third party copyright information you will need to obtain permission from the copyright holders concerned.
This publication is available at https://www.gov.uk/government/publications/youth-matters-fund-programme/youth-matters-fund-programme-priority-places-methodology
Youth Matters Fund Programme priority places
60 upper tier local authorities (UTLAs) are eligible for the funding.
Rationale for targeting the fund
The Department for Digital, Culture, Media and Sport (DCMS) is committed to making a difference in the places that need it the most, through investing to build social and community cohesion and to enhance opportunity where outcomes are poorest.
Evidence points clearly to economic and social outcomes being systematically worse in places where both deprivation and community need is highest; places experiencing ‘double disadvantage’[footnote 1]. This includes youth outcomes - the proportion of 16 to 24 year olds not in Education, Employment, or Training (NEET) varies across the country, from 21% in the North East to 11.5% in the South East[footnote 2]. For this reason, across our programmes that aim to improve social and community outcomes, we will focus more of our activity and investment in these places of double disadvantage to ensure that our funding is concentrated in the communities where we can make the biggest difference[footnote 3].
This includes targeting our funding for youth programmes, and we have therefore developed a set of priority places for targeting the Youth Matters Fund Programme, guided by the broader DCMS approach to place targeting. It does not cover all youth programmes, and prioritisation lists for programmes focussed on specific outcomes may be developed separately using specific and appropriate data.
The broader DCMS approach focuses on places with high deprivation and high community need, as measured by the Indices of Multiple Deprivation and the Community Needs Index[footnote 4]. The approach for the Youth Matters Fund Programme builds on this through adapting the deprivation measure to one specific to young people and incorporating data on young people’s perceptions of services and activities in their local area and data on youth engagement in education and employment.
The methodology set out in this note uses the latest data as of September 2026 to identify places with high deprivation, low levels of youth satisfaction with activities and services in their local area and high levels of 16 to 17 year olds not engaged in education, training or employment. We have chosen to carry out analysis and prioritise at upper tier local authority (UTLA) level to align with the local authority responsibility for youth provision. Data on young people’s perceptions of services and activities in their local area and data on youth engagement in education and employment to determine a list of areas that should be prioritised is also available at this level. The methodology creates a list of 60 UTLA areas for prioritisation.
If you have any questions about the Youth Matters Fund Programme please contact: ymf@dcms.gov.uk.
Methodology for selecting Youth Matters Fund Programme priority places
Summary of the approach
We selected places using a combination of the following metrics:
- National Youth Strategy survey MRP (multi-level regression and post stratification) summary score
- The Community Needs Index (CNI)
- Income deprivation affecting children index (IDACI)
- Proportion of 16 to 17 year olds who are NEET
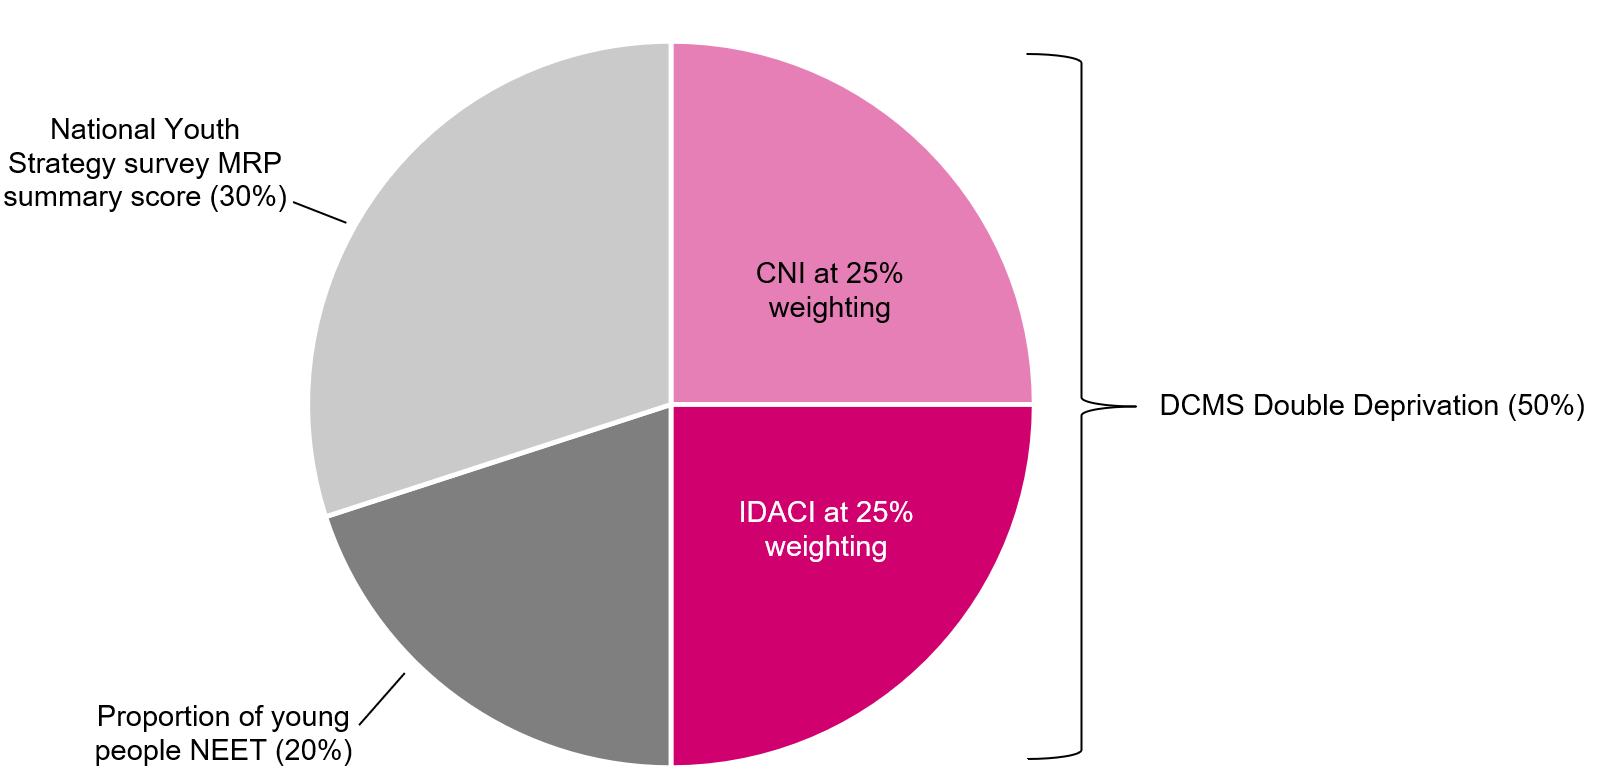
Data for each metric for each UTLA in England was standardised[footnote 5] in order to put them in comparable terms whilst keeping the magnitude of the respective distances from the mean. These standardised scores were then combined using the weightings illustrated in Figure 1 below to create a ranking of need for all UTLAs in England, where higher ranking equates to higher need. The weightings used ensured that young people’s perceptions of activities and services in their local area was given the greatest weight, to ensure that funding is directed to where young people say that there is not enough for them to do or places to go. It also ensures that funding is targeted to areas with a high concentration of disadvantage while minimising the risk of targeting areas which are relatively less deprived and are better served in terms of youth provision. Table 1 at the end of this document shows all UTLAs in England ranked in order of need. The Youth Matters Fund Programme is targeted to the highest ranked 60 UTLAs.
Figure 1: Youth Matters priority places metric weighting
| Metric | Weighting (%) |
|---|---|
| National Youth Strategy multi-level regression and post stratification (MRP) summary score | 30% |
| Proportion of young people not in education, employment, or training (NEET) | 20% |
| The Community Needs Index (CNI) | 25% |
| Income deprivation affecting children index (IDACI) | 25% |
The CNI (25%) and IDACI (25%) form the DCMS double deprivation (50%).
The sections below provide more details on each metric used, including the rationale for using the metric, and key risks or limitations.
National Youth Strategy (NYS) survey MRP summary score
This metric combines responses on three measures from the NYS survey, to provide a score summarising young people’s perceptions of activities and services in their local area. These have been estimated at UTLA level using multi-level regression and post stratification (MRP), which is explained below. Lower scores on this metric represent lower levels of satisfaction.
The NYS survey was conducted by Savanta on behalf of DCMS as part of the evidence base for the development of Youth Matters: Your National Youth Strategy[footnote 6]. Findings from the survey were reported in our Youth Matters: State of the Nation report[footnote 7], which was published alongside the strategy. The online survey, which ran during March and April 2025, was designed to capture the views of young people aged 10 to 21 (up to 25 with SEND) on a range of topics including their wellbeing, access to services and activities, feelings of belonging, and what they feel would most improve their lives. A total of 14,134 young people responded, which is not large enough to report findings for each local authority.
In order to understand young people’s perceptions of activities and services in their local area DCMS commissioned Savanta to conduct MRP (multi-level regression and post stratification) of a subset of the data collected from the NYS. Full details of the analysis carried out and findings are available in the published report[footnote 8]. MRP is a statistical technique that produces reliable small-area estimates from survey data. Unlike simple sub-group analysis, it can produce stable estimates even for areas where the raw survey sample is small, by borrowing statistical strength from similar areas and demographic groups. This makes it well-suited to questions about local variation, where individual areas may have too few respondents to support direct analysis, and has been used extensively with political polling data to create estimates of election results for each constituency.
As detailed in their report[footnote 9], Savanta used this method to create modelled estimates of a subset of NYS survey questions which provide data on young people’s views on activities and services in their local area for each UTLA. Due to the need to have the full postcode data for the original survey data and the fact that providing postcode was optional, this analysis was based on a subset of the NYS survey responses - the 9,475 who agreed to provide their full postcode.
Savanta created three compound metrics combining UTLA level estimates on multiple individual survey measures into a single summary score. Rather than considering each statement in isolation, a compound metric captures the overall pattern of young people’s views across several related dimensions. This reduces the risk of drawing conclusions from a single measure that may be influenced by local context or question wording, and provides a more stable and robust basis for ranking and comparing areas. Details of all compound metrics created are in their report[footnote 10]. For the place selection we used the core compound metric, which is the mean percentage of young people agreeing with three statements:
1. ‘I am happy with the activities and services in my local area’ 2. ‘I feel like the activities and services in my local area are made for young people like me’ 3. ‘If I need extra help and support, there are places I can go to’.
These three statements were selected because they directly measure young people’s satisfaction with, and sense of belonging within, local provision. Together they capture three distinct but related dimensions: general satisfaction (1), relevance and identity (2), and awareness of support (3i). Each statement was weighted equally; a higher compound score indicates that young people in that area are, on balance, more positive about local provision.
The community needs index (CNI)
CNI looks at the experiences of people in an area. In particular, it considers access to civic assets, connectedness and activity and engagement. It is part of the core DCMS Places in Need approach[footnote 11].
Income deprivation affecting children index (IDACI)
IDACI measures the proportion of all children aged 0 to 15 living in income deprived families. The core DCMS Places in Need approach[footnote 12] uses the broader Index of Multiple Deprivation (IMD) combined with the Community Needs Index. IMD captures a range of deprivation criteria including: income; employment; health and disability; education and skills; crime; housing; and living environment). We combined IDACI with CNI instead of IMD to reflect the target demographic of this programme. The blended metric is created by calculating the proportion of Lower Super Output Layer Areas (LSOAs) that are in the bottom 20% for both metrics. These are commonly referred to in the published departmental place targeting approach as areas facing ‘double disadvantage’ of high deprivation and high community need.
There is a strong link between IDACI and youth outcomes. Research by the Social Mobility Commission found a direct link between household income and young people’s participation for almost all extra-curricular activities[footnote 13]. Children from the poorest households were much less likely to take part in any extra-curricular activity, but particularly music and sport. The Department for Culture, Media and Sport Youth Participation Survey found that participation rates in clubs and activities were lower for young people in the most deprived IDACI quintile (56%) compared to those in the highest IDACI quintile (76%)[footnote 14]. This fund targets areas with higher proportions of young people that are less likely to participate in sports and cultural activities.
The proportion of 16 to 17 year olds who are NEET (not in education, employment or training)
Including this metric reflects a key aim and outcome of the programme - to provide young people with the social, emotional and life skills in order to actively participate in the economy. Statistics on the proportion of young people aged 16 to 24 who are NEET are published at a national level, but this is not available at local authority level. The most relevant data on proportion of young people who are NEET that is available at UTLA level is the proportion of 16 to 17 year olds.
Table 1: UTLAs ranked according to place selection approach
| Local authority | Region | Ranking of need |
|---|---|---|
| Halton | North West | 1 |
| Kingston upon Hull, City of | Yorkshire and The Humber | 2 |
| Hartlepool | North East | 3 |
| North East Lincolnshire | Yorkshire and The Humber | 4 |
| Middlesbrough | North East | 5 |
| Blackpool | North West | 6 |
| Sunderland | North East | 7 |
| Redcar and Cleveland | North East | 8 |
| Rotherham | Yorkshire and The Humber | 9 |
| Knowsley | North West | 10 |
| County Durham | North East | 11 |
| Sheffield | Yorkshire and The Humber | 12 |
| Newcastle upon Tyne | North East | 13 |
| Torbay | South West | 14 |
| St. Helens | North West | 15 |
| Barnsley | Yorkshire and The Humber | 16 |
| Stoke-on-Trent | West Midlands | 17 |
| Liverpool | North West | 18 |
| Tameside | North West | 19 |
| Wirral | North West | 20 |
| Gateshead | North East | 21 |
| Doncaster | Yorkshire and The Humber | 22 |
| Stockton-on-Tees | North East | 23 |
| Nottingham | East Midlands | 24 |
| Portsmouth | South East | 25 |
| Wakefield | Yorkshire and The Humber | 26 |
| Salford | North West | 27 |
| Peterborough | East of England | 28 |
| Rochdale | North West | 29 |
| Southampton | South East | 30 |
| Solihull | West Midlands | 31 |
| Suffolk | East of England | 32 |
| Norfolk | East of England | 33 |
| Sefton | North West | 34 |
| Lincolnshire | East Midlands | 35 |
| Wigan | North West | 36 |
| Telford and Wrekin | West Midlands | 37 |
| South Tyneside | North East | 38 |
| Derby | East Midlands | 39 |
| Swindon | South West | 40 |
| Cumberland | North West | 41 |
| Oldham | North West | 42 |
| Worcestershire | West Midlands | 43 |
| North Northamptonshire | East Midlands | 44 |
| Shropshire | West Midlands | 45 |
| Westmorland and Furness | North West | 46 |
| Darlington | North East | 47 |
| Essex | East of England | 48 |
| Leeds | Yorkshire and The Humber | 49 |
| Southend-on-Sea | East of England | 50 |
| Manchester | North West | 51 |
| Luton | East of England | 52 |
| Cheshire West and Chester | North West | 53 |
| Isle of Wight | South East | 54 |
| North Tyneside | North East | 55 |
| Walsall | West Midlands | 56 |
| Plymouth | South West | 57 |
| Birmingham | West Midlands | 58 |
| Herefordshire, County of | West Midlands | 59 |
| East Sussex | South East | 60 |
| Wolverhampton | West Midlands | 61 |
| Sandwell | West Midlands | 62 |
| Cornwall | South West | 63 |
| Wiltshire | South West | 64 |
| Leicester | East Midlands | 65 |
| Stockport | North West | 66 |
| Cheshire East | North West | 67 |
| Kent | South East | 68 |
| Northumberland | North East | 69 |
| Staffordshire | West Midlands | 70 |
| North Lincolnshire | Yorkshire and The Humber | 71 |
| Kirklees | Yorkshire and The Humber | 72 |
| Calderdale | Yorkshire and The Humber | 73 |
| Dudley | West Midlands | 74 |
| Thurrock | East of England | 75 |
| Blackburn with Darwen | North West | 76 |
| Lancashire | North West | 77 |
| Bristol, City of | South West | 78 |
| East Riding of Yorkshire | Yorkshire and The Humber | 79 |
| Bolton | North West | 80 |
| Dorset | South West | 81 |
| Gloucestershire | South West | 82 |
| Medway | South East | 83 |
| Bradford | Yorkshire and The Humber | 84 |
| Hampshire | South East | 85 |
| Hertfordshire | East of England | 86 |
| North Somerset | South West | 87 |
| Nottinghamshire | East Midlands | 88 |
| West Northamptonshire | East Midlands | 89 |
| Derbyshire | East Midlands | 90 |
| Trafford | North West | 91 |
| Havering | London | 92 |
| South Gloucestershire | South West | 93 |
| Warrington | North West | 94 |
| Rutland | East Midlands | 95 |
| Devon | South West | 96 |
| Isles of Scilly | South West | 97 |
| West Berkshire | South East | 98 |
| Brighton and Hove | South East | 99 |
| Somerset | South West | 100 |
| Windsor and Maidenhead | South East | 101 |
| West Sussex | South East | 102 |
| Milton Keynes | South East | 103 |
| North Yorkshire | Yorkshire and The Humber | 104 |
| Leicestershire | East Midlands | 105 |
| Bexley | London | 106 |
| Buckinghamshire | South East | 107 |
| Central Bedfordshire | East of England | 108 |
| Warwickshire | West Midlands | 109 |
| Bury | North West | 110 |
| Reading | South East | 111 |
| Bournemouth, Christchurch and Poole | South West | 112 |
| Bracknell Forest | South East | 113 |
| Coventry | West Midlands | 114 |
| Hillingdon | London | 115 |
| Cambridgeshire | East of England | 116 |
| Barnet | London | 117 |
| Bedford | East of England | 118 |
| Croydon | London | 119 |
| Richmond upon Thames | London | 120 |
| Oxfordshire | South East | 121 |
| Wokingham | South East | 122 |
| Surrey | South East | 123 |
| Greenwich | London | 124 |
| Barking and Dagenham | London | 125 |
| Waltham Forest | London | 126 |
| Lewisham | London | 127 |
| Bath and North East Somerset | South West | 128 |
| Redbridge | London | 129 |
| Slough | South East | 130 |
| Wandsworth | London | 131 |
| Ealing | London | 132 |
| Bromley | London | 133 |
| Haringey | London | 134 |
| Brent | London | 135 |
| Lambeth | London | 136 |
| Hammersmith and Fulham | London | 137 |
| Tower Hamlets | London | 138 |
| Harrow | London | 139 |
| Merton | London | 140 |
| Newham | London | 141 |
| Kingston upon Thames | London | 142 |
| Kensington and Chelsea | London | 143 |
| Southwark | London | 144 |
| York | Yorkshire and The Humber | 145 |
| Enfield | London | 146 |
| Sutton | London | 147 |
| Camden | London | 148 |
| Hackney | London | 149 |
| Islington | London | 150 |
| Westminster | London | 151 |
| Hounslow | London | 152 |
| City of London | London | 153 |
Approach for allocating 2026/2027 funding directly to eligible local authorities via the Youth Matters Fund Local Authority Grant
Our approach ensures that each eligible UTLA receives a level of funding sufficient to deliver meaningful change, while also considering the level of need, aligned to the place selection methodology detailed above.
Each of the eligible UTLAs were allocated a core grant of £100,000 which amounts to £6 million of the available £20 million. Following engagement with local authorities we concluded that £100,000 provides a minimum core of funding needed for the areas to be able to deliver meaningful improvements to their youth offer during 2026/27.
The remaining £14 million was then distributed amongst the selected UTLAs via a consideration of need and size of the youth population. First the selected UTLAs were grouped into 5 tiers of 12 based on their relative need ranking based on the place selection criteria, shown in Table 2. Tiering was based on the ranking of the original place selection scoring criteria with places ranked 1 to 12 in tier 1, places ranked 13 to 24 in tier 2 etc. Second, levels of funding per young person (per capita) were allocated per tier, with higher levels of funding going to higher need tiers.
Table 2: Per capita allocations by tier (these exclude the core grant)
| Need tier | 2026/27 revenue allocation per young person |
|---|---|
| 1 | £8.29 |
| 2 | £6.74 |
| 3 | £5.18 |
| 4 | £3.63 |
| 5 | £2.07 |
Next, these per capita allocations were multiplied by the number of young people in each selected UTLA to give an overall allocation to that area. This ensures that locations in the same band get the same level of funding per young person but areas with larger youth populations will generally get higher overall allocations. These per capita allocations are added to the £100,000 core grant to provide a total grant for each UTLA. Table 4 below shows the total allocations for each of the selected UTLAs.
Table 4: Youth Matters 2026/27 funding allocations, shown in ranked order of need
| Local authority | Total 2026/27 revenue allocation per UTLA |
|---|---|
| Halton | £247,636 |
| Hartlepool | £215,311 |
| Kingston upon Hull, City of | £442,208 |
| North East Lincolnshire | £275,725 |
| Middlesbrough | £285,259 |
| Blackpool | £249,565 |
| Sunderland | £408,269 |
| Redcar and Cleveland | £247,628 |
| Rotherham | £406,910 |
| Knowsley | £276,990 |
| County Durham | £746,058 |
| Sheffield | £861,187 |
| Newcastle upon Tyne | £506,291 |
| St. Helens | £258,321 |
| Liverpool | £683,143 |
| Stockton-on-Tees | £291,927 |
| Wirral | £381,339 |
| Torbay | £209,093 |
| Doncaster | £376,387 |
| Barnsley | £313,163 |
| Gateshead | £279,447 |
| Stoke-on-Trent | £374,466 |
| Tameside | £322,887 |
| Portsmouth | £333,653 |
| Salford | £320,145 |
| Peterborough | £274,347 |
| Rochdale | £285,351 |
| Nottingham | £477,663 |
| Southampton | £327,418 |
| Wakefield | £343,338 |
| Solihull | £258,917 |
| Derby | £315,308 |
| South Tyneside | £199,857 |
| Suffolk | £589,285 |
| Norfolk | £701,322 |
| Sefton | £276,413 |
| Telford and Wrekin | £203,982 |
| Wigan | £261,161 |
| Manchester | £516,221 |
| Swindon | £218,813 |
| Leeds | £586,035 |
| Oldham | £244,545 |
| East Sussex | £340,984 |
| Lincolnshire | £467,035 |
| Worcestershire | £381,008 |
| Essex | £828,485 |
| Leicester | £352,850 |
| Cumberland | £222,510 |
| Shropshire | £179,656 |
| Cheshire West and Chester | £196,966 |
| Plymouth | £185,896 |
| Herefordshire, County of | £144,340 |
| Luton | £174,069 |
| North Tyneside | £154,894 |
| North Northamptonshire | £205,425 |
| Isle of Wight | £131,486 |
| Kent | £559,738 |
| Southend-on-Sea | £148,955 |
| Westmorland and Furness | £153,604 |
| Birmingham | £529,116 |
-
See for example: OCSI. 2020. Left-behind areas 2020 - Interim Set. ↩
-
NEET rates for age 16 to 24: Annual estimates from the Labour Force Survey of young people aged 16 to 24 not in education, employment or training (NEET) in England, 2025 ↩
-
A new approach to place targeting across DCMS programmes - GOV.UK ↩
-
A new approach to place targeting across DCMS programmes - GOV.UK ↩
-
In statistics, standardised variables are variables that have been standardised to have a mean of 0 and a standard deviation of 1. The variables are rescaled using the z-score formula. Standardising makes it easier to compare scores, even if those scores were measured on different scales. ↩
-
Youth Matters: State of the Nation - GOV.UK, see full data tables. ↩
-
National Youth Strategy: Upper-Tier Local Authority Analysis - GOV.UK ↩
-
National Youth Strategy: Upper-Tier Local Authority Analysis - GOV.UK ↩
-
National Youth Strategy: Upper-Tier Local Authority Analysis - GOV.UK ↩
-
A new approach to place targeting across DCMS programmes - GOV.UK ↩
-
A new approach to place targeting across DCMS programmes - GOV.UK ↩
-
An unequal playing field: extra-curricular activities, soft skills and social mobility - GOV.UK ↩