Wireless 2030
Published 10 January 2023

© Crown copyright 2023
This publication is licensed under the terms of the Open Government Licence v3.0 except where otherwise stated. To view this licence, visit nationalarchives.gov.uk/doc/open-government-licence/version/3 or write to the Information Policy Team, The National Archives, Kew, London TW9 4DU, or email: psi@nationalarchives.gov.uk.
Where we have identified any third party copyright information you will need to obtain permission from the copyright holders concerned.
This publication is available at https://www.gov.uk/government/publications/wireless-2030/wireless-2030
A scenarios analysis of public service demand for wireless connectivity in 2030.
Glossary
More definitions can be found in the supplementary annex.
| Term | Definition |
|---|---|
| AI | Artificial intelligence |
| AR/VR | Augmented reality/virtual reality (mixed reality) |
| Bandwidth | The maximum rate of data transfer across a given path |
| Digital services | A group of services based on communications and information technology which encompasses the services of e-market, web search and/or cloud computing |
| Internet | A global computer network providing a variety of information and communication facilities, consisting of interconnected networks using standardised communication protocols |
| Latency | The delay before a transfer of data begins following an instruction for its transfer |
| Mobile broadband | Marketing term for wireless internet access via mobile networks. Access to the network can be made through a portable modem, wireless modem, or a tablet/smartphone or other mobile device |
| Mobile networks | A network which sends communications in the form of radio waves to and from users. It is composed of base stations that each cover a delimited area or ‘cell’. When joined together these cells provide radio coverage over a wide geographic area |
| Network capacity | The maximum amount of data that can be reliably transferred between different locations over a network |
| Public Services | Entirely or partially government funded services delivered in the interest of the public |
| Spectrum | In this case the electromagnetic (EM) spectrum is the range of frequencies of electromagnetic radiation and their respective wavelengths and photon energies |
| Standalone 5G | The virtualisation and cloud-based transformation of 5G core networks that does not rely on existing 4G infrastructure |
| Telecoms | The transmission of information by various types of technologies over wire, radio, optical, or other electromagnetic systems |
| UK demand | When, where and how the UK public will want or need to use wireless connectivity in the next decade |
| Wireless Infrastructure | Communication infrastructure that reaches users without wires, primarily via cellular mobile networks, but including other technologies such as Wi-Fi and satellites |
| Wireless technology | Devices which can communicate with each other or communicate with a wired network, without having a wired connection themselves |
Preface

Photo of Government Chief Scientific Adviser Sir Patrick Vallance.
The early 1990’s saw the introduction of the first mobile internet, thanks to second generation mobile phone technology (2G). Since then, technology has progressed at an unprecedented rate. Not only is mobile broadband in its fifth generation, 95% of the world’s population now have access to a mobile broadband network and 88% are accessing 4G networks (International Telecommunication Union, 2021).
Mobile networks have become critical national infrastructure because of the vital public service applications they underpin. Each generation represents a step change in capability, coverage and quality of service, never has this been greater than for 5G. 5G, distributed through standalone infrastructure, has wide reaching implications for society, from remote surgical procedures to autonomous private and public transport vehicles. 5G infrastructure will also require significant investment. So alongside making such an investment, the UK will also need to assess the potential benefits and risks, identifying the supporting policy that might be needed to maximise the benefits we derive.
Demand for connectivity is driven by a range of factors, from the quality and variety of digital services available, to public trust in technology and attitudes to use of personal data. The future in these areas is highly uncertain but will have a significant impact on how easy it is to achieve wireless policy objectives, so considering alternative scenarios is essential. This report aims to do just that; articulate 4 future worlds in which to test and plan wireless public services that are resilient to different future outcomes – to help government achieve its objectives for society and keep the UK competitive on the global stage.
Sir Patrick Vallance
Government Chief Scientific Adviser
Executive summary
Wireless connectivity has become increasingly critical for different aspects of our lives, from keeping in touch, to getting around, to accessing a range of important services. This report sets out the evidence on the critical uncertainties around demand for wireless connectivity and the implications for delivery of wireless public services in 2030. These uncertainties are combined into a set of scenarios that can be used to help develop more resilient policies.
Key messages
The report highlights 4 key areas for consideration in the design of policies that develop or make use of wireless connectivity.
Public support and service provider engagement are just as vital to shaping future demand as providing infrastructure. Both are key to avoiding a future in which infrastructure is not fully utilised and the potential benefits from public service transformation are missed. Policymakers should consider measures to stimulate demand for connectivity in the public sector in addition to encouraging the market for infrastructure supply.
There are risks to a high-innovation, high-adoption world. Our scenarios highlight that an ‘always-on’ digitally connected culture could have ramifications for online safety and population health and wellbeing. Managing network and digital service resilience in such a connected world could also be a challenge and missing the mark will undermine public trust. If this is the future policymakers find most attractive, action should be taken to manage these risks.
Some public use cases would be held back more by a lower wireless infrastructure ambition than others. Some public use cases demand much more bandwidth than others, for example remote patient monitoring and autonomous vehicles. It follows that lower coverage ambitions could hinder these use cases most. There is risk that underestimating demand could inhibit progress, with infrastructure the key limiting factor relative to other barriers.
Levers that balance supply and demand would be a useful addition to the wireless policy toolkit. The scenarios highlight the risks of supply and demand for wireless connectivity being out of balance, and the benefits of getting this balance right. These scenarios can be used by DCMS and other government departments to explore the supply-side policy levers (infrastructure) and the demand-side policy levers (digital public services) that could be used in different circumstances to mitigate risk and maximise benefit.
Scenario development
GO-Science developed these Wireless 2030 scenarios in collaboration with experts in academia, industry and other government departments. Using tried and tested futures techniques, the scenarios are designed to stretch our perception of what could happen. They uncover possibilities for the future, risks and opportunities that we may otherwise not see.
The project started with a horizon scanning exercise, which revealed 63 drivers of change in the wireless connectivity landscape, driver mapping highlighted 26 of the most critical and uncertain drivers which were grouped into a set of key themes likely to affect the 2030 wireless landscape:
- Governance agenda – How infrastructure and ‘experience design’ decisions are made and by whom.
- Public perception – The extent users interact with systems and trust providers.
- Network design – How the network is distributed and directs flows of data and investment.
- Sustainability and resources – The availability of resources including energy and the UK’s ability to support innovations to market.
- Stores of value – How people, business and broader sectors will derive and exchange value via new wireless capabilities.
The Wireless 2030 scenarios were constructed using 2 ‘axes of uncertainty’ - critical uncertainties whose different outcomes (either end of the ‘axis’) can be combined together to create plausible and distinct scenarios . These axes are described in Table 1 below:
Table 1: Wireless 2030 scenario axes explained - how the critical uncertainties relate to scenario construction
| X-axis | Y-axis |
|---|---|
| Level of technological innovation, covering the following themes: Sustainability and resources; Network design; Governance agenda (specifically: institutional skills and capacity) | Attitudes to connectivity, covering the following themes: Public perception; Stores of value; Governance agenda (specifically: institutional attitudes) |
On the X-axis, the technology and connectivity landscape is either mature, ubiquitous and well-integrated or immature, stretched and scrutinised. Evolution rather than innovation drives infrastructure upgrades.
On the Y-axis, citizens and organisations are either engaged, skilled and reliant on connectivity on a large scale (generationally and geographically) or fragmented, sceptical and at the very edge, opt-out of digital living entirely.
Plotting these variable environments against each other produced a 2x2 matrix that set out 4 future worlds, as shown in Figure 1.

2x2 matrix, each cell represents a scenario. X-axis represents level of tech evolution & Y-axis uptake of digital living. Top left cell is scenario B: Unmet Promises; bottom left A: Slow Progress; bottom right C: Us & Them; top right D: Seamless Citizen.
Figure 1: Wireless 2030 scenarios.
Four potential future scenarios for the wireless landscape in 2030 have been developed to help stress-test government wireless policy.
An overview of each of the Wireless 2030 scenarios is provided below:
- Scenario A: Slow Progress - Late 4G infrastructure coverage has expanded but the pace of tech adoption has plateaued. This slow-down provides space for companies to meet citizen demand in more conscientious and inclusive ways. Those that opt out of digital living aren’t able to access key digital services.
- Scenario B: Unmet Promises - Late 4G infrastructure coverage has expanded fuelling demand for advanced services and setting high expectations for access and delivery. However, innovation and commercialisation challenges mean the advanced 5G/6G connectivity is out of reach.
- Scenario C: Us and Them - Investment and innovation has been concentrated where the wealth is. Private companies set the agenda. Secure and high-quality connectivity is the privilege of those who have the money and the required digital skills. This leads to an uneven patchwork of demand for new digital services across society.
- Scenario D: Seamless Citizen - Citizens and industry embrace full digitisation and demand facilitates the rollout of advanced network infrastructure throughout the UK. This new quality and ubiquity of connectivity unlocks opportunities for prosperity but is demanding of people’s data, energy and mental health.
Demand analysis
In addition to the scenario narratives, a quantification of potential demand signals in each scenario was undertaken. This considered 14 use cases spread across 6 sectors: culture, education, environment, healthcare, security and transport.
The aim was to analyse a set of important digital or wireless enabled transitions underway in each of these sectors and understand the range of plausible wireless demands from these applications by 2030. This analysis demonstrated that some public use cases would require much more bandwidth that others, so would be held back more by a lower coverage ambition, as illustrated in Figure 2.
| Wireless Use Case Data Demands (Tbit/s) | Seamless Citizen | Slow Progress | Unmet promises | Us & Them |
|---|---|---|---|---|
| Cultural - VR gaming & Entertainment | 48 | 12 | 24 | 36 |
| Cultural - VR Social/Communications | 24 | 6 | 12 | 18 |
| Education - Screen based Remote Learning | 0.027 | 0.0079 | 0.015 | 0.015 |
| Education - VR Remote Learning | 13 | 3.9 | 7.2 | 7.2 |
| Environment - Rural Monitoring | 0.000011 | 0.0000028 | 0.0000057 | 0.0000057 |
| Environment - Urban Monitoring | 11 | 2.9 | 4.3 | 8.6 |
| Environment - Smart Grids | 0.038 | 0.0042 | 0.013 | 0.016 |
| Healthcare - Monitoring | 0.02 | 0.0073 | 0.0098 | 0.016 |
| Healthcare - Procedures | 5.1 | 0.51 | 1.1 | 2.3 |
| Security – Mobile Surveillance | 0.00015 | 0.00011 | 0.00013 | 0.00015 |
| Security - Static Surveillance | 0.76 | 0.13 | 0.13 | 0.76 |
| Transport - Connected Vehicles | 0.29 | 0.038 | 0.17 | 0.15 |
| Transport – Connected and Autonomous Vehicles | 41 | 0.25 | 5.6 | 13 |
| Transport - Connected Micromobility | 0.000058 | 0.0001 | 0.00012 | 0.00007 |
Figure 2: Variation in Wireless 2030 public sector use case data demands.
This illustrative analysis explores how public sector demand for selected use cases varies across the scenarios. It does not provide a comprehensive estimate of total demand.
Scenarios and strategy
These scenarios and our analysis are intended to be used by DCMS and other government departments to make better, more resilient wireless policy. This report outlines 3 ways the scenarios can be used to interrogate policy and strategy development, as in Figure 3 below.
| Method | Step 1 | Step 2 | Step 3 |
|---|---|---|---|
| Backcasting: Working back from an aspirational future to learn about the pathway(s) to achieving it | Starting with ambition Statements (drawn from scenario planning), e.g.: In 2030, we will be…x; We want to have…x; Organisations will…x; People will…x | Broken down into aspects of delivery, e.g. if we aspire to X in 2030, what does that look like for: Public dialogue and comms; Existing or new policies; Resources or investment; Etc… | And for each aspect of delivery, what would we have to achieve…: …by 2028?; …by 2025?; …by next year?; In the next 6 months? |
| Wind Tunnelling: Stress-testing policies and strategies against a range of future conditions | Starting with an existing proposal, plan or belief – which could be: A stated / strategic objective; A policy (in development or post-launch); An existing strategy; An assumption being made about the future | And applying a ‘Pre Mortem’: Does this [proposal/policy/plan] succeed or fail in X future scenario? Why?; Does this [assumption/belief] remain true and relevant?; What must we start, stop, adapt or accelerate to mitigate our risk of failure across a range of future scenarios? | |
| Disruptors: Building resilience to low likelihood / high impact events and phenomena | Starting with a set of scenarios, applying 3 kinds of disruptor, or ‘shock’ to each. What happens in X scenario if: A policy we expect to work, doesn’t? Trends we expect to continue, don’t? Things we don’t expect to happen, do? | Considering: How does this stretch our sense of what’s possible?; Does our strategy take into account these possibilities and vulnerabilities? |
Figure 3: Three ways to apply the Wireless 2030 scenarios to strategy development.
Each exercise is highly customisable and can be applied at the beginning, middle or end of strategy or policy development. More detail on how to use these scenarios can be found in Chapter 5 of this report.
1. Introduction
Background and an overview to the Government Office for Science’s Wireless 2030 project.
Background
Wireless technology
Wireless infrastructure relies on electromagnetic waves – oscillations in electrical and magnetic fields at right angles to the direction the wave is travelling. Every electromagnetic wave has a frequency, measured in Hertz or Hz (wavelengths per second). These frequencies, in order from lowest to highest, are known as the electromagnetic spectrum (Figure 4, below , outlines approximate frequencies of common applications ).

The electromagnetic spectrum showing; Radio waves, Microwaves, Infrared, Visible light, X-rays & Gamma rays, with a corresponding scale of frequency in Hertz (Hz). 3mHz is shown as aligning to radio waves, 3tHz to infrared & 3eHz to X-rays.
Figure 4: Schematic of the electromagnetic spectrum.
Electromagnetic waves can transfer energy from the source of the wave to an absorber. Communication networks make use of radio waves split into ranges or ‘bands’. UK mobile networks typically use frequencies between 800 MHz and 3.6 GHz (approximating 8 x 10⁸ – 3.6 x 10⁹ Hz). For context, Wi-Fi uses frequencies between 2GHz and 5GHz.
In wireless infrastructure, wireless devices can communicate with each other or communicate with a wired network (Manganaro & Leenaerts, 2013). Wi-Fi is an example of wireless infrastructure because a Wi-Fi-enabled device, such as a laptop, is able to pick up radio signals being transmitted by a router located in a home or business. Mobile networks, also an example of wireless infrastructure, use cellular towers to transmit data between devices. Mobile networks can also be used to broadcast Wi-Fi signals to connect non-cellular devices to the internet.
The capability of the cellular network depends on the type of network connection. Currently for the UK, this includes:
- 2G – while 2G mobile networks have since been decommissioned, a basic 2G signal remains in remote locations such as rural Scotland, parts of North Norfolk, Wales and Cornwall to enable voice calling.
- 3G – the first commercial use of the 3G network was launched by Three UK in 2003, supporting video calling and improved mobile internet. According to Vodafone, less than 4% of data used by customers is carried on this network (Vodafone Press Office, 2022). Earlier in 2022, the UK Mobile Network Operators (MNOs) announced that they would be retiring their 3G networks in 2033.
- 4G LTE – 4G LTE (Long Term Evolution) was the next major advancement to mobile communication networks. 4G was launched in 2013 and brought with it high-definition streaming, gaming and video conferencing.
- 5G – 5G officially arrived in the UK in 2019, and has utilised existing 4G infrastructure, but coverage is not yet widespread. 5G will deliver higher peak data speeds, ultra-low latency (delays in data transfer) and massive network capacity, but ‘true’ 5G requires upgraded infrastructure to current 4G networks (Figure 5: 4G vs. Standalone 5G network architecture.).

Left: a server feeds data to a 4G Macro mast, which transmits data to a person’s phone. Right: a server feeds data to a 5G Macro mast, which transmits data to people’s devices and cars directly and via multiple smaller 5G Small Cell masts.
Figure 5: 4G vs. Standalone 5G network architecture.
The future of telecoms is complex and uncertain. 5G represents a significant upgrade in network capability and will deliver higher peak-data speeds, ultra-low latency and massive network capacity. Some applications of 5G are able to run on the UK’s current 4G network infrastructure (non-standalone 5G), but truly revolutionising uses, that will underpin a digitally and data driven economy, require the functionality of standalone 5G network infrastructure.
5G has created renewed interest in private networks – networks that are just used by a specific set of users, either within an organisation or local area (for example, a science park). Some private networks are valuable in the public sector as well as the private arena when considering shared office building and data centre facilities. Private networks need to be designed across technology and telecoms boundaries. This necessitates consideration of the effect of convergence and greater data use across these traditionally separate regulatory boundaries.
International context
The current global backdrop provides important context for the UK’s future wireless outlook, because developments in network technologies, platforms and practices are often driven by large multi-national companies and by the demands of the largest global markets. However, the UK has the potential to shape such developments, particularly in areas of strong existing capability. Key considerations include:
- Cycles for cellular standards are typically every 8-10 years. Other countries have led the way in terms of implementing 5G and 6G initiatives, with initiatives in China, Europe and collaboration between the US and Japan planned to accelerate 6G innovation.
- The UK currently has strengths in a range of collaborative initiatives with some of these countries and in fundamental research areas including network management, radio systems, semiconductors, photonics, quantum, THz and LiFi.
- The UK also ranks third after the US and China in terms of the location of the world’s biggest start-ups; Revolut, a UK Fintech start-up, valued at $33 billion, was listed amongst the world’s top 10 ‘unicorns’ in 2021 (Wallach & Amoros, 2021).
- 5G and 6G are not the only innovations which will shape the future of communications - new players are emerging and circumnavigating the geopolitics associated with 5G provisioning. Examples include those using Open-RAN technology, such as Rakuten (based in Japan) and the low-latency broadband internet system in development from Elon Musk’s Starlink.
National context
The governments Integrated Review (IR) (Cabinet Office, 2021) set out an ambition to take a more active approach to building and sustaining strategic advantage through science and technology (S&T), using it in support of our national goals and enhancing UK influence. The IR described adopting the own-collaborate-access framework to guide government activity in priority areas of S&T, determining where the UK would seek to have leadership and ownership of new developments.
The IR identified the future security of UK telecoms networks as an area that required an active approach from government: to diversify the 5G supply chain; mitigate risks from high-risk vendors and ensure network resilience. Clearly, the development of future technology is a critical part of this agenda. However, it will also require consideration of how best to use the opportunities future network technologies provide – as citizens, in the economy and in the delivery of public services. This report is a contribution to that agenda.
DCMS is developing a Wireless Infrastructure Strategy and coverage ambition, which will help to set out the future of 5G and 6G in the UK. They commissioned a longer-term analysis from GO-Science to address the question:
What is the future of UK demand for wireless connectivity, and how might this shape public service delivery out to 2030?
Working with expert stakeholders, both internal and external to HMG, the GO-Science Foresight team have developed a set of high-level 2030 scenarios. These alternative, plausible futures form part of the evidence gathered for the Wireless Infrastructure Strategy. They are also intended as contextual backdrops for other government departments to explore and assess strategic implications for their own priorities and policies.
Project purpose
The Wireless 2030 project addresses a number of evidence gaps and helps HMG to develop strategies for meeting ambitious objectives in the face of uncertainty. This project set out to explore a range of issues:
- provide evidence on how public service demand for wireless could change in future, and support thinking about how to stimulate that.
- set out the international context against which demand for wireless infrastructure will develop in the UK.
- explore an uncertain technology landscape, providing a tool for government to test its policies and plans against.
- support government to set a clear ambition for wireless infrastructure, which is resilient to different futures, providing confidence to investors.
- support government and service providers in consider how digital networks could play a role in future public service design.
Project scope
The scope of this project is intentionally broad and flexible to capture edge cases. While the time horizon is 2030, infrastructure provisioning is a long-term investment, therefore it is important to consider the effects of near-term policy decisions on society beyond 2030 . For the purposes of this project, the following domains were considered within scope:
- 1. Public Services: Entirely or partially government funded services delivered in the interest of the public. The public service areas addressed within this report include:
- a. Cultural; encompass museums, libraries, heritage and culture
- b. Healthcare; encompass wellbeing, healthcare and social care
- c. Transport; encompass mobility and transport infrastructure
- d. Environment; encompass environmental protection and services
- e. Education; encompass all educational and knowledge provision services
- f. Security; encompass both defence and security domains
- 2. Wireless Technology: All wireless technologies, including 4G, Wi-Fi, satellites, and future wireless networks
- 3. Private Sector: Although this project is primarily focused on public sector demand it does not ignore the influence that the private sector has on public sector demand, both as a driver of change and competitor to public sector users
- 4. Time Horizon: The timeline for this project is 2030, in line with DCMS’ forthcoming Wireless Infrastructure Strategy
Domains considered out of scope of the Wireless 2030 project: The focus of the scenarios is on public service demand and not on corporate resources of public institutions (for example back-office IT). However, we have captured cases where wireless networks will support private use of public infrastructure, for example, transport applications. Work to understand non-public sector demand is being carried out in parallel to this study by colleagues in DCMS.
Project process
Figure 6 provides an illustrative overview of the Wireless 2030 project methodology, which was based on methodology described in the GO-Science Futures Toolkit (Government Office for Science, 2014).

The content of this figure is provided in the table below in an accessible format.
Figure 6: Wireless 2030 project process timeline.
(Figure 6 - see full size image)
The section below provides a breakdown of the information provided in Figure 6 in an accessible format:
WHAT is happening?
Step 1 – Knowledge Audit: GOS & DCMS undertook an evidence deep dive & further desk research
Step 2 – Expert 7Q Interviews and Survey: Including CSAs, academic, public & private sector experts
Step 3 – Driver Mapping: Synthesis of evidence gathered into a long-list of political, economic, societal, technological, legislative & environmental drivers shaping the future policy environment
WHAT could happen?
Step 4 - Expert Workshop 1: Identifying Key Drivers & Critical Uncertainties: Scoring of drivers to identify those most important & uncertain. Clustering key drivers to identify critical uncertainties & developing axes of uncertainty.
Step 5 - Rationalising Key Axes of Uncertainty: Process of elimination (top-down) & impact mapping (bottom-up) approaches used to draw out the most plausible & interesting axes of uncertainty pairings from which to build scenarios.
Step 6 - Scenario Development: Building of scenarios and underpinning with assumptions based on key drivers & expert descriptions of axes of uncertainty developed in Workshop 1.
SO WHAT for public service delivery?
Step 7 - Expert Workshop 2: Challenging Assumptions & Adding Richness to Scenarios: Participants provided vital challenge & insights into how public services may be delivered & used in the 4 worlds. SWOT analysis of scenarios to establish assumptions & elucidate scenario parameters.
Step 8 - Quantitative Modelling: ‘Light touch’ Excel-based model developed & applied to a diverse range of public sector use cases, illustrating the breadth of potential wireless connectivity application. Provided insight into public sector uptake, usage & data demand across the scenarios (not an assessment of service quality or total demand).
NOW WHAT for strategy?
Step 9 - Internal & External Challenge: Review of scenario narratives, assumptions & quantitative modelling by stakeholders with public sector specific expertise.
Step 10 - Application to strategy & policy: Tools/guidance developed to enable policy-makers to apply scenarios in policy & strategy development. Workshop held with DCMS to identify implications for & stress-test aspects of the Wireless Infrastructure Strategy.
2. Evidence and uncertainties
Five of the most critical and uncertain drivers of change and 14 public sector use cases used to explore the wireless infrastructure landscape.
GO-Science carried out a Horizon Scanning exercise, drawing on desk research and 15 expert interviews (using the 7 Questions methodology), to identify a long-list of 63 drivers of change; evidenced trends and weak signals likely to shape future wireless infrastructure in the UK. This evidence, structured into key political [Po], economic [Ec], societal [So], technological [Te], legislative [Le] and environmental [En] drivers shaping the future policy environment formed the basis of our first scenario development workshops.
GO-Science conducted the initial uncertainties workshop with over 40 experts and stakeholders from industry, academia and government. The drivers of change were mapped against 2 axes – their importance to the wireless landscape in 2030; and uncertainty in their outcome. The drivers in the top right quadrant (most important and most uncertain) were the critical uncertainties from which to develop the scenarios. These critical uncertainties were grouped into a set of key themes likely to affect the 2030 wireless landscape:
-
Governance agenda - How infrastructure and ‘experience design’ decisions are made and by whom.
-
Public perception - The extent users interact with systems and trust providers.
-
Network design - How the network is distributed and directs flows of data and investment.
-
Sustainability and resources - The availability of resources including energy and the UK’s ability to support innovations to market.
-
Stores of value - How people, business and broader sectors will derive and exchange value via new wireless capabilities.
These themes are discussed in more detail in the following sections, describing each critical uncertainty and its different possible trajectories towards 2030. Evidence and sources used to create the critical uncertainties can be found in the annex.
Fourteen public sector use cases were selected to enable an analysis of the important digital or wireless enabled transitions underway in each of these sectors and understand the range of plausible wireless demands from these applications by 2030. Desk research was carried out to provide an assessment of maturity and a theoretical outlook for these use cases and is described in Table 7, at the end of this chapter.
Note on the role of government
Government will play a key role in shaping the future of wireless infrastructure. But it is important to treat government action differently to other forces and factors considered within our critical uncertainties and scenarios, as the scenarios will be used by government as ‘backdrops’ to test the resilience of such interventions (wireless strategies, policies, investments, regulations). We have aimed to develop the scenarios in a way that focuses on contextual factors, external to government policy, in order to make this testing more straightforward.
The following key principles have been followed:
- The scenarios do not include detailed assumptions about future UK government wireless policy. They represent external contexts in which UK government wireless policy can be tested.
- There are some policy-related factors that are external to UK government wireless policy, such as international standards or the digital skills of people working in public service delivery, for which it is helpful to make high-level assumptions in the scenarios to ensure plausibility.
- In other cases, it is plausible that certain future UK government wireless policies could lead to specific scenario outcomes, but as there are usually multiple plausible routes to each outcome, we leave some ambiguity over the precise causality in these cases.
Critical uncertainties
1. Governance agenda
How infrastructure and ‘experience design’ decisions are made and by whom.
How authorities and companies manage and use spectrum, supporting infrastructure and digital spaces has changed significantly. For example, 80% of recent investments in new cables has flowed from 2 US tech giants rather than telecoms firms (Ball, 2021) (uncertainty [Po04], Table 2).
Data protection differs in many ways between territories and jurisdictions, producing an ecosystem of overlapping, applicable rules and redefining the exercise of sovereignties (Government Office for Science, 2020). To complicate matters, data has unusual properties and data value chains are highly nonlinear (De La Chapelle, 2021) (uncertainty [Po07], Table 2Table 2: Critical uncertainties with the governance agenda theme). Such uncertainties include:
- What are the dominant network/market design principles?
- Where is the balance of public versus private power?
- Is there market/consumer appetite for regulatory change?
- Who are the key actors and decision-makers, in the UK and internationally?
- Is top-down or bottom-up governance the preferred model?
Table 2: Critical uncertainties with the governance agenda theme
| Identifier | Critical uncertainty | Description (see annex for evidence sources) |
|---|---|---|
| Le03 | Level of responsibility placed on companies for maintaining high quality, secure services | MNOs and Big Tech companies are increasingly accountable for failures and vulnerabilities in the complex, scaled infrastructure they manage. The extent to which legislation enforcing this accountability keeps pace with rapid developments in technology platforms in the coming years remains uncertain. |
| Le05 | Uncertain appetite for refreshed regulation of spectrum governance | Some industry experts claim stringent regulation, combined with consumer expectations for affordability continues to put pressure on MNO profit margins and reduce available funds for research and development. There is uncertainty over the current extent of this issue and whether it will continue in future. |
| Po02 | Potential fragmenting of global design and regulation of cyberspace | Whilst multilateral organisations focus on the potential for next generation connectivity (5G & 6G) to deliver on the Sustainable Development Goals, different national/regional governance approaches are emerging and often conflicting. The dominance of China in digital innovation and standard-setting is growing, particularly through the Belt-and-Road initiative. The UK’s future decision-making on standards will also likely be influenced by both EU and FVEY alliances. How these different influences will combine remains uncertain. |
| Po04 | Complexity of infrastructure ownership | The hardware underpinning wireless is a hotly contested asset. Whilst multiple owners (tech companies, telecoms, MNOs, investors, states) barter over speeds and capacities, some of the biggest companies in the world are driving increasingly ambitious infrastructure projects; with ownership comes power (governance and political leverage). This could continue, or issues could be simplified and resolved over the medium term. |
| Po07 | Polarising views on data sovereignty | As data regimes and policies emerge as more autocratic or more liberal in different parts of the world, the debate surrounding ‘data sovereignty’, e.g., ownership and control of personal data and digital identity, rages on. In the UK, some experts argue for total individual sovereignty, whilst others advocate for ‘citizen-centric’ design in which data is still held and managed by authorities/governing bodies. |
2. Public perception
The extent users interact with systems and trust providers.
Public perception is a major factor influencing demand on wireless networks and highlights the critical issue of trust in governments, service providers and the technologies themselves. Building trust in a technology can increase its uptake among the public (AlShahrani, 2019). This stronger public trust, and resulting wider adoption, could unlock the potential for new models of engagement and communication (AlShahrani, 2019) (Xin Li, 2008) (Tammy Bahmanziari, 2003).
Improved accessibility and transparency can build trust. In some locations, ubiquitous connectivity has given rise to reimagined democratic systems, for example, Taiwan’s GovZero platform (uncertainty [Po06], Table 3). Whereas the spread of misinformation, such as via social media, can undermine trust (uncertainty [So08], Table 3).
Such uncertainties include:
- How comfortable will citizens feel living and working within wireless networks?
- Where are the sources of trust and how strong are they?
- Who determines the evidence base for risk?
- Is convenience or privacy prioritised?
Table 3: Critical uncertainties associated with the public perception theme
| Identifier | Critical uncertainty | Description (see annex for evidence sources) |
|---|---|---|
| Po05 | Levels of trust in government | In 2022, the ONS found 35% of the population report trust in the government, although much higher levels are reported in different services provided by government. This could, in turn, mean lower confidence in plans for wireless infrastructure (Office for National Statistics, 2022). This has left individuals more open to misinformation (for example, campaigns about the supposed health effects of 5G masts) and less likely to engage with initiatives to up-skill or decrease the digital divide. There is scope for this to continue or for levels of trust to increase in the future. |
| Po06 | Emergence of new models of citizen engagement & communication | Increasingly ubiquitous connectivity is creating the potential for a reimagined democracy. The emergence of collaborative platforms and social channels have allowed a new dynamic of ‘bottom-up’ governance, engagement, and community expression. Groups have the ability to build and share tools that empower people to evaluate their government and exert their democratic right to decide how politicians act. Will they use it? |
| So03 | Widening digital divide (generational) | Digital inequality has been identified between generations. The switch from analogue telephone lines to digital by 2025 could have a huge impact on services such as health and social care. ‘Non-digital natives’ could be left underserved by some mobile services and digital ecosystems if they are unable to adapt. |
| So07 | Use of tracking, surveillance and life management solutions | From home security and monitoring systems such as Ring, to tracking systems such as Apple’s Find My Friends and health monitoring systems such as Dexcom wearable glucose monitor, life and health management solutions are increasingly prevalent across generations. This is likely to increase, but by how much? |
| So08 | Emergence of new community structures and dynamics | Traditional household and community structures continue to reconfigure over time, with birthplace becoming less of a determining factor in where people live and who they spend time with. Affiliations are forged in communities of interest, and increasingly online. The scale and direction of future reconfigurations is uncertain. |
| So09 | Quality of human-machine interface | User experience (UX) is the ultimate goal for the software developers, experience designers and tech companies disrupting every sector. It is seen as important to attracting and keeping users, as well as full accessibility, navigating systems and assistive technologies. Companies are combining translation services, image recognition services, and audio transcription services, with the aim of helping people to engage and interact with others and with activities in exciting and easy ways. Will they succeed? |
| Le02 | Volume and variety of cybercrime and cyberthreat | The nature of cybersecurity threats is becoming more diverse due to the increasing range of connected devices. There are also more cybercriminals in operation, with varied motives. The direction of travel is clear, but the scale of the problem remains uncertain. |
3. Network design
How the network is distributed and directs flows of data and investment.
The future shape, structure and design of wireless networks is uncertain – there are unknowns around openness, distribution, resilience and data flows.
This theme also explores the issue of the inequality in geographical coverage of networks and whether this will persist. Projections suggest that £12-26 billion could be added to the UK’s economy by successfully unlocking the digital potential of rural areas (Wilson, et al., 2018) (uncertainty [So04], Table 4).
How users access services is changing. During the third quarter of 2020, chat and messenger apps recorded the highest user reach with close to 91% of internet users worldwide using these types of apps (Ceci, 2022) (uncertainty [So13], Table 4).
Such uncertainties include:
- How distributed and/or open will wireless networks be?
- How interoperable or compatible?
- How does data move through and between networks?
- To what extent is resilience built in?
Table 4: Critical uncertainties associated with the network design theme
| Identifier | Critical uncertainty | Description (see annex for evidence sources) |
|---|---|---|
| Ec02 | Investment shifting towards tech-enabled ‘challengers’ in every sector | Enhanced connectivity has enabled the development and scaling of challengers to traditional sector models, be it EdTech, HealthTech, AgriTech etc; the UK remains a magnet for tech venture capital investment. However, the future pace of this shift is uncertain, and some sectors lack these tech players in their field. |
| Po09 | Trade-off between neutrality and innovation for networks | Increasing interest in network slicing will push boundaries for net neutrality. Each network slice is an isolated end-to-end network, tailored to fulfil diverse requirements requested by a particular application. Net neutrality regulation risks hindering innovation in networks, like network slicing. Uncertainty remains over whether this risk will materialise. |
| So04 | Widening digital divide (geographical) | Digital inequality is reflected in geographical differences, i.e., rural vs urban, where the availability of reliable, fast internet differs widely. Next generation network solutions could make it easier to level-up this divide, but it is currently unclear to what extent a connectivity gap will remain in future. |
| So13 | Expanding communications landscape beyond traditional telecoms | Social media has been a key driver of demand for connectivity, as well as other internet platforms that involve communicating digitally. Mobile data messaging services have mostly replaced telecoms-based ones e.g., WhatsApp over texts. What will the next big development in digital communications platforms be, and what will it mean for wireless demand? |
| Te06 | Level of fragmentation in the connectivity market | The connectivity market is being flooded with satellite, fixed and wireless market innovations. Governments, individuals and businesses have more options and take varied approaches to balancing investments in e.g., standalone masts or Low Earth Orbit satellites for optimised coverage. This fragmentation is starting to happen, but the end state in 2030 is unclear. |
4. Sustainability and resources
The availability of resources including energy and the UK’s ability to support innovations to market.
This theme captures critical uncertainties in the UK skills base, international dependencies, supply chain, investment and commercialisation challenges.
Demand for and reliance on digital skills is rising rapidly but participation in relevant courses has declined in schools, and employer investment in skills remains low. 1 in 3 employers say their workforce lacks the advanced digital skills needed (World Skills Uk, 2021) (uncertainty [Ec10], Table 5).
Increased energy consumption from networks may offset efficiency improvements. Some of the world’s largest data centres consume more than 100 MW of power, the equivalent of 80,000 US households (Hall, 2022) (uncertainty [En02], Table 5).
Such uncertainties include:
- To what extent will there be a skills gap for building, maintaining and capitalising on wireless infrastructure?
- Where will investment come from?
- How available will energy, materials and components be?
Table 5: Critical uncertainties associated with the sustainability and resources theme
| Identifier | Critical uncertainty | Description (see annex for evidence sources) |
|---|---|---|
| Te12 | Ongoing challenges related to the commercialisation of innovations in the UK | The UK is a world-leader in research, but there is evidence of a current relative weakness in bringing those new innovations to market at scale. However, efforts to improve the UK’s innovation system could resolve this issue between now and 2030. |
| Ec10 | Gap in skills to support the digital economy | Increasingly digitalised supply chains require skilled workers to build and operate them. As networks become more complex, these required skills become more specialised. There is uncertainty over whether the education and skills systems will keep pace with these changing requirements. |
| En02 | Energy demands for connectivity and data management | Keeping an advanced network functioning will require significant power e.g., from wireless charging of devices to data storage centres and data transfer. However, advances in energy efficient technologies might offset increases. |
| En03 | Demand for natural resources for digital infrastructure development | Competition is intensifying for the critical natural minerals needed for wireless hardware and device supply chains. Many of these are concentrated in a small number of locations, and are becoming rarer. The future balance of supply and demand is uncertain. |
5. Stores of value
How people, business and broader sectors will derive and exchange value via new wireless capabilities.
The digital economy now represents a substantial share of the UK’s economy, contributing £148 billion in 2019 (Department for Digital, Culture, Media & Sport, 2021). New business models have emerged, that challenge the status quo. For example, some supermarket chains are piloting checkout free shops, with RFID (Radio-Frequency Identification) tracking being trialled at Tesco, Sainsbury’s and Amazon Go, whilst Aldi trials facial recognition technology (Evening Standard, 2022) (uncertainty [Ec07], Table 6).
Advanced mobile networks have the potential to positively impact business productivity, by enabling automation, AI optimisation and technological solutions to operational challenges. For example, a Deloitte and MAPI study found that 86% of manufacturers believe that smart manufacturing initiatives will be the main driver of manufacturing competitiveness in 5 years (Deloitte and MAPI, 2019) (uncertainty [Te04], Table 6).
Such uncertainties include:
- Which ‘currencies’ will grow in value and which will lose value?
- To what extent are productivity gains from wireless connectivity realised and how quickly?
- What are the dominant modes or vehicles for value exchange?
Table 6: Critical uncertainties associated with the stores of value theme
| Identifier | Critical uncertainty | Description (see annex for evidence sources) |
|---|---|---|
| Ec01 | Potential for productivity gains related to ‘Industry 4.0’ | Industry 4.0 aims to drive digital manufacturing forward by increasing digitalisation and the interconnection of products, value chains and business models. Sensor network data, along with automation and robotisation represent a new era of production power for sectors and organisations able to invest in tech adoption and a reimagined/retrained workforce. Many commentators are predicting productivity impacts from this shift, but it is possible that these won’t fully materialise. |
| Ec06 | ‘Tokenisation’ of goods and information | In tandem with the evolution of our digital identities, digital twins, and distributed ledgers, there is a possibility that in the near future any asset, currency, utility or even identity could be ‘tokenised’ for trade in cyberspace. |
| Ec07 | Emerging models of payment, pricing and access | New forms of transaction are mainstreaming in the UK; contactless payments evolve to ‘check-in’ rather than ‘check-out’ points of sale, while subscription evolves to on-demand micropayments for services, informed by demand data in real time. Looking ahead, experiments into micropayments by organisations to citizens (for their time, their ideas or their data) may start to scale. |
| Te01 | Use of ‘digital twins’ | Digital twins for mapping and decision making, for example through intelligent autonomous systems, may become more and more prevalent. Where buildings, home interiors and individual identities have real-time digital equivalents, commercial opportunities and ethical challenges will arise. There are uncertainties in the future uptake and impact of this technology. |
| Te04 | Development of connected industry (‘Industry 4.0’) | Traditional methods of working in industry are starting to be replaced with connected and technologically enhanced solutions: see Agri-Tech, smart manufacturing, transportation (CAVS road and rail). How widespread will this be by 2030? |
Wireless use cases
When thinking about how public sector demand for wireless infrastructure may change out to 2030, it is important to consider what it could be used for. 14 public sector use cases were selected to address the question; ‘what are the key digital/wireless enabled transitions underway in each of the service areas we cover?’. Assessments of the applicability of each use case, its maturity and 2030 outlook, shown in Table 7 below, were developed through desk research before being reviewed by a small group of experts from government and industry .
Table 7: A description of each public sector use case and its technological maturity
[Key: High = available in the market now, Medium = likely to become available in the next few years, Low = availability uncertain or speculative].
| Sector | Use Case | Description: What is the use case? How could it be used in public services? | Level of maturity | Theoretical outlook for 2030 |
|---|---|---|---|---|
| Cultural | VR Gaming & Entertainment | Accessing VR based entertainment, for example gaming, travel, TV, theatre, films and experiences. | High | Widespread adoption is likely, even modest uptake could lead to significant demands. |
| Cultural | VR Social / Communications | The use of Virtual Reality technology for social and communication purposes, for calling friends and family and interacting within social networks, such is the intention of Meta’s Metaverse. | Medium | Widespread adoption is likely and could lead to significant demands, even where there is modest uptake, data demands will be sufficient to require some service provision. |
| Education | Screen-Based Remote Learning | Full or part-time education delivered via screens. We have focused on higher education as the most likely initial market. Either remotely from the university or at university premises. | High | Already there has been widespread adoption and this is likely to remain, data demands will be largely served by fixed networks and will remain low. |
| Education | VR Remote Learning | Full and part-time higher education delivered to students through Virtual Reality software and devices. Either remotely from the university or at university premises. | Low | Widespread adoption outside of higher education environments is unlikely. Data demands will require wireless infrastructure provision, some of this may be catered for by private networks on campuses. |
| Transport | Connected Micromobility | Connected micromobility vehicles are small electric or human powered vehicles that operate below 25 km/h under a shared-use model both docked and dock-less. For example, bicycles, e-bikes and e-scooters. | High | Widespread adoption is likely, particularly where infrastructure provision does not support the use of connected vehicles. Data demand per device is low and overall demand will remain low regardless of adoption levels. |
| Transport | Connected Vehicles | Cars, trucks, buses, and other vehicles will be able to ‘talk’ to each other with in-vehicle or aftermarket devices that continuously share important safety and mobility information with each other. They will also use wireless communication to ‘talk’ to traffic signals, work zones, toll booths, school zones, and other types of infrastructure. | Medium | Widespread adoption by 2030 is likely, but will be dependent on provision of supporting infrastructure, network coverage and economic factors. Data demand per device is low and demands will not be significant even where there is widespread uptake. |
| Transport | CAVs | ‘Autonomous Vehicles’ are expected to use information from on-board sensors and systems to understand their global position and local environment, enabling them to operate with little or no human input for some, or all, of their journey. | Low | Widespread adoption is unlikely, but even modest uptake could lead to significant demands. |
| Healthcare | Monitoring | Healthcare providers will use remote monitoring of patients both in consultations and between. This use case focuses on the use of wearables to monitor patients and provide information to them and healthcare professionals. | Medium | Widespread adoption is likely, however, the data demand per device is low, so meeting demand requirements will not require significant provision – adoption in non-urban centres will be limited by network coverage. |
| Healthcare | Procedures | Healthcare in future may have hospitals based on a hub and spoke model. This could create an operating model for outpatient and inpatient surgery delivery. A senior specialist surgeon could provide a full telepresence in the operating room or undertake the procedure via remote telesurgery. | Low | Widespread adoption is unlikely and largely hinges on public trust in the technologies. Fixed networks would likely provide some provisioning for this, and data demands will only become significant where there is widespread adoption. |
| Security | Surveillance - Static | Static CCTV cameras operated by public sector organisations, for example police, local councils, etc. | High | Further widespread adoption is likely as the technology is very well established. Data demands are low and will remain low even where there is widespread and increased uptake. |
| Security | Surveillance - Mobile | Police forces use drones in place of existing helicopter missions and also to cover additional incidents. Each will have an HD camera and automatically track targets. | Medium | Adoption is largely dependent on public trust and resilience to cyberattack. Data demands per device are low, so overall demand for data provision will remain low. |
| Environment | Smart Grids | An electricity supply network that uses digital communications technology to detect and react to local changes in usage. | Medium | Widespread adoption is likely. Data demands will remain low even with high uptake. |
| Environment | Urban Monitoring (Smart City) | A Smart City is an urban area which makes use of digital technologies and data to improve places by providing citizens with social, economic, and environmental benefits. This includes intelligent buildings, smart grids, public safety, weather sensors etc. | Medium | Widespread adoption is likely. The associated data demands will be sufficient to require some additional provisioning. |
| Environment | Rural Monitoring | Rural ecosystem and agricultural monitoring for example crop monitoring for optimisation of the harvest window or rural air quality monitoring. | Low | The extent of adoption will be dependent on or limited by network coverage in rural areas, as well as propensity of farms to adopt new technology. Data demands are low. |
3. Scenario construction
Building scenarios that are stretching yet plausible from axes of uncertainty.
Applying Futures to strategy and policy
There are many ways to define, develop and work with Futures scenarios. Regardless of methodology, content and time horizon, they are a well-established and valuable tool for strategic planning. Scenarios are never predictions, rather a way to imagine different versions of the future, explore how they could be brought about, identify the risks and opportunities they represent and decide what we should do now as a result.
The Wireless 2030 scenarios have been developed by honing-in on critical uncertainties related to the future of wireless technologies, the wider telecoms landscape and other factors shaping our world. Each uncertainty has alternative and extreme, yet plausible ‘end states’. A scenario is built from a combination of end states that feel coherent and could happen yet present us with different and interesting conditions.
Of course, none of the scenarios will individually or perfectly describe the ‘real’ future, which will likely feature elements of all these worlds. Getting strategic value from scenarios requires suspending your disbelief.
As you read each scenario, you can:
- Ask: How would we meet our team or departmental objectives in this scenario? What gets easier, and what becomes harder?
- Plan: How would we know whether we’re moving towards one or other of these futures? What would we need to measure and monitor to know this?
- Test: Your plan or policy proposal in this future world – does it still work? If not, how could you adapt it to be resilient to those different conditions?
- Consider: Which scenario is ‘best’ for the UK and/or the objective you are responsible for. Why? How could your work bring this about?
- Discuss: How would someone in another part of the world – other policymakers, citizens, service providers - read these scenarios? Would they have a different preferred future?
- Identify: aspects of the scenarios which are ‘good’ or ‘bad’; what influence does the UK have in realising or avoiding them? Is your proposal making certain scenarios more likely?
Building the scenario matrix
Scenarios are often constructed using 2 or more ‘axes of uncertainty’ – critical uncertainties whose different outcomes (either end of the ‘axis’) can be combined together to create plausible and distinct scenarios. The 5 critically uncertain themes, described in Chapter 2, were analysed in terms of their importance to each other using ‘impact mapping’ and ‘process of elimination’ techniques. This helped to draw out the most plausible and interesting axes of uncertainty parings from which to build scenarios . These axes were titled ‘level of technological innovation’ (as illustrated in Figure 7) and ‘attitudes to connectivity’ (as illustrated in Figure 8):
X = Level of technological innovation, covering the following themes:
- Sustainability and resources
- Network design
- Governance agenda (specifically: institutional skills and capacity)
At each end of the X-axis, the technology and connectivity landscape is either: Mature, ubiquitous and well-integrated. Innovation barriers are removed to see a seamless convergence of wireless and wired infrastructure, leading to a proliferation of new services and growth in demand. Or; Immature, stretched and scrutinised. Evolution rather than innovation drives infrastructure upgrades and regulatory and investment challenges limit exploration of next generation networks

A horizontal axis labelled ‘X-axis’ is shown: at the left end of the axis there is a box labelled ‘incremental tech evolution’; at the right end of the axis there is a box labelled ‘rapid tech evolution’.
Figure 7: Scenario matrix - X-axis.
Y = Attitudes to connectivity, covering the following themes:
- Public perception
- Stores of value
- Governance agenda (specifically: institutional attitudes)
At each end of the Y-axis, citizens and organisations are either: Engaged, skilled and reliant on connectivity on a large scale (generationally and geographically). Or; Fragmented, sceptical and at the very edge, opt-out of digital living entirely.

A vertical axis labelled ‘Y-axis’ is shown: at the top end of the axis there is a box labelled ‘digital living universally embraced’; at the bottom end of the axis there is a box labelled ‘fragmented uptake of digital living’.
Figure 8: Scenario matrix - Y-axis.
Scenarios summary
Four scenarios were constructed from the axes of uncertainty described in Figure 7 and Figure 8. These were underpinned with assumptions based on the critical uncertainties and expert descriptions of the axes of uncertainty developed through a workshop process. Figure 9 describes an overview of the key features of the 4 2030 worlds.

2x2 matrix, each cell represents a scenario. X-axis represents level of tech evolution & Y-axis uptake of digital living. Top left cell is scenario B: Unmet Promises; bottom left A: Slow Progress; bottom right C: Us & Them; top right D: Seamless Citizen.
Four potential future scenarios for the wireless landscape in 2030 have been developed to help stress-test government wireless policy
An overview of each of the Wireless 2030 scenarios is provided below:
- Scenario A: Slow Progress - Late 4G infrastructure coverage has expanded but the pace of tech adoption has plateaued. This slow-down provides space for companies to meet citizen demand in more conscientious and inclusive ways. Those that opt out of digital living aren’t able to access key digital services.
- Scenario B: Unmet Promises - Late 4G infrastructure coverage has expanded fuelling demand for advanced services and setting high expectations for access and delivery. However, innovation and commercialisation challenges mean the advanced 5G/6G connectivity is out of reach.
- Scenario C: Us and Them - Investment and innovation has been concentrated where the wealth is. Private companies set the agenda. Secure and high-quality connectivity is the privilege of those who have the money and the required digital skills. This leads to an uneven patchwork of demand for new digital services across society.
- Scenario D: Seamless Citizen - Citizens and industry embrace full digitisation and demand facilitates the rollout of advanced network infrastructure throughout the UK. This new quality and ubiquity of connectivity unlocks opportunities for prosperity but is demanding of people’s data, energy and mental health.
Scenario comparisons
Considering distinct and stretching scenarios enables policymakers to ensure strategy is resilient and less vulnerable to future shocks. As you read through these divergent Wireless 2030 scenarios, contemplate the risks, opportunities and consequences of each scenario and how policies might address them . Table 8 describes the implications of each of the scenarios on the public service areas highlighted as within the Wireless 2030 project scope in Chapter 1.
Table 8: A comparison of the public service delivery implications across the Wireless 2030 scenarios
| Implications for public service delivery | A: Slow Progress - Demand for connectivity is low, consumers generally support conscientious suppliers of services | B: Unmet Promises - Demand for connectivity is high but under served, consumers meet personal demand through any means necessary | C: Us & Them - Demand for connectivity is high but served inequitably, consumers with means have their needs met whereas others are excluded | D: Seamless Citizen - Demand for connectivity is high and in equilibrium with supply, needs are met through a cohesive mix of public and private entities |
|---|---|---|---|---|
| Culture | Virtual worlds are basic, but friendlier. Slow technological change has provided space to consider inclusivity and mental health in the design of digital culture and the virtual worlds it is transmitted through. While most people prefer cultural experiences in person, those who do socialise and game online have a healthier relationship with the online world than before. | Appetite for digital culture is unfulfilled. Responding to demand, creative industries attempt novel cultural streams, but technical limitations mean they can’t recreate the feel of live arts. Despite this, people consume digital culture in large volumes, although they often complain about a lack of new ideas. Traditional broadcast media retains a small cult following. | Paid-for content is high quality, but not open to all. VR use for gaming, entertainment and socialising is high amongst the wealthy, creating demand and jobs in this area. Many publicly funded cultural experiences remain free but rely on older technology and have limited appeal. | Most cultural experiences go digital. Immersive virtual travel, cultural events and experiences are more attractive, frequent and accessible. Growth in skills results in a lucrative creative job market. Despite becoming more digitally interactive, live arts events struggle to fill seats. |
| Education | Basic wireless EdTech is used more widely than today, with some previously left behind settings catching up. But institutions tend to prefer more secure, face to face delivery, and some places remain poorly connected so the full benefits of edtech remain untapped. | Tech-hungry students drive demand for EdTech. Advances abroad show the access benefits of remote learning, with university students seeking the best, immersive, digital education offers available globally. UK institutions lack the technical capability to compete. | EdTech advances are driven by private sector training. Investment in VR EdTech by big firms seeking to upskill their workers have generated high quality paid-for services. The cost limits demand and prevents some students from gaining the most advanced digital skills. | Education is technology-enabled, personalised and more accessible to young people and adults alike. A hybrid mix of in-person and virtual courses are the norm and fully remote students benefit from the same quality of service. Enrolment in STEM subjects grows and social mobility for tech graduates is good overall. |
| Environment | The potential for digital technologies to deliver improvements in system efficiencies has not been realised. Hybrid working is less popular, so more people opt to travel to work. Innovation in zero carbon technologies is sluggish. But the generation of e-waste slows as consumers opt to use devices for longer and shop second hand. | Green digital solutions are explored, but dead ends are common. Enthusiasm for digital living has focused leading minds on digital solutions to net zero. However, lack of technology availability means the full potential for environmental monitoring and smart grids are not realised. | Wireless environment tech is split across geographic divides. The rich live in urban centres, which drives demand for air quality improvements and monitoring in cities. Rural and sub-urban areas are left behind, with monitoring limited to that paid for by wealthy landowners. | Digital technologies live up to their green potential to improve energy efficiency and the successful management of rural and urban spaces. With location no longer a barrier to connectivity, there is no limit on where these technologies can be implemented, and demand is high across the whole country. |
| Healthcare | Low trust in technology hinders uptake in remote patient monitoring. A lack of network capability ensures remote procedures are not realised. Less advanced digital healthcare services are widely available, benefitting those more willing to embrace digitalisation . | Telemedicine is popular but limited in scope. Willingness to share personal data allows services to maximise the benefits of basic digital technology. The private health sector is starting to offer some advanced services, but this highlights the limitations of the NHS. | Private investment has enabled breakthroughs in remote patient care for the wealthy. However, this is largely limited to urban areas where private networks provide the levels of connectivity needed to deliver remote procedures. | Healthcare shifts from reactionary to preventative on a transformational scale thanks to wearables/consumables and connected diagnostics. Digital fatigue leads to a spike in mental health conditions and loneliness. People live and work for longer but are not always happier. |
| Security | Citizens actively reject surveillance, creating a pushback against connected security solutions. The demand for static surveillance does not grow and mobile surveillance isn’t realised. | Convenient access to services is prioritised over data protection. Firms mine data uninterrupted. Surveillance monitoring is widespread. Cybercrime is high due to the volume of online traffic with relatively weak security. | Digital ‘cloaking’ is the privilege of the few, individuals and companies with the capital and required skills are shielded from cyberattacks – enjoying resilience and continuity over those without. | Trust in public services is high and there is general approval of tech-based security solutions. There is increased demand for military and surveillance drones as crime and prevention becomes asymmetric, with individuals increasingly targeted. |
| Transport | Transport and travel revert to traditional patterns. Commuter travel is back to near pre-pandemic levels. Digitally enabled ‘Mobility as a Service’ is unrealised due to a lack of demand. City centres are thriving but, operators lack enthusiasm to seek connected transport solutions, reducing efficiency and frustrating some commuters. | Desire to embrace connected transport creates demand for smart roads and connected vehicles. When this is not available, traffic volume issues briefly worsen. This contributes to most car trips under 5 miles being replaced by lower-data-demand micromobility vehicles (Figure 19). | White collar industries enjoy the convenience and cost savings of remote working environments whereas blue collar industries are reliant on transport networks. Wirelessly connected transport networks are only available in local authorities that can afford it. | Connected and Autonomous Vehicles start to realise benefits. With the technology proven, 2030 sees uptake of CAVs ramp up, and ridesharing enables efficient accessibility. Those who don’t yet have access to CAVs, fully embrace connected vehicles and micromobility. |
Considering distinct and stretching scenarios enables policymakers to ensure that strategy is resilient and less vulnerable to future shocks. An analysis of the differences between the Wireless 2030 scenarios was carried out to confirm that they were distinct from one another. Expert contributors were also asked to consider whether the Wireless 2030 scenarios were sufficiently distinct and stretching, and their feedback was implemented in the final scenarios. Figure 10 provides a visual demonstration of the key differences between each of the Wireless 2030 scenarios.

The content of this figure is provided in the table below in an accessible format.
Figure 10: Wireless 2030 scenario variation.
(Figure 10 - see full size image)
Visual demonstration of the distinctions between each of the Wireless 2030 scenarios. The table below provides a breakdown of the information provided in Figure 10 in an accessible format:
| Statement | Slow Progress | Unmet Promises | Us and Them | Seamless Citizen |
|---|---|---|---|---|
| Capacity of connectivity solutions | Low | Low | High | High |
| Universality of coverage across places | Low | Medium/High | Low/Medium | High |
| Universality of coverage across income groups | Low/Medium | Medium/High | Low | High |
| Private sector uptake of digital tech | Low | Low/Medium | Medium/High | High |
| Public sector uptake of digital tech | Low | Medium/High | Low/Medium | High |
| Positivity about connectivity situation for young | Low | Low | Medium/High | High |
| Positivity about connectivity situation for old | High | Medium/High | Low/Medium | Low |
| Average weekly screentime | Medium/High | High | Low/Medium | Low |
| Resilience to disruption of the digital system | Low/Medium | Medium/High | Low/Medium | Low |
Scenario rating (Low = 1; Low/Medium = 2; Medium/High = 3; High = 4)
Wireless use cases quantification
A ‘light touch’ Excel-based model was developed and applied to each of the public sector use cases set out in Chapter 2, Table 7. This was carried out by first estimating the demand on wireless infrastructure if each transition reached its maximum, plausible 2030 level. Then, a series of expert-informed judgements were made about how much the factors set out in each scenario would attenuate that transition by 2030 (see supplementary annexes for more detail on the methodology).
This has provided a rough estimate of scale demand in each scenario, as well as an insight into public service uptake, usage and data demands across the scenarios. It is not an assessment of service quality or total demand.
Figure 11 sets out the high-level results from our analysis. Some use cases, such as smart grids and patient monitoring, are likely to have low data demands per user or per transaction, so even in very high uptake scenarios these applications are unlikely to be constrained by wireless bandwidth. Conversely, use cases such as Virtual Reality (VR), remote medical procedures and Connected and Autonomous Vehicles (CAVs) are likely to have high data demands, so it is possible that uptake of these use cases could be constrained if wireless infrastructure coverage and bandwidth are insufficient.
It is important to note that our analysis is based on average daily demand and bandwidth across the UK so, in such constrained situations, it is plausible that high demand use cases could be adopted in the best-connected places, but not universally. In addition, ensuring that all parts of the UK are brought up to the current best available level of connectivity could be sufficient to enable widespread adoption of some of the lower demand use cases.
Quantification of these Wireless 2030 public service use cases has enabled a comparison of the scale of demand for a sub-set of use cases across the scenarios, rather than a comprehensive estimate of total demand. This approach was chosen to fit with the short duration and budget of this project, and to complement DCMS’ more comprehensive programme of analysis to provide total wireless demand forecasts. The Wireless 2030 quantitative metrics support DCMS’ analysis by:
- Exploring how public service demand for a small number of illustrative use cases varies across the scenarios. This allows for comparison of the scale of demand of each use case across the scenarios and has provided specific insights to enrich the scenario narratives.
- As more data becomes available, the model could potentially be updated by DCMS to build a more detailed picture of how demand for each use case compares across each scenario.
- In future, this analysis could be used with the DCMS infrastructure supply model to better understand the infrastructure required to meet this demand across the varying Wireless 2030 scenarios .
| Wireless Use Case Data Demands (Tbit/s) | Seamless Citizen | Slow Progress | Unmet promises | Us & Them |
|---|---|---|---|---|
| Cultural - VR gaming & Entertainment | 48 | 12 | 24 | 36 |
| Cultural - VR Social/Communications | 24 | 6 | 12 | 18 |
| Education - Screen based Remote Learning | 0.027 | 0.0079 | 0.015 | 0.015 |
| Education - VR Remote Learning | 13 | 3.9 | 7.2 | 7.2 |
| Environment - Rural Monitoring | 0.000011 | 0.0000028 | 0.0000057 | 0.0000057 |
| Environment - Urban Monitoring | 11 | 2.9 | 4.3 | 8.6 |
| Environment - Smart Grids | 0.038 | 0.0042 | 0.013 | 0.016 |
| Healthcare - Monitoring | 0.02 | 0.0073 | 0.0098 | 0.016 |
| Healthcare - Procedures | 5.1 | 0.51 | 1.1 | 2.3 |
| Security – Mobile Surveillance | 0.00015 | 0.00011 | 0.00013 | 0.00015 |
| Security - Static Surveillance | 0.76 | 0.13 | 0.13 | 0.76 |
| Transport - Connected Vehicles | 0.29 | 0.038 | 0.17 | 0.15 |
| Transport – Connected and Autonomous Vehicles | 41 | 0.25 | 5.6 | 13 |
| Transport - Connected Micromobility | 0.000058 | 0.0001 | 0.00012 | 0.00007 |
Figure 11: Variation in Wireless 2030 public sector use case data demands.
This illustrative analysis explores how public sector demand for selected use cases varies across the scenarios. It does not provide a comprehensive estimate of total demand.
4. Wireless 2030 scenarios
Four future worlds in which to frame public service delivery.
Four future worlds have been created to help policy makers test their proposals wireless infrastructure and identify implications for public services. For each scenario, a detailed narrative has been developed, along with other resources to help bring them to life for policy makers. In these slides, each scenario will be showcased using the following structure:
-
Rich Picture – an artist’s impression of the scenario, showcasing different aspects of life in that world.
-
At a glance & use case technology roadmap – a brief summary of the scenario, with a sidebar showcasing which technology use cases are widely used in that world, underpinned by the connectivity requirement and accessibility in the scenario.
-
Narrative & 2030 scenario features - provides a detailed description of the scenario; its consequences, benefits, winners and losers. A figure is included describing some underlying assumptions about how that world might look.
-
Key Insights – an illustrative summary of use case data demands; selected to help draw out the consequences of each scenario and demonstrate which public service areas are driving data demand (these are not a comprehensive forecast of demand). Post-it notes quote expert comments from Workshop 2 and provide an insight into public service delivery in each scenario. The side bar shows how public sector use case demands vary across the scenarios.
-
Personas – a snapshot of the possible lives of 3 different people in that world; these aim to further demonstrate the positive and negative consequences, and the winners and losers in each scenario.
Scenario A: Slow Progress
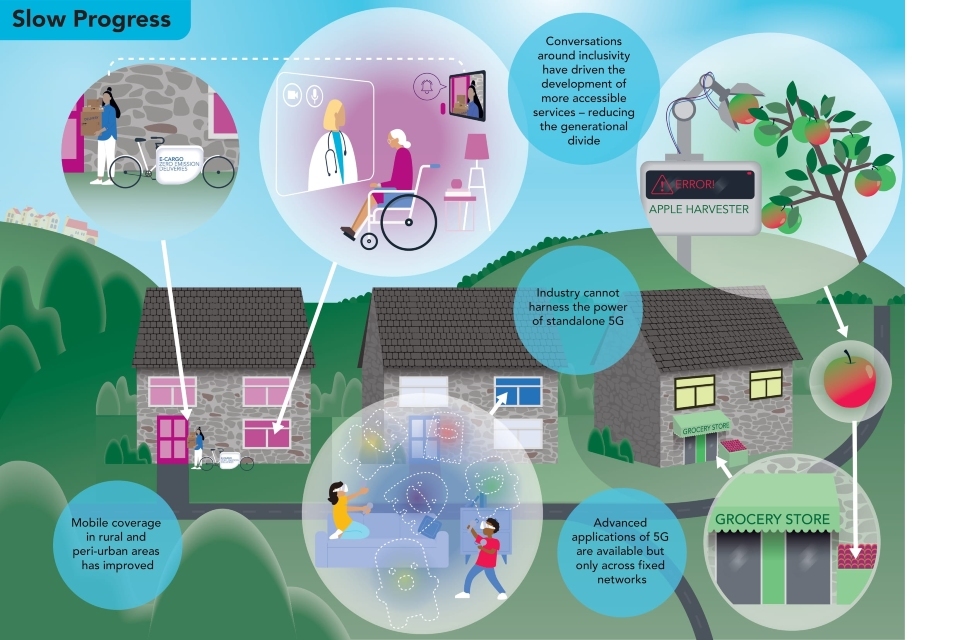
An artist’s impression of the Slow Progress scenario based on the description of this scenario in the main body of the text in the below section.
Figure 12: An artist’s impression of a Slow Progress world.

A roadmap shows that the following innovations are widely used and unlocked by the Slow Progress scenario: smart roads, screen-based remote learning, static surveillance and connected micromobility.
Figure 13: A summary of key innovations in the Slow Progress scenario.
(Figure 13 - see full size image)
Slow Progress 2030. At a glance:
- The pace of tech adoption has plateaued off on the back of the pandemic – not everyone embraces digital living in the same way.
- There is push-back against the ‘attention economy’ and companies are forced to meet demand in more conscientious and inclusive ways, considering accessibility, environmental impact and equality. Commercial strategies are driven more by outcome than the next shiny thing being marketed.
- Legacy networks are extended, particularly in rural areas, increasing digital skills. However, industry is unable to harness the power of advanced networks leading to frustration and a lack of productivity gains over other countries.
- Many opt out of digital living due to concerns over disinformation, leaving them unable to access public digital services such as telemedicine. At the extremes, some people vandalise wireless infrastructure.
Features of this world…
- Homes are hard to retrofit, and smart solutions still have basic functionality
- Work is sometimes remote and flexible, but with technical limitations – traditional work roles remain
- Commerce is more local: edge-of-town retail and high streets cling on
- Industry is suffering from patchy upgrades to legacy infrastructure. Productivity in the wider economy is low from missed automation opportunities
- Data is vulnerable, and often withheld
- International wireless environment is moving more quickly than the UK, but not racing ahead. Where services can be off-shored effectively they are, but this only results in slight quality improvements
- Investment is limited, into small and/or localised projects. Investments cannot create scale for a UK capability
- Telecoms infrastructure is dominated by maximising legacy network life, advance network roll out
- Network coverage is not much better overall than 2020, with some areas continuing to have poor connectivity
- Natural and built environments are protected and remain unconnected
Figure 14: A summary of the key features of the Slow Progress scenario.
Slow Progress 2030. Narrative:
The COVID-19 pandemic represented a compressed period of technological advancement and behavioural change; citizens, businesses and government adopted hybrid working, virtual socialising, and e-commerce as a necessity.
Looking back on those turbulent years, the lack of face-to-face contact and associated mental health issues have shown some citizens that the benefits of connectivity are not worth the lack of control and feeling of isolation. Growth in UK demand for technological innovation and network evolution has plateaued. There’s been a general push-back against social media companies and data-sharing, demonstrated by a mass-deletion of social media profiles in protest. Commercial strategies are now driven more by taking time to understand what outcomes people really want and less by the next shiny thing that is being marketed – resulting in more considered and inclusive conversations between companies and consumers.
This is proving frustrating for many industries, entrepreneurs and technophiles. Operators have been forced to maximise legacy network life, slowing advanced network rollout and resulting in patchy, unreliable networks and a reliance on ageing tech for critical systems. Advanced home and complex industrial internet of things (IoT) has not been fully realised. Businesses continue to suffer reduced productivity growth from missed automation and data driven decision-making opportunities. Even when innovative connectivity solutions do arise, it is hard to retrofit them into an ageing system and their full potential is seldom realised. Many digital UK public services are off shored to digital providers based in other countries; talent and investment diverts elsewhere, and reliance on foreign tech has increased.
In an effort to equalize access, mobile coverage in rural and peri-urban areas has improved a little. The small numbers of people who embrace digital living are able to develop new skills and harness the ability to access digital services such as telemedicine. However, disinformation is rife among those that shun digital living, resulting in vandalism of infrastructure and an unwillingness to use public digital services.

The content of this figure is provided in the table below in an accessible format.
Figure 15: Data demand key insights – Slow Progress scenario.
(Figure 15 - see full size image)
A summary of insights into data demands in the Slow Progress scenario, from a quantification analysis of Wireless 2030 public sector use cases. The table below provides a breakdown of the information provided in Figure 15 in an accessible format:
| Public sector | Total data demands from use cases per public sector (Tbit/s) | Sector-related quotes from stakeholders during workshop 2 | Use case | Data demand from use case (Tbit/s) |
|---|---|---|---|---|
| Cultural | 18 | Time has been taken to address problems which emerged in the late 2010s/early 2020s (i.e., impact on children, mental health, fraud, democracy) | VR gaming & entertainment | 12 |
| VR social/ communications | 6.0 | |||
| Education | 3.9 | Slow Progress enables a more standardised connectivity/ edtech approach; enables the left behind to catch up & leads to new relationships between art and academia | Screen-based remote learning | 0.0079 |
| VR-based remote learning | 3.9 | |||
| Environment | 2.9 | Opportunities to use connectivity/tech to increase sustainability have been missed, but as the advantages of new tech are intangible; people keep tech longer & there is less waste | Rural monitoring | 0.0000028 |
| Urban monitoring | 2.9 | |||
| Smart Grids | 0.0042 | |||
| Healthcare | 0.52 | Citizens are scared to let go of their data, so the demand side for health connectivity have not been realised. Technology could help many but doesn’t get a chance to | Healthcare monitoring | 0.0073 |
| Health procedures | 0.51 | |||
| Security | 0.13 | The inability to connect all critical infrastructure provides unexpected security gain - unconnected infrastructure more cyber resilient | Mobile surveillance | 0.00011 |
| Static surveillance | 0.13 | |||
| Transport | 0.29 | People travel more, as face-to-face interactions are still important. ‘Mobility as a Service’ never became a reality due to poor connectivity & solutions suffer from poor interoperability | Connected vehicles | 0.038 |
| Connected & autonomous vehicles | 0.25 | |||
| Connected micromobility | 0.00010 |
Slow Progress 2030. Personas:
Mary, 34, Wolverhampton
Mary checks her phone as she waits for the next tram into Birmingham. She is partially sighted, and her phone tells her which tram to catch. Once onboard, it will also tell her when to get off and which door to exit from. The tram and several tram stops on Mary’s route have been equipped with a transport accessibility solution to provide real-time information for those who need more help when travelling on the West Midland’s public transport network, enabling independent journeys for the visually impaired. The system works well but was first trialled nearly 10 years ago and has changed little in the intervening years. More advanced connectivity solutions for the blind and visually impaired, such as ‘telenavigation’ using 5G, have progressed slowly or not at all. Technologies such as 5G-connected smart glasses, which pair with smartphones and AI providing real-time audio feedback to help the blind navigate independently, are simply not available in the UK.
William, 18, Halifax
The school careers advisor suggests that he should apply to university. William isn’t sure. He’s keen to take advantage of virtual education platforms that seamlessly incorporate VR into learning and allow an individualised educational experience, but most UK institutions have reverted back to (safe/secure) face-to-face teaching. He might not have as much digital experience as his friends from last year’s school trip to Germany, but he’s worked hard to achieve qualifications in maths and computing and his ambition is to work in the digital gaming industry. He feels torn - he has a strong attachment to the UK but wonders whether he should abandon his principles and join the ‘brain drain’; a trend where the best teachers and students move abroad to countries where 5G networks enable the use of Edtech. At institutions in cities such as Singapore, Berlin and Boston Massachusetts, low latency wireless provision enables students to use VR technologies to learn technical skills from the best teachers around the world in a realistic environment. After all, he reasons, ‘I can always return to the UK when it’s caught up a bit more’.
Maureen, 68, rural Kent
Although a spritely 68-year-old, Maureen is starting to feel the twinges of age and is concerned about early signs of arthritis. She calls the GP on her 7-year-old mobile (the technology has hardly progressed, so what’s point of changing it if it still works?) and makes an appointment to see the doctor that afternoon. The NHS is still reliant on in-person care, but that’s OK, Maureen prefers the personal touch - particularly after the recent scandals around the data breaches allowed by the UK’s ageing infrastructure. Maureen starts thinking about her current situation; her cottage is on the edge of the village and public transport is patchy at best. Mobility-as-a-Service (MaaS) is a long way off and she worries about how she’ll get around and cope living on her own. In Sweden, her daughter-in-law monitors patients remotely via networks of connected IoT sensors in their homes. Maureen is conflicted; she doesn’t like the idea of sharing her health data, who knows what it might be used for, but she wants to maintain her independence. She wonders whether swapping the convenience of London for the rural idyll of ‘The Garden of England’ in her retirement was such a good idea, or even whether she’d be better off moving to Sweden.
Scenario B: Unmet Promises
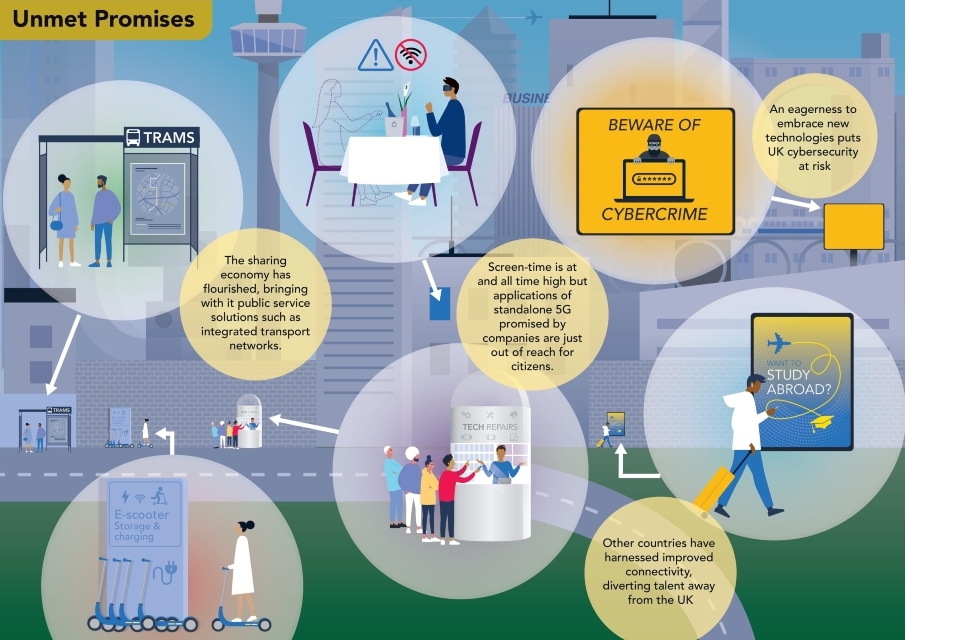
An artist’s impression of the Unmet Promises scenario based on the description of this scenario in the main body of the text below.
Figure 16: An artist’s impression of an impression of an Unmet Promises world.

A roadmap shows that in addition to innovations that are widely used in the Slow Progress scenario, the Unmet Promises scenario also unlocks: remote healthcare monitoring, connected vehicles, VR social/communications, VR gaming & entertainment.
Figure 17: A summary of key innovations in the Unmet Promises scenario.
(Figure 17 - see full size image)
Unmet Promises 2030. At a glance:
- 4G/5G extended mobile broadband connectivity has fuelled demand for advanced services and set expectations for access and delivery.
- In this epoch of ‘late 4G’, there’s an app for everything, screentime is at an all-time high
- Innovation and commercialisation challenges prevent the UK from unlocking advanced 5G/6G connectivity altogether.
- Some countries are speeding ahead in terms of connectivity, diverting talent and investment away from UK, and stifling UK technological evolution.
- Data sharing is widespread as users opt for convenience over data protection measures.
Features of this world…
- Homes are a bit smarter than today, connected to a central, basic ‘hub’
- Work is competitive, certain employers / locations are in high demand. For many, work/life balance needs remain unmet
- Commerce is still a mix of high street and online
- Industry is stuck with slow productivity growth and problems with accessing its labour needs
- Data is unprotected as users opt for convenience
- International wireless environment is outpacing the UK, with a few high-profile superstar states leading to UK envy. The UK is reliant on international suppliers, but access is limited due to security interoperability issues
- Investment is focused on near term returns; investors lack confidence in big promises - with overseas markets as winners
- Telecoms infrastructure is expanded but with a lack of advanced services - limiting consumers’ benefits
- Network coverage is improved, especially in previously unconnected areas, but the best connections are only slightly better than today
- Natural and built environments are scarred by iterative upgrades to infrastructure
Figure 18: A summary of the key features of the Unmet Promises scenario.
Unmet Promises 2030. Narrative:
The majority of the UK have accepted digital living as a right and seek to gain value from advanced connectivity and web services. However, innovation and commercialisation challenges mean the applications of standalone 5G infrastructure, promised by clever marketing, are just out of reach for UK citizens. With digital living universally embraced, the level of digital literacy rises in the wider population. Demand for late 4G/early 5G applications has driven improved coverage beyond cities, and improved digital skills across a range of age groups has reduced the generational divide. Data sharing is widespread as users opt for convenience over data protection measures. The technology to fight cybercrime has fallen behind that of attackers, so cybercrime is high and ‘dark web’ networks are able to circumvent regulation.
People desire digital services more than ever; they’ve seen what’s possible elsewhere in the world. But ‘5G’ is still more of a marketing term than an actual promise of revolutionised connection speed and quality. Even where coverage is good, networks often struggle to cope with data volume demands, creating problems at large events, where users struggle to access important mobile services such as online banking. Companies shout ‘the future is now’ … but jazzy wearables, connected vehicles and Smart home appliances are still pretty dumb. They talk to users, but not to service providers, and certainly not to each other.
UK students are disillusioned with the learning services on offer and the entrepreneurial ecosystem dries up. The UK job market has not adapted to a global demand for novel software development and engineering. Streaming media is at an all-time high but cannot recreate the experience of live arts. Personal monitoring devices are popular among citizens; health data tracking has, for some, become obsessive and digital living is beginning to take a mental toll. Tech adoption among industry grows but sectors cannot harness the power of advanced network infrastructure without going private. Private companies are using private networks to demonstrate that they can deliver public service better than public entities.

The content of this figure is provided in the table below in an accessible format.
Figure 19: Data demand key insights – Unmet Promises scenario.
(Figure 19 - see full size image)
A summary of insights into data demands in the Unmet Promises scenario, from a quantification analysis of Wireless 2030 public sector use cases. The table below provides a breakdown of the information provided in Figure 19 in an accessible format:
| Public sector | Total data demands from use cases per public sector (Tbit/s) | Sector-related quotes from stakeholders during workshop 2 | Use case | Data demand from use case (Tbit/s) |
|---|---|---|---|---|
| Cultural | 36 | Post-COVID, the arts & culture/events sector is still grappling with economic challenges… can’t recreate the feel of events via streaming | VR gaming & entertainment | 24 |
| VR social/ communications | 12 | |||
| Education | 7.2 | Emerging differences between educational institutions dependent on their digital maturity. Early adopters see increasingly high attainment/success | Screen-based remote learning | 0.015 |
| VR-based remote learning | 7.2 | |||
| Environment | 4.3 | An inability to find ‘green’ digital solutions has hampered progress. Smart grids have not kept up with user demands; the excess utility capacity required is unavailable | Rural monitoring | 0.0000057 |
| Urban monitoring | 4.3 | |||
| Smart Grids | 0.013 | |||
| Healthcare | 1.2 | The benefits of holistic, & proactive healthcare are seen, but only in certain areas, so people are nervous to rely upon new age services & retain allegiances to local physical clinics | Healthcare monitoring | 0.0098 |
| Health procedures | 1.1 | |||
| Security | 0.13 | Promised security not available and requiring breaks in connectivity to secure Critical National Infrastructure as attack vectors have outpaced security | Mobile surveillance | 0.00013 |
| Static surveillance | 0.13 | |||
| Transport | 5.8 | Lack of connected services and systems leads to congestion and inefficiencies | Connected vehicles | 0.17 |
| Connected & autonomous vehicles | 5.6 | |||
| Connected micromobility | 0.00012 |
Unmet Promises 2030. Personas:
Stephen, 48, Geneva
Stephen removes his XR headset and picks up his iPhone to facetime his wife. He works 5 days a week in Geneva as a security software engineer for Deutsche Bank. The company asked him to relocate to Switzerland 5 years ago as the security and capacity of his connection stopped him from carrying out his job effectively in the UK. It was decided that his wife, Orla, and their son Jake (who, at the time was 10) would stay behind so Jake could finish his studies. More recently, Jake and his mum flew over to Geneva for a visit and Jake made a friend who has a game design studio at his school. Jake is video-game obsessed but there’s nothing like that at his school. Orla passes her phone to Jake who, as usual, complains about how boring he finds school. Halfway through explaining that he wishes he could come and live in Geneva, Jake freezes and Stephen has to wait a few minutes before he can call back. Stephen wonders if leaving his family behind was such a good idea after all.
Anita, 35, Manchester
Anita’s just heard from the practice manager that 80% of the patients at the GP practice where she works have signed up for UBHealth – the latest digitised health monitoring system. She is worried about Natalie who’s been contacting the practice a lot lately. It looks like she’s been monitoring her stats obsessively with her app and Anita is concerned she might be developing orthorexia or hypochondria. It happens, all this data in real time can mean people spend their lives checking their heart rate, blood pressure, blood sugar, oxygen levels, etc. instead of enjoying themselves. Anita has had to refer more and more patients to local support groups and prescribe medications for health anxieties. ‘It’s a tough call whether the app is a help or a hindrance – while users are able to see the benefits of an improved lifestyle, it doesn’t seem to be helping people feel good about themselves’ Anita says to her practice manager who’s too busy checking his phone to offer a reply.
Marie, 86, Hampshire
Marie lives in an apartment in Barton on Sea. Six years ago, fibre optic broadband was installed so her whole building could get faster connectivity. Marie was dubious at first. Unfortunately, in the early 2020s she was inundated with spam calls to her landline and learnt to be wary of upgrade offers after sending money to a fake internet provider. But Johnny from the floor above really brought her round having worked in cybersecurity since the 00’s. Johnny told her about ‘AnyLearn’, an initiative to help adults upskill with online classes – this really changed things for Marie and her friends in the building. They are now able to use apps to monitor their health, book appointments, connect with family, order groceries and use connected transport. In addition, Marie feels more comfortable living alone as she is able to monitor her apartment’s security via a smart doorbell.
Scenario C: Us & Them
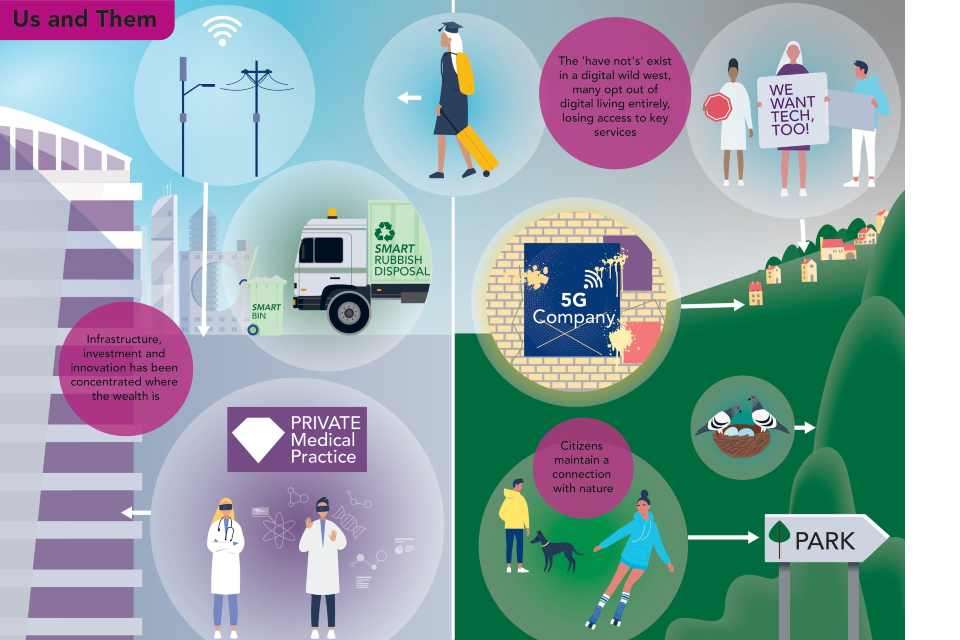
An artist’s impression of the Us & Them scenario based on the description of this scenario in the main body of the text below.
Figure 20: An artist’s impression of an Us & Them world.

Roadmap indicates the Us & Them scenario unlocks the innovations widely used in the Slow Progress & Unmet Promises scenarios, and: mobile surveillance, smart grids, urban environmental monitoring & some VR remote learning & remote healthcare procedures.
Figure 21: A summary of key innovations in the Us & Them scenario.
(Figure 21 - see full size image)
Us & Them 2030. At a glance:
- Infrastructure investment and innovation has been concentrated where the wealth is.
- Private players set the agenda and great ideas have been exported to high bidders.
- UK data speeds have improved, more so in urban areas than everywhere else.
- But secure and high-quality connectivity is the privilege of those who can afford it - and have the required digital skills.
- Everyone else in the UK exists in a digital ‘wild west’, some attempt to import black market tech… many opt out, losing access to key services in the process.
Features of this world…
- Homes are variable – not all ‘smart’ homes are interoperable, efficient, secure
- Work is anywhere with a reliable connection, often done by non-humans. Hard to access for many. Not all workers benefit
- Commerce is experiential and hyper-convenient at the high end
- Industry is accelerating productivity in connected hotspots/sectors
- Data is secure / managed, for those who can afford it
- International wireless environment is flourishing where there is wealth and investment. Ideas flow between states, alongside capital. And in these cases, networks are scaled
- Investment is concentrated where the people are & where the money is
- Telecoms infrastructure is inequitable. Advanced networks built for the few, with some spill over benefits for others but with lower Quality of Service
- Network coverage is improved but inequitable and is no guarantee for quality of service
- Natural and built environments are polarised; some are upgraded to adapt to user needs and new forms of service delivery
Figure 22: A summary of the key features of the Us & Them scenario.
Us & Them 2030. Narrative:
What tech commentators describe as the ‘Covid Catalyst’ brought about rapidly accelerated behavioural and technological change in the UK, but only in pockets. Sophisticated sensing networks and countless private small cells have been installed in areas of high population and connected entity density. The most advanced technologies can be seen in software development and entertainment companies, large scale manufacturing sites, high-end residential and private vehicles/vessels. From their increasingly smart, responsive and even moving spaces, urbanites who can afford ubiquitous connectivity enjoy streaming, gaming, catching up with loved ones’ avatars or simply talking their voice assistants through their to-do lists. Businesses with open-minded, deep-pocketed shareholders profit from greatly enhanced operations and productivity. UK innovators are having a field day; the Global Ideas Exchange (GIE) is just getting off the ground, which will attract more investment and see more UK citizens making their mark and their money in other countries.
The public/private rural/urban divides widen – urban dwellers that can afford private services win whereas rural dwellers that access less advanced public services loose. Those with ‘connection-privilege’ hire unconnected cars to holiday in the countryside; it’s too dangerous to use CAVs ‘off-smart -roading’. In smart cities there is good access to connected public services (for example, smart waste management, smart law enforcement, smart traffic management) as well as commercial services, such as same hour drone deliveries. Meanwhile, rural dwellers struggle to access efficient services and have to wait for delivery drivers; next day delivery is the best they can hope for.
Privileged children in connected urban areas are exposed to smart spaces and gain a digital skills edge on their peers. If those without this experience are lucky, they’ll land in businesses and trades that will re-train them and get lassoed into the Metaverse as e-artisans. At worst they will lack the connectivity to access those spaces in the first place. They’ll join the older and rural population who can’t engage as digital citizens and are locked out of essential service provision by the international tech giants. In urban areas, a few people try to steal ID to get some level of service, fewer still attempt to hack systems or physically damage cables, masts and cells. Rural residents who don’t see the benefits of new forms of connectivity won’t allow enhanced physical infrastructure anywhere near their land. The ‘digital withdrawal’ movement gathers pace in some rural areas.

The content of this figure is provided in the table below in an accessible format.
Figure 23: Data demand key insights – Us & Them scenario.
(Figure 23 - see full size image)
A summary of insights into data demands in the Us & Them scenario, from a quantification analysis of Wireless 2030 public sector use cases.
Us & Them 2030. Personas:
Margot, 41, East London
The concierge desk of the apartment block illuminates with a notification as she passes. She reads the desktop surface: “Good evening Margot, auto-renewal of OurCloud in 14 hours. OK? See tenancy terms?”. Margot’s downstairs neighbour had been complaining about the service charges for the ‘brain’ of their building, but for all its cheesy phrases and relentless updates it had saved her bacon more than a few times. Just yesterday it picked up a theft of her e-ID (peddling identities in the SubVerse has become quite common, apparently). Since the E1 street furniture pilot in certain postcodes, OurCloud metaconferencing kit can be used in AV transit – there is no way she is giving up that time-saving perk. Her hand hovers over ‘OK?’ and she feels the affirmative double buzz in her wrist.
Keith, 66, Salford
His wife’s right – it is a very snazzy box. And quite big for the tiny piece of kit it contains. Keith’s 5G hearing aid was a (bank-breaking) Christmas present to himself and does some clever audio processing to make conversation clearer, even in busy restaurants or his noisy warehouse. It sends regular ECGs to his doctor too, so he doesn’t need to wear that fussy watch anymore. He would have forked out for one for George, his brother-in-law, if the thing had worked up in Kendal - but it’s about as useful there as a normal unconnected hearing aid. Plus, George reckons these gizmos steal all our bank account details. Bizarrely, the same folks who made the hearing aid are selling ‘factory digital twins’ to Manchester-based companies – Keith’s been promised an upgrade which will help to automate production and optimise energy, but he’s wary; he doubts anyone in his business knows how to fix a ‘twin’, and software and robots won’t throw him a good retirement party…
Nadia, 16, Hereford
The cloud competency exam is the final hurdle. Ace this and she’ll be off – London, Palo Alto, Singapore, Taipei… wherever the company wants to send its apprentices… maybe they’d pay for her family to visit physically? Or at least for the occasional holograph? Nadia snaps back from her daydream to the task in hand, skipping through ads until the video instructor is back. “Once glasses are secured, candidate must align vision field with edges of tablet”, says the instructor. Nadia knows lots of the people she’s up against will be used to SmartClassrooms; her state school out in the sticks can’t have them. In fact, she’s only worn AR engineering kit once before, and people in the canteen laughed uncontrollably at the photo. They won’t be laughing when they can’t afford the things she creates and are stuck driving their dumb cars to their kids’ disconnected classrooms… maybe they’ll be the ones heading off to the highlands to join the digital withdrawal movement.
Scenario D: Seamless Citizen
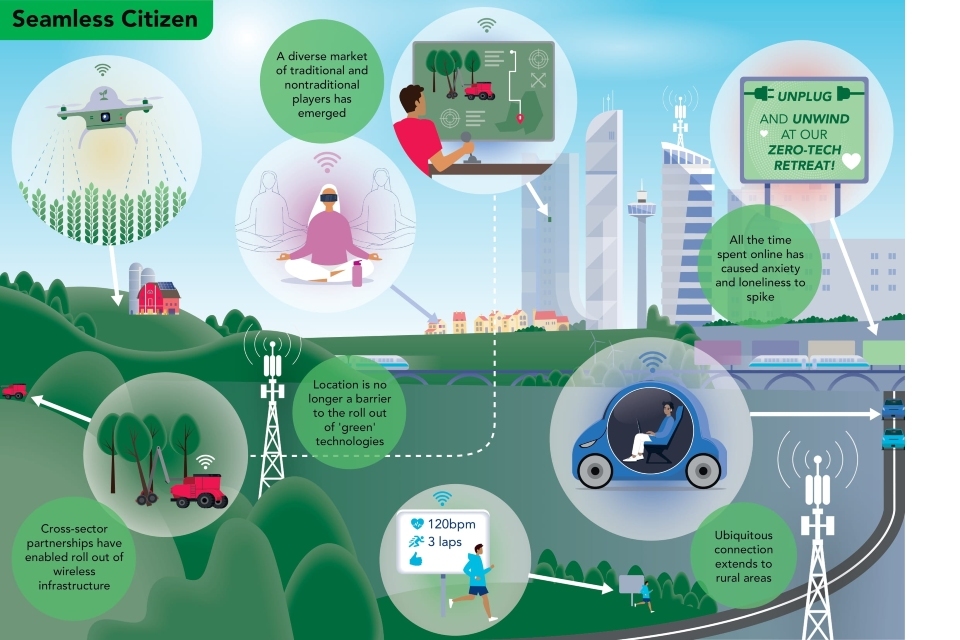
An artist’s impression of the Us & Them scenario based on the description of this scenario in the main body of the text below.
Figure 24: An artist’s impression of a Seamless Citizen world.

Roadmap indicates Seamless Citizen scenario unlocks the innovations widely used in the Slow Progress & Unmet Promises scenarios, & unlocks: VR remote learning, remote healthcare procedures, rural environmental monitoring & connected & autonomous vehicles.
Figure 25: A summary of key innovations in the Seamless Citizen scenario
(Figure 25 - see full size image)
Seamless Citizen 2030. At a glance:
- Citizens and industry embrace full digitalisation; new business models and services that facilitate work and life across the country.
- A vibrant ecosystem of non-traditional innovative solutions are established.
- UK achieves global scale through creation of its own national 5G/6G deployment.
- Screen intermediaries (phones, laptops etc) are evolving and even disappearing in favour of less invasive, more responsive objects, surfaces and spaces.
- This new quality and ubiquity of connectivity is demanding in terms of energy, personal data and people’s mental health…
Features of this world…
- Homes are connected inside and out, responsive, sharing info within community ‘ledgers’
- Work is remote, hybrid and flexible. Many new options on how, where and what work involves including some automation
- Commerce is anywhere/everywhere – but rarely physical
- Industry is achieving productivity gains through automation & asset optimisation, coupled with a highly skilled workforce
- Data is the most important store of value for individuals and organisations
- International wireless environment is open and fast-paced. The UK creates national capability and can comfortably compete internationally, outperforming many states
- Investment is well / widely distributed across the value chain, creating a national UK capability
- Telecoms infrastructure is advanced, public and private mobile networks compete for consumers and services
- Network coverage is ubiquitous – citizens can move between locations/environments & remain connected constantly
- Natural and built environments are responsive to people and conditions. Monitored in real time and carefully managed
Figure 26: A summary of the key features of the Seamless Citizen scenario
Seamless Citizen 2030. Narrative:
After years of struggling to realise a safe and equitable digital economy, the pioneers of the new Digital ID and Digital Welfare framework have made themselves heard. The framework aligns public and private players around the idea of connectivity as an essential utility. New cross-sector partnerships have enabled the rollout of wireless infrastructure and improved service delivery across the country.
Neither geography nor digital literacy constrain the movement of people and capital. A diverse market has emerged, which prioritises user-centric design of shared and private spaces, surfaces and systems. Data is a valuable resource; companies such as ‘Gener8’ have enabled users to take ownership of the monetisation of their own data and the trade in personal data is booming.
The switch to digital currency has accelerated in recent years; early investors have seen big returns on their capital. Being part of a cashless society has become the norm, although the physical disconnect has caused some societal issues, relating to personal management of finances, particularly in younger generations. Industry is being revolutionised by newly autonomous and remote solutions and the advancing UK tech scene has attracted serious talent and investment.
AI has enabled new and retained health data to be seamlessly collated, modernising the UK care system. Mobile 5G hubs ensure that emergency service responders have constant communication with control centres and patients in rural areas can be easily monitored.
The augmented workforce is facing some challenges, however. Many citizens attempt to upskill and reskill, but competition is tough and the type of remote work available is already causing anxiety and loneliness to spike. National health surveillance initiatives are particularly targeting the generation who spend more time socialising, gaming and trading amongst avatars than amongst ‘real’ people. The ever-increasing number of IoT connections has exposed UK public services to cyberattacks, requiring robust cybersecurity solutions to protect citizens.
Ubiquitous connectivity has given rise to re-imagined democratic systems which have been adopted by local communities to bring agency and ownership back to their constituents. This kind of connected living isn’t for everyone; all sorts of centralised programmes are seeing pockets of backlash and ‘opt out’, whether it’s the personal carbon points scheme, endorphin targets or robo FinHealth advice. Digital services can’t overload those who aren’t online…

The content of this figure is provided in the table below in an accessible format.
Figure 27: Data demand key insights – Seamless Citizen scenario
(Figure 27 - see full size image)
A summary of insights into data demands in the Seamless Citizen scenario, from a quantification analysis of Wireless 2030 public sector use cases. The table below provides a breakdown of the information provided in Figure 27 in an accessible format:
| Public sector | Total data demands from use cases per public sector (Tbit/s) | Sector-related quotes from stakeholders during workshop 2 | Use case | Data demand from use case (Tbit/s) |
|---|---|---|---|---|
| Cultural | 72 | More opportunity to experience/immerse in other cultures (virtual travel) and/or cultural events that would otherwise be cost/location prohibitive (music, art, education) | VR gaming & entertainment | 48 |
| VR social/ communications | 24 | |||
| Education | 13 | Everyone has access to well-designed, adaptive education through-out their life. Hybrid solutions are the norm – individually optimising hybrid & in person learning | Screen-based remote learning | 0.027 |
| VR-based remote learning | 13 | |||
| Environment | 12 | Natural environments are monitored in real time by remote sensors and drones - Smart pricing of energy; devices choose when to switch on to balance demand and supply | Rural monitoring | 0.000011 |
| Urban monitoring | 11 | |||
| Smart Grids | 0.038 | |||
| Healthcare | 5.1 | Healthcare is revolutionised by real time monitoring and AI on multiple levels (diagnostics, treatment, access) to the benefit of wellness | Healthcare monitoring | 0.020 |
| Health procedures | 5.1 | |||
| Security | 0.76 | Cyber capability and excellence in information management is strategic and tactically decisive | Mobile surveillance | 0.00015 |
| Static surveillance | 0.76 | |||
| Transport | 41 | Autonomous vehicles decarbonise the transport sector and reduce the need for personal ownership; a revolution in ‘pay by journey’ occurs | Connected vehicles | 0.29 |
| Connected & autonomous vehicles | 41 | |||
| Connected micromobility | 0.000058 |
Seamless Citizen 2030. Personas:
Jack, 27, Lincoln
Completing the biometric security checks, he is logged in to the RAF Akrotiri system and begins the day’s work, studying the latest SWARM surveillance data. Noticing that his colleague Lisa has arrived at work on his live feed from the hanger, he jokingly comments “and what time do you call this?”, she glares over at his display screen, “Well I can’t just roll out of bed straight into work like you!”. Jack grins “No, but you do get to enjoy the Cyprus sun!”. Later, Jack’s partner asks whether any of his seniors have commented on his health sensor data from the past week – distracted by social engagements, he’d ignored his watch’s reminders to complete his daily fitness regime and is worried his bosses have noticed his lack of discipline in the weekly personnel health and fitness report.
Sennen, 19, Newport
Perching cross-legged on the end of her bed, Sennen pops her VR headset on and is automatically taken to the university’s collaboration realm in the Metaverse, the noise cancellation immediately drowning out the sound of her siblings across the room. She navigates herself to the mountain range workspace where her Mech-Eng project group have agreed to meet. When everyone is assembled, they begin a lively debate about how to best approach this week’s task; designing a new wind turbine which can generate enough energy to power a small village. They agree to use a digital twin to design and test their turbine and once created, they install their turbine on their mountain and attach it to a village of 200 houses to see if it works. Towards the end of the meeting, some of her classmates who live in halls suggest celebrating at the pub and she sighs; she wished she could have moved away to university, but it would not have improved the course quality and in-person socialisation is no justification for the additional costs. Later, she logs into the ‘Gaining an edge’ weekly workshop run by the Student’s Union, today’s theme is small talk…
Rebecca, 82, Dartmoor
Stepping through the front door, she hears the distinctive chime of her home ecosystem waking up; “Welcome back Rebecca, Rob’s family have set off from their home. Based on their momentum data and current traffic monitoring, I expect them to arrive at approximately 2:17 PM. There is nothing further scheduled in your calendar today. Is there anything else I can help you with?”. She replies, “Thank you, please turn the kettle on” as she heads over to the kitchen cupboard. She wasn’t sure about letting AI into her home but asking it to do things for her has certainly been a lot easier than trying to use the interactive surface her son Rob bought her a few Christmases ago. The water bubbles and she imagines Rob and the kids in their funny VR headsets; they wanted Rebecca to get one so they could go to the Metabeach together, but she’d so much rather give them a real squeeze. A buzzing on her wrist disturbs her thoughts and she hears “Resting heart rate, 64. Now is the best time to take your Enalapril tablets”. The HealthPro8000 on the counter has already dispensed the tablets and poured the water.
5. Scenarios and strategy
How the Wireless 2030 Scenarios can inform strategy and policy.
Using the scenarios, the GO-Science project team has worked with DCMS to identify a series of key issues to consider in the development of both supply-side (wireless infrastructure) and demand side (wireless services) strategy and policy:
- Public support and service provider engagement are just as vital to shaping future demand as providing infrastructure. Both are key to avoiding a future in which infrastructure is not fully utilised and the potential benefits from public service transformation are missed. Policymakers should consider measures to stimulate demand for connectivity in the public sector, in addition to encouraging the market for infrastructure supply.
- There are risks to a high-innovation, high-adoption world. Our scenarios highlight that an ‘always-on’ digitally connected culture could have ramifications for online safety and population health and wellbeing. Managing network and digital service resilience in such a connected world could also be a challenge. Missing the mark will undermine public trust. If this is the future policymakers find most attractive, action should be taken to manage these risks.
- Some public use cases would be held back more by a lower wireless infrastructure ambition than others. Some public use cases demand much higher bandwidth than others, for example remote patient monitoring and autonomous vehicles. It follows that lower coverage ambitions could hinder these use cases most. There is risk that underestimating demand could inhibit progress, with infrastructure the key limiting factor relative to other barriers.
- Levers that balance supply and demand are likely to be a useful addition to the wireless policy toolkit. The scenarios highlight the risks of supply and demand for wireless connectivity being out of balance, and the benefits of getting this balance right. These scenarios can be used by DCMS and other government departments to explore the supply-side policy levers (infrastructure) and the demand-side policy levers (digital public services) that could be used in different circumstances to mitigate risk and maximise benefit.
Next steps
These findings can be built on by DCMS and other governmental departments, exploring the scenarios and using them to stress test strategy and policy.
Wireless Infrastructure Strategy:
- This study is intended to be used to inform DCMS’s forthcoming Wireless Infrastructure Strategy.
- A workshop for DCMS policymakers was held to help identify implications for the Wireless Infrastructure Strategy and to stress-test aspects of it using the 4 scenarios, in conjunction with techniques including ‘Backcasting’ and ‘Wind tunnelling’.
Other government departments:
- These scenarios could also be used by other departments working on wireless enabled public services. They provide contextual backdrops to explore and assess strategic implications of differing levels of wireless connectivity for their own for priorities and policies.
- For example, they could inform development of strategies that help the public sector make the most of future wireless infrastructure in service delivery.
- They could also support work to stress-test new policy proposals – how well do they work in the different futures described?
Below are some examples of exercises that can be used for this purpose, with step-by-step summary guides on how to implement them.
For further information on on these and other futures methodologies can be found in the Futures Toolkit: tools for futures thinking and Foresight across UK government or contact foresight@go-science.gov.uk.
How to use the scenarios
The following are 3 suggestions to using the scenarios to help develop and test policies and strategies, with more detail on how to implement these techniques provided below (Figure 28).
| Method | Step 1 | Step 2 | Step 3 |
|---|---|---|---|
| Backcasting: Working back from an aspirational future to learn about the pathway(s) to achieving it | Starting with ambition Statements (drawn from scenario planning), e.g.:; In 2030, we will be…x; We want to have…x; Organisations will…x; People will…x | Broken down into aspects of delivery, e.g. if we aspire to X in 2030, what does that look like for:; Public dialogue and comms; Existing or new policies; Resources or investment ; Etc… | And for each aspect of delivery, what would we have to achieve…:; …by 2028?; …by 2025?; …by next year?; In the next 6 months? |
| Wind Tunnelling: Stress-testing policies and strategies against a range of future conditions | Starting with an existing proposal, plan or belief – which could be:; A stated / strategic objective; A policy (in development or post-launch); An existing strategy; An assumption being made about the future | And applying a ‘Pre Mortem’; Does this [proposal/policy/plan] succeed or fail in X future scenario? Why?; Does this [assumption/belief] remain true and relevant?; What must we start, stop, adapt or accelerate to mitigate our risk of failure across a range of future scenarios? | |
| Disruptors: Building resilience to low likelihood / high impact events and phenomena | Starting with a set of scenarios, applying 3 kinds of disruptor, or ‘shock’ to each. What happens in X scenario if:; A policy we expect to work, doesn’t?; Trends we expect to continue, don’t?; Things we don’t expect to happen, do? | Considering:; How does this stretch our sense of what’s possible?; Does our strategy take into account these possibilities and vulnerabilities? |
Figure 28: Three ways to apply the Wireless 2030 scenarios to strategy development
Each exercise is highly customisable and can be applied at the beginning, middle or end of strategy or policy development.
1. Backcasting (informing policy in development)
- A method for determining the steps that need to be taken to reach a specific future state or to deliver a preferred future. This is an effective way of connecting a given future to the present and identifying what needs to be done, or what would need to happen, to realise it. It could be used to develop a plan towards a preferred future. Or to explore how an unfavourable future might come about.
-
Used to:
- identify what needs to change between the present and a given future.
- determine and address key internal and external factors that might affect the timing and scale of change.
- break out of thinking constrained by how today feels.
- Output: a shared view of a preferred future and the steps required to deliver it.
- Outcome: it could be a plan to achieve a positive future with prioritised steps, or a set of warning signs on the way to a future we’d like to avoid.
- Approach: workshop discussion that builds on the scenarios
Step 1: Introduce the preferred future. If this is contested, work through the scenarios and agree the ideal elements of the best future.
Step 2: Starting from the future and working backwards to the present identify the key differences between the preferred future and the present
Step 3: Build a timeline that moves backwards from the preferred future to the present reality, setting out the key changes between the 2 points in time.
Step 4: Identify which changes are in your control and which aren’t.
Step 5: Identify what you need to do to deliver the steps that are in your control .
Step 6: Identify how you can influence or facilitate the steps that are outside your control .
Tip: starting from the future and working backwards (rather than starting from today and working towards a specific future) helps get over the human bias for assuming today is permanent.
2. Policy stress-testing or wind tunnelling
-
A method for testing policy, strategy or project objectives against a set of scenarios to see how well they stand up to a range of external conditions.
-
Used to:
- explore how different scenarios might affect strategic objectives
- identify which objectives are robust across the full range of scenarios and which will need to be modified if conditions change in the future.
-
Output: Feedback on how a new or existing policy, strategy or project might be affected in different scenarios and how it might need to be modified to ensure resilience across a range of future conditions.
-
Outcome: A more resilient policy, strategy or project.
-
Approach
- Work through the grid below (Table 9), discussing how your policy fares in the longer-term, under the different conditions of each scenario.
- Take a step back to look across the full grid: What is imperative for us to do in the near-term? What do we need to adapt or track to ensure the effectiveness of this policy across a range of possible futures?
Table 9: Example policy stress-testing exercise
| Policy proposal (That we do xxx to achieve YYY) | Scenario 1 | Scenario 2 | Scenario 3 | Scenario 4 |
|---|---|---|---|---|
| What aspects of this scenario make delivering this policy easier or more difficult? (Think in terms of enablers and barriers) | ||||
| In 2030, is this policy intervention considered a success or a failure? Why? (What might a success narrative look like?) | ||||
| Who benefits from this intervention in this scenario? Who doesn’t? Who or what is adversely affected? | ||||
| What would we need to start, stop, change or continue doing now/in the near term for this policy to achieve its objective in this scenario? |
3. Considering shocks
Even using rigorous assumption or uncertainty analysis and scenario development, we are still susceptible to disruptors and shocks. Our organisational and personal biases often prevent us from considering lower likelihood, yet high impact phenomena that can destabilise our context, or accelerate our trajectory towards a given scenario. These events or changes are considered ‘shocks’ to us and to our systems –and manifest in 3 ways (Table 10):
Table 10: Types of shocks
| Type 1 shock | Type II shock | Type III shock |
|---|---|---|
|
‘Policies we expect to work, but what if they do not?’ For example: We expect high levels of security to be maintained for wireless communications, but what if security is compromised? |
‘Things we expect to continue, but what if they do not?’ For example: We expect governments to continue to be the primary provider of public services, but what happens if they no longer are? We expect that people will continue to trust wireless communications, but what if they don’t and there is a mass withdrawal public consent? |
‘Things we don’t expect to happen, but what if they do?’ For example: We don’t expect a significant natural hazard or climate event to significantly disrupt wireless communications by 2030, but what if it happens? We don’t expect any countries to turn away from the pursuit of economic growth, but what if they do? |
These examples are a starting point for individual policy teams to consider what the possible shocks might be in their particular policy area (further examples of disruptors and shocks can be found in the annex).
We can use scenarios to explore the drivers and impacts of ‘shocks’, to better anticipate and plan HMG responses. You can ask:
-
If this shock were to happen between now and 2030, would it make each scenario more or less likely? How would it change the conditions within each scenario?
-
What is our (HMG) capacity to respond to a shock in any given scenario? What would we need to start, stop, adapt or continue doing to improve our resilience?
6. Report appendix
Acknowledgements
The Government Office for Science would like to thank the many officials, experts and industry stakeholders who contribute to this project by providing expert advice and constructive reviews of drafts.
The project team at the Government Office for Science was led by Jack Snape and Martin Glasspool and included Charlie Warwick, Melanie Carlin, Jessica Bodé, Seanique Reuben, Kharug Cheema and Felix Langley.
The project was overseen by a steering group of experts from across government:
- Professor Tom Rodden, Chief Scientific Adviser for the Department for Digital, Culture, Media and Sport
- Dr Mike Short, Chief Scientific Adviser for the Department for International Trade
- Peter Haigh, Technical Director for Telecommunications at the National Cyber Security Centre
- Ian McCormack, Deputy Director for National Resilience & Strategy at the National Cyber Security Centre
- Dr Ian Levy, Technical Director of the National Cyber Security Centre
- Holly Creek, Deputy Director for Wireless Infrastructure, Spectrum and Consumers at the Department for Digital, Culture, Media and Sport
- Dr Tom Wells , Deputy Director for Futures, Emerging Technology & Strategic Projects at the Government Office for Science
Siôn Cave and Dave Exelby from Decision Analysis Services Ltd worked in partnership with the project team and provided specialist futures and data analytics support. The team would like to thank Design102 for providing artists impressions of the Wireless 2030 scenarios.
We are also grateful for the valuable time and input from:
- Professor Paul Monks, Department for Business, Energy and Industrial Strategy
- Vint Cerf, Google
- Walter Greenleaf, Stanford University
- Simone Boekelaar, Innovate UK
- Lesley Holt, West Midlands 5G
- Professor Alan Penn, Department for Levelling Up, Housing and Communities
- Jonathan Parkes, NHS Digital
- David Wilson, NHSx
- Stephen Benzies, Department for Transport
- Philip Procter, Highways England
- Kieran Arnold, Satellite Applications Catapult
- Nina Percival, Ofcom
- Nick Evans, Ofcom
- Sundeep Bhandari, National Physical Laboratory
- Supt Jim O’Ryan, Police Emergency Network
- Phil Saw, Infrastructure and Projects Authority
- Claire Mohacek, Department for Digital, Culture, Media and Sport
- James Haward, Defence Science and Technology Laboratory
- Michael Brunton-Spall, Cabinet Office
- Paul Hosmer, Ministry of Defence
- Jonathan Spencer, Ministry of Defence
- Tony Riggs, Department for Environment, Food and Rural Affairs
- Mike Pittman, Department for Transport
- Jonathan Mitchener, Innovate UK
- Col Joachim Isacsson, Ministry of Defence
- Arthur Sturridge, Cabinet Office
- Matthew Iji, GSMA
- Gareth Elliott, Mobile UK
- Robert Driver, UK5G
- Sophie James, techUK
- Katryna Dow, Meeco
- Simon Staffell, Microsoft
- Francis Mckinney, Zenzic
- Professor Dimitra Simeonidou, University of Bristol
- Professor Stephen Temple, University of Surrey
- Regius Professor Rahim Tafazolli, University of Surrey
- Professor Muffy Calder, University of Glasgow
- Professor Simon Cotton, Queens University Belfast
- Philip Tovey, Department for Environment, Food and Rural Affairs
- Paul McKean, Jisc
- Stuart Dick, Department for Transport
- Michael Talbot, Centre for Connected and Autonomous Vehicles
- Imogen Pierce, Arrival
- Gem Barton, Office of Speculative Spatial Design / Royal College of Art
- Dave Birch, 15Mb
- Jessica Rushworth, Digital Catapult
- Paul Morris, Vodafone
- Richard Wainer, BT/EE
- Christopher Jones, BT/EE
- Paul James, Virgin Media/O2
- Jacob Deppe, Harbr Data
- Andrew Clark, Royal Academy of Engineering
- John Cully, Royal Academy of Engineering
- Nina Rahmatallah, WPP
- Tom Oscroft, Department for Transport, Ports and Borders
- Gary Crockford, Department for Transport
- Jon Kirkpatrick, Connected Places Catapult
- Freyja Lockwood, West of England Combined Authority
- Andy Smith, HMRC
- Alex Waters, Department for Education
- Robert Rodney, Department for Education
- Tim Morris, UK Major Ports Group
- Richard Cadman, Decision Analysis Services Ltd Subject Matter Expert
- Stephen Unger, Subject Matter Expert
- Richard Ballantyne, British Ports Association
- Ian Dabson, Infrastructure and Projects Authority
- Harald Haas, University of Strathclyde
- Matt Honeyman, Accurx
- Ann Williams, Liverpool City Council
- Andy Fisher, National Highways
- Andrew Smith, National Physical Laboratory
References
AlShahrani, A. A. &. M., 2019. Building Consumer Trust to Improve Internet of Things (IoT) Technology Adoption. Advances in Intelligent Systems and Computing, Volume 775.
Ball, J., 2021. Wired. [Online]
Available at: www.wired.co.uk/article/facebook-google-subsea-cables [Accessed November 2021].
Cabinet Office, 2021. Global Britain in a Competitive Age: the Integrated Review of Security, Defence, Development and Foreign Policy, s.l.: GOV.UK.
Ceci, L., 2022. Most popular app categories worldwide during 3rd quarter 2020, by reach. Statista.
De La Chapelle, B. a. L. P., 2021. We Need to Talk ABout Data: Framing the Debate Around Free Flow of Data and Data Sovereignty, s.l.: Internet and Jurisdiction Policy Network.
Deloitte and MAPI, 2019. Deloitte and MAPI Smart Factory Study - Capturing value through the digital journey, s.l.: s.n.
Department for Digital, Culture, Media & Sport, 2021. Assessing the UK’s Regional Digital, London: HM Government.
Dossett, J., 2022. CNET. [Online]
Available at: www.cnet.com/personal-finance/crypto/twitter-to-begin-cryptocurrency-payouts-for-creators-this-weeks-top-bitcoin-and-crypto-news/ [Accessed July 2022].
Evening Standard, 2022. Aldi goes head-to-head with Amazon as it launches checkout free store. [Online]
Available at: www.standard.co.uk/business/aldi-shop-and-go-amazon-fresh-checkout-free-sainsburys-tesco-b977274.html [Accessed 27 October 2022].
Foumart, 2013. Electromagnetic Spectrum. [Art] (English Wikipedia).
Government Office for Science, 2014. Futures toolkit for policy-makers and analysts. [Online]
Available at: www.gov.uk/government/publications/futures-toolkit-for-policy-makers-and-analysts [Accessed 10 November 2022].
Government Office for Science, 2020. The future of citizen data systems, Westminster, London: HM Government.
Hall, S., 2022. World Economic Forum. [Online]
Available at: www.weforum.org/agenda/2022/08/sustainable-data-centre-heating/ [Accessed July 2022].
Manganaro, G. & Leenaerts, D., 2013. Adnavces in Analog and RF IC Design for Wireless Communication Systems.
Office for National Statistics, 2022. Trust in government, UK: 2022. [Online]
Available at: www.ons.gov.uk/peoplepopulationandcommunity/wellbeing/bulletins/trustingovernmentuk/2022 [Accessed 27 October 2022].
Tammy Bahmanziari, J. M. P. &. L. C., 2003. Is Trust Important in Technology Adoption? A Policy Capturing Approach. Journal of Computer Information Systems, 43(4), pp. 46-54.
Vodafone Press Office, 2022. Vodafone.co.uk. [Online]
Available at: www.vodafone.co.uk/newscentre/press-release/3g-retirement-in-2023/ [Accessed July 2022].
Wallach, O. & Amoros, R., 2021. Visual Capitalist. [Online]
Available at: www.visualcapitalist.com/the-worlds-biggest-startups-top-unicorns-of-2021/ [Accessed August 2022].
Wilson, B. et al., 2018. Unlocking the digital potential of rural areas across the UK, s.l.: Rural England CIC.
World Skills Uk, 2021. Disconnected? Exploring the digital skills gap, s.l.: s.n.
Xin Li, T. J. H. J. S. V., 2008. Why do we trust new technology? A study of initial trust formation with organizational information systems. The Journal of Strategic Information Systems, 17(1), pp. 39-71.