
Size and Health of the UK Space Industry 2020
Published 19 May 2021

© Crown copyright 2021
This publication is licensed under the terms of the Open Government Licence v3.0 except where otherwise stated. To view this licence, visit nationalarchives.gov.uk/doc/open-government-licence/version/3 or write to the Information Policy Team, The National Archives, Kew, London TW9 4DU, or email: psi@nationalarchives.gov.uk.
Where we have identified any third party copyright information you will need to obtain permission from the copyright holders concerned.
This publication is available at https://www.gov.uk/government/publications/uk-space-industry-size-and-health-report-2020/size-and-health-of-the-uk-space-industry-2020
Summary Report for the UK Space Agency
know.space[footnote 1] May 2021
1. Key findings
This edition of the ‘Size & Health of the UK Space Industry’ comes at a uniquely challenging time. The research was undertaken during the ongoing COVID-19 pandemic, and the period of analysis (2017/18-2018/19, with a forecasted estimate for 2019/20) provides insights into the industry’s preparation for the UK’s exit from the European Union (EU)[footnote 2]. Accordingly, this 2020 study was designed as a ‘light touch’ update – a focus on core metrics and innovative exploitation of secondary data allowed a streamlined online survey to minimise industry burden whilst providing a new wave of historically consistent time series data.
In spite of the challenges, there are a number of positive findings, including modest growth, a large increase in industry population (fuelled by new incorporations, signifying a healthy ecosystem), plus strong optimism for the next 3 years. The importance of satellites to the wider economy continues to grow, with over £360 billion of UK economic activity now supported.
The findings are based on research of 1,218 UK-based organisations with space-related activities, comprising 279 survey responses plus desk-based research of over 1,000 organisations.
1.1 A growing industry
All growth rates are real (inflation-adjusted) compound annual growth rates (CAGR) since 2016/17.
Total UK space industry income grew to £16.4 billion in 2018/19, a growth rate of 2.8% per annum since 2016/17. The forecasted estimate for 2019/20 is £16.6 billion (+0.8%).
The industry numbers 1,218 organisations, with 95 new incorporations in the last 2 years.
The segments that experienced growth were:
- Space Applications (+4%, +£852m; driving the vast majority of growth)
- Space Manufacturing (+2%, +£73m)
- Ancillary Services (+4%, +£38m)
One segment experienced decline: Space Operations (-2%, -£75m).
The activities that saw the most significant growth were:
- location-based signal service providers (+115%, +£453m)
- fixed satellite communication services (+52%, +£392m)
- processors of satellite data (+34%, +£146m)
- applications leveraging satellite data (+26%, +£219m)
- suppliers of materials and components (+25%, +£157m)
The activities that had notable declines were:
- mobile satellite communication services (-24%, -£239m)
- suppliers of user devices and equipment (-5%, -£190m)
- proprietary satellite operation (-3%, -£104m)
- launch vehicles and subsystems (-14%, -£108m)
With a (relatively) stable GBP/USD exchange rate, the UK industry growth rate matched that of the global industry, so the UK’s share of the global space economy remained unchanged at 5.1% in 2018/19.
1.2 An important industry
Direct employment grew to 45,100 jobs in 2018/19 (from 41,900 in 2016/17), equivalent to 0.14% of the total UK workforce, supporting a total of 126,300 jobs across the supply chain.
The industry directly contributed £6.6 billion of Gross Value-Added to UK economic output (0.30% of UK GDP, +5% per annum since 2016/17), and a total of £15.8 billion (including indirect and induced supply chain effects) in 2018/19.
Labour productivity (GVA per employee) for the UK space industry was £145,468 in 2018/19 (up from £142,011 in 2016/17), 2.6 times the UK average labour productivity (£56,387).
The UK space industry workforce is exceptionally highly-skilled, with 3 in 4 (77%) employees holding at least a primary degree – higher than any sector in the ONS Census.[footnote 3]
Exports remained unchanged in real terms at £5.8 billion in 2018/19, accounting for 35.5% of total income– down from 37.4% in 2016/17 but still above the UK average (29.8%). The space export intensity increases to 60% if Direct-To-Home (DTH) broadcasting is excluded.
The most important export market for the UK space industry is the Rest of Europe, representing 19% of total income and 53% of total exports.
With R&D investment of £702 million, up 8.6% per annum since 2016/17 and equivalent to 10.7% of GVA, the space industry is 5 times more R&D intensive than the UK average.
The UK space industry has a strong commercial focus – 81.3% of income is commercial, comprised of sales to consumers (including DTH) at 49.7% and sales to other businesses at 31.6%. That said, there is a strong role for public demand (18.7%):
- Defence (8.6%)
- Civil Government (4.3%)
- Space Agencies (4.1%)
- European Commission (1.6%)
The dominance of Direct-to-Home (DTH) Broadcasting in industry income continues to be eroded. Though still the largest single activity, the share of income accounted for by DTH fell again to 46% in 2018/19 (from 48% in 2016/17), as DTH income remained static whilst the wider industry income grew (particularly other space applications).
The industry is concentrated and dominated by a few large organisations, with:
- just 13 organisations accounting for 82% of total space income
- 119 for the next 13%
- 1,086 for the remaining 5%.
132 organisations generate space income in excess of £5m.
All UK regions are home to headquarters of space organisations, though industrial sites (and employment) are concentrated in London, South East and East of England, and Scotland.
Services from satellites (be they UK or non-UK and public or commercial satellites) support wider industrial activities in the UK non-financial business economy that contribute at least £361 billion to UK GDP (16.9%), broken down by type as follows (not mutually exclusive):
- GNSS (PNT) satellite services support £314 billion of GDP (14.7%)
- Meteorological satellite services support £211 billion of GDP (9.8%)
- Communications satellite services support £101 billion of GDP (4.7%)
- Earth Observation satellite services support £100 billion of GDP (4.7%)
1.3 An industry with strong future growth beyond current challenges
According to survey responses on future outlook (next 3 years), the most prevalent obstacles to commercial success were:
- EU exit-related challenges (55%)
- COVID-related challenges (48%)
- economic uncertainty (43%)
Nearly half experienced a negative impact due to UK’s exit from the EU on income (46%, of which 20% rated as significantly negative) and demand (45%), plus workforce impacts (36%).
More than half of the survey respondents experienced a negative impact of COVID-19 on their income (54%) and demand (51%). About 2 in 5 (37%-41%) companies were also negatively affected in terms of their:
- workforce (37%)
- suppliers (41%)
- investments (37%)
New UK-headquartered space companies attracted investment of £4.33bn in total over 240 investment deals by at least 251 unique individual investors, making a total of 435 individual investment contributions in at least 110 UK space companies.
Survey respondents indicated optimism with respect to near-term growth:
- 3 in 5 expect income to be higher in the coming three years (62%, of which 41% expect much higher)
- over half (54%) expect to employ more staff
- more than 2 in 5 expect higher investment (45%), increased R&D expenditure (44%) and increased exports (40%)
In a validation of the Agency’s work, respondents said that key enablers for commercial success were:
- support and engagement with the UK Space Agency (more than 3 in 4 respondents, at 76%)
- desires for a UK National Space Programme (61%)
- UK-EU partnership deal (55%)
2. Summary
2.1 Introduction
With responsibility for the UK civil space programme, the UK Space Agency (UKSA) aims to grow the UK space industry, build a strong national space capability and foster exploitation of (national and international) space capabilities for the maximum economic, scientific and policy benefit for the UK. To guide its work, UKSA needs a means to monitor the health of the sector and to track the effectiveness of its activities and strategy.
Undertaken every two years[footnote 4] since 2010, the Size & Health of the UK Space Industry is a long-running study series that quantifies and tracks changes in the UK space industry. It measures if the sector is growing, and highlights the nature and source of the growth, including trends within sub-sectors, sources of income, and future expectations. It is the definitive source of information on the UK space sector, and a key resource for the Government’s evidence-based strategy, policy design and decision-making – but also for the wider sector (e.g. strategy, business cases, investor decks, scientific impact).
UKSA commissioned know.space – the specialist space economics consultancy – to conduct the latest update. This edition of the ‘Size & Health of the UK Space Industry’ comes at a uniquely challenging time. The period of analysis (2017/18-2019/20) captures industry preparing for and experiencing early impacts of the UK’s exit from the EU, whilst the study has been undertaken during the ongoing COVID-19 pandemic.
Accordingly, this 2020 study was designed as a ‘light touch’ update – a focus on core metrics and innovative exploitation of secondary data allowed a streamlined online survey. This minimised the industry burden whilst providing a new wave of historically consistent time series data covering the time period 2017/18 and 2018/19, and a forecasted estimate for 2019/20. This report summarises the findings of the 2020 edition.
Scope
The ‘space industry’ is defined to include all organisations that are engaged in any space-related activity, comprising both non-commercial organisations and commercial organisations.
Non-commercial organisations (for example, universities, research institutes) secure income to contribute space-specific research and expertise throughout the industry supply chain, often in partnership with commercial organisations. Non-commercial income includes grant funding, core funding, research funding, tuition fees, departmental expenditures, and operating budgets.
Commercial organisations (that is, businesses, companies, firms) earn revenue from the manufacture, launch and operation of satellites/spacecraft, and from utilisation of the signals and data supplied by satellites/spacecraft to develop value-added applications. Such organisations may also secure non-commercial income (for example grants) to undertake specific research and development.
The term ‘income’ covers both commercial revenues and non-commercial funding.
‘Space-related activity’ is defined to include[footnote 5]:
- Space Manufacturing (design and/or manufacture of space equipment and subsystems)
- Space Operations (launch and/or operation of satellites and/or spacecraft)
- Space Applications (applications of satellite signals and data)
- Ancillary Services (specialised support services)
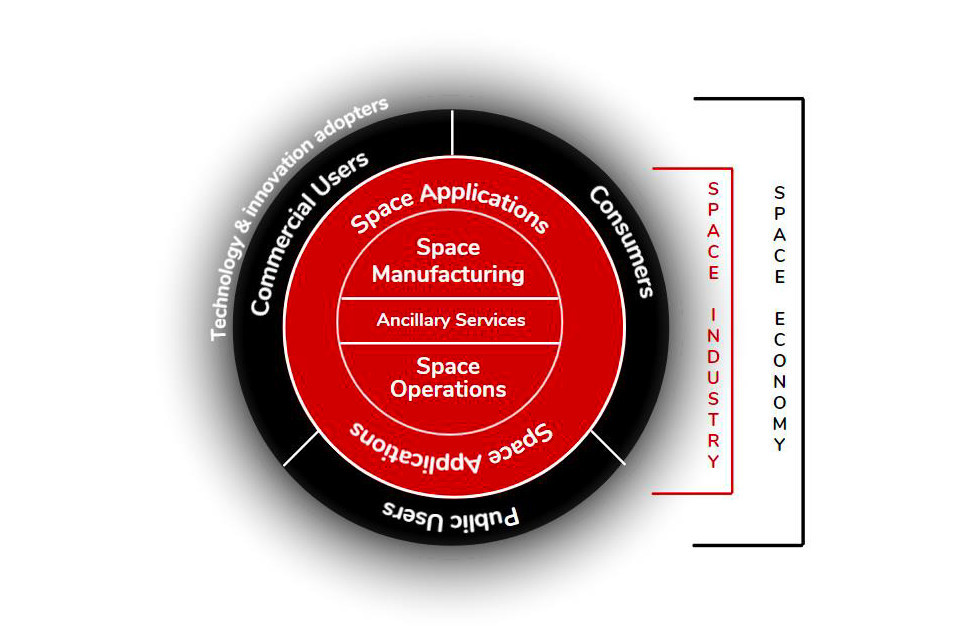
Diagram showing how activities of the space industry fit into the space economy
Space Manufacturing includes:
- launch vehicles and subsystems
- satellites/payloads/spacecraft and subsystems
- scientific instruments
- ground segment systems and equipment (control centres and telemetry)
- suppliers of materials and components
- scientific and engineering support
- fundamental and applied research
Space Operations includes:
- launch services
- launch brokerage services
- proprietary satellite operation (incl. sale/lease of capacity)
- third-party ground segment operation
- ground station networks
- in-orbit servicing
- debris removal
- Space Surveillance & Tracking (SST)
- space tourism
- in-space manufacturing
Space Applications includes:
- Direct-To-Home (DTH) broadcasting
- fixed and mobile satellite communications services (including very-small-aperture terminals (VSATs))
- location-based signal and connectivity service providers
- supply of user devices and equipment
- processors of satellite data
- applications leveraging satellite signals (for example GPS devices and location based services) and/or data (for example meteorology, geographic information system (GIS) software and geospatial products)
- other (for example Quantum Key Distribution)
Ancillary Services includes:
- launch and satellite insurance (incl. brokerage) services
- financial and legal services
- software and IT services
- market research and consultancy services
- business incubation and development
- policymaking, regulation and oversight
The outputs of the UK space industry are used to considerable benefit by a large and increasingly wide range of public, commercial and consumer users. Commercial users are defined as businesses in an industrial sector other than space that utilise satellite applications operationally to improve delivery of their core proposition. The value of commercial use is captured in the value of ‘Wider UK GDP supported by satellite services’.
Approach
This edition maintains the methodology of the 2018 edition to preserve consistency and comparability with time series and to identify patterns of growth and emerging trends, with some tweaks (listed below).
The research was undertaken employing a combination of primary research (279 responses to an online survey) and secondary research (desk-based research of more than 1,000 organisations) employed to deliver comprehensive coverage of the UK space industry. Secondary data sources used include Companies House records and statutory financial reports, subscription-based databases and information sources, own proprietary knowledge and databases, the ONS Annual Business Survey and supporting economy-wide data from the ONS and Bank of England. In keeping with the ‘light tough’ objective, this 2020 edition has maximised secondary research to lighten the burden on industry for the online questionnaire.
A small number of changes were adopted for the 2020 approach:
- reflecting the ‘light touch’ objective, the survey questionnaire was streamlined to reduce the data requested (for example, 2017/18 was optional, and income by domain was dropped) and online routing used to simplify the survey response journey
- the modernised segmentation of the 2016 and 2018 studies was maintained, but expanded to include new activities (for example Spaceports, Debris Removal, Space Surveillance and Tracking, In-Orbit Servicing)
- expanded identification of space-related organisations in the UK based on updated UK space-relevant conference lists – the 2020 findings are based on 1,218 UK-based space organisations
- micro-level secondary research of over 1,800 organisations using a wide range of public/free and private/paid information sources to determine UK and space relevance
- new for 2020, this edition includes research and analysis of investments into UK space companies
- an analysis about the impact of COVID-19 and EU-exit on UK space industry’s income, workforce, demand, suppliers, and investments
- an update of the assessment of the use of space and satellite services across the UK economy as presented in the 2016 and 2018 editions
Caveats
Though the research has been conducted by independent analysts with specialist knowledge of the space sector, using best practice and best judgement to calculate robust and fair estimates, the following caveats apply:
- Measurement error uncertainty of estimation: The analysis employs estimation and approximation techniques – the true coverage of the analysis and the measurement error associated with survey respondent data cannot be estimated
- Unidentified omissions: It is probable that some UK-based organisations with space-related activities have been missed, but any omissions should be small and have a negligible impact on estimates
- Financial years: Each company may choose the start and end dates of its financial year, so these vary across companies; our estimates of space-related income and employment therefore reflect the specific financial years of companies
- Exchange rate fluctuations: The reference currency for this analysis is GBP, and any input (e.g. company accounts stated in EUR) or comparators (for example, the size of the global space economy in USD) values must be converted to GBP using the prevailing exchange rate; though there has been a long-term depreciation in the value of GBP against the USD, the exchange rates maintained general stability over the period of analysis
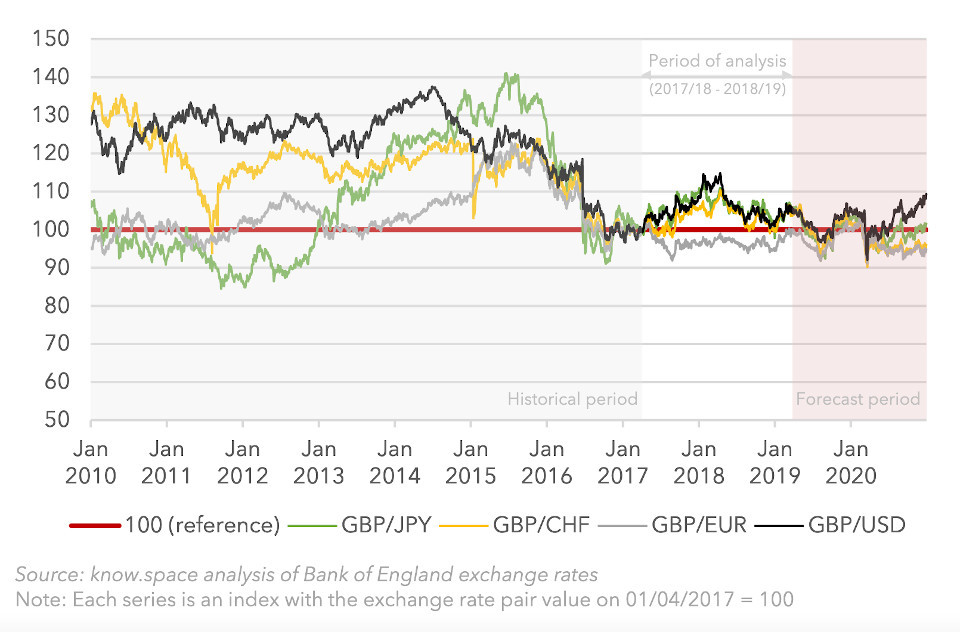
Graph showing global currency fluctuations between 2010 and 2020
Note: Unless otherwise noted: all figures are in 2018/19 prices, all growth rates are real (inflation-adjusted) and are calculated as compound annual growth rates (CAGR).
2.2 Size of the UK space industry (2018/19)
Population
The industrial population numbered 1,218 organisations with confirmed space-related activities in the UK in this edition.
Income
Total UK space industry income grew to £16.4 billion in 2018/19 (up from £15.6 billion in 2016/17). By far the largest segment is Space Applications with 71% of total income, and dominated by Direct-To-Home broadcasting (DTH) – although the DTH share of total industry income slips further to 46% (down from 48% in 2016/17 and 52% in 2014/15). Without DTH, the overall space industry income would fall to £8.9 billion, but with Other (non-DTH) applications at £4.1 billion Space Applications would still be the largest segment of UK space activity. Space Operations (13.5%) is the second largest segment, followed by Space Manufacturing (12.5%), and Ancillary Services (3.1%).
UK space industry income by segment and activity, 2018/19
| Segment | £m of income (2018/19) | % of total |
|---|---|---|
| DTH broadcasting | 7,533 | 46% |
| Other Space Applications | 4,126 | 25% |
| Space Operations | 2,216 | 13% |
| Space Manufacturing | 2,052 | 13% |
| Ancillary Services | 514 | 3% |
| Total | 16,440 | 100% |
Delving a little deeper, the sunburst chart below shows the breakdown of income by activity (information is provided in tabular form later).
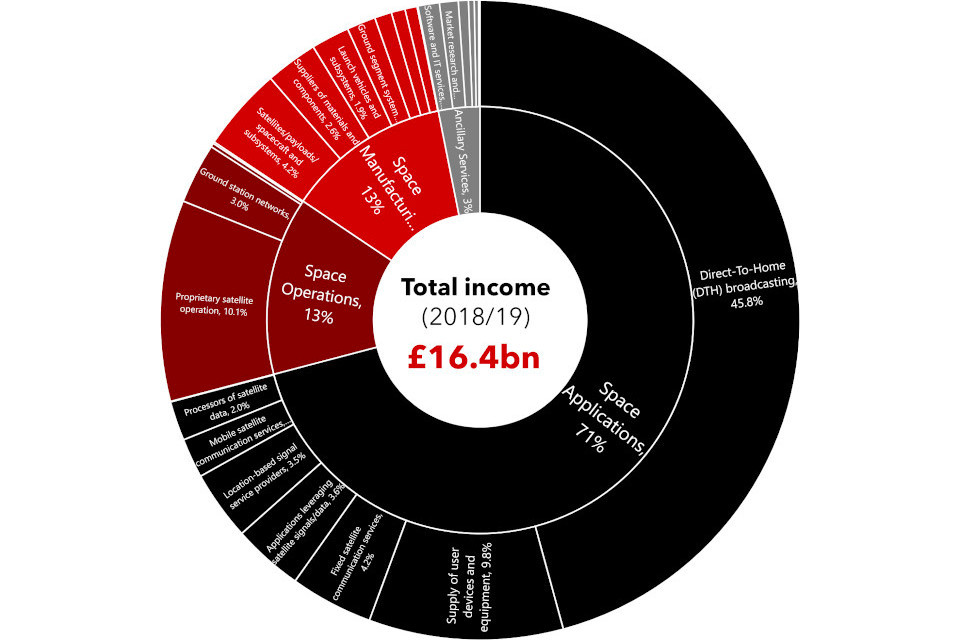
Diagram showing UK space industry income by segment and activity for 2018/19
Analysis by customer type reveals the commercial focus of the UK space industry – 81.3% of total income is commercial, comprised of sales to consumers (including DTH) at 49.7% and sales to other businesses at 31.6%. That said, there is a strong role for public demand (18.7%) – Defence (8.6%), Space Agencies (4.1%), Civil Government including Research/Science (4.3%), and European Commission (1.6%).
UK space industry income by customer type, 2018/19
| Customer type | £m of income (2018/19) | % of total |
|---|---|---|
| Commercial - Consumer (B2C) | 8,167 | 50% |
| Commercial - Business (B2B) | 5,200 | 32% |
| Defence/Military | 1,418 | 9% |
| Other Civil Government | 555 | 3% |
| European Space Agency | 521 | 3% |
| European Commission (EC) | 264 | 2% |
| Research/Science Funding Body | 157 | 1% |
| UK Space Agency | 92 | <1% |
| Other Space Agency | 66 | <1% |
| Total | 16,440 | 100% |
Exports
The UK space industry maintains its success in exports by generating more than 36% (£5.8 billion) of income from abroad (slightly down from 37% in 2016/17)[footnote 6]. At 36%, the UK space industry’s export share is higher than the export share of the UK economy as a whole (29.8%[footnote 7]). The picture improves further if DTH broadcasting – which has a strong domestic market focus – is filtered out. Indeed, the export share of the UK space industry excluding DTH stands at 60% in 2018/19.
The most important export market for the UK space industry is the Rest of Europe[footnote 8], representing 19% of total income and 53% of total exports (down from 20% and 54% in 2016/17, respectively). The second and third most important markets are North America and Asia & Oceania (7% and 5% of total income, and 18% and 14% of total exports, respectively).
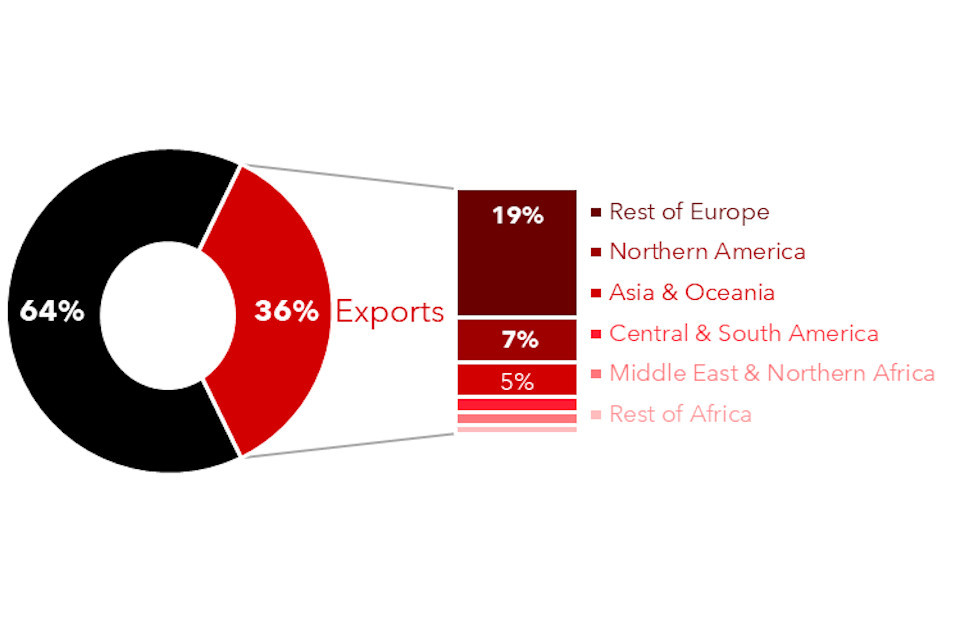
Graph showing percentage of the UK space industry income by customer region
Imports
Based on a limited sample (118 respondents), more than half (58%) of the industry’s inputs are imported from suppliers overseas. Inputs from UK suppliers are split somewhat evenly between space and non-space sectors.
UK space inputs by supplier type, 2018/19
| Supplier type | % of space industry input |
|---|---|
| Overseas | 58 |
| UK space | 24 |
| UK non-space | 18 |
Gross Value-Added (GVA)
In 2018/19, the UK space industry is estimated to have directly contributed £6.6 billion (up from £6.0 billion in 2016/17) of Gross Value-Added (GVA) to UK economic output, equivalent to 40% of space industry income and 0.3% of total UK Gross Domestic Product (GDP) – both up from 38% and 0.29% in 2016/17, respectively, suggesting the space industry continues to outperform the wider economy in terms of productivity.
The majority of UK space GVA is generated in the Space Applications segment with 69%, slightly less than the 71% of income accounted for by the segment. As with income, this segment is led by Direct-To-Home broadcasting (contributing 41%). At 17%, Space Manufacturing accounts for a higher share of GVA than income (12.5%). At 11% Space Operations accounts for a smaller share of GVA than income (13.5%). Ancillary Services contributes almost the same to both space industry GVA (3.4%) and income (3.1%).
UK space industry Gross Value-Added (GVA), 2018/19
| Segment | GVA in £m (2018/19) | % of total |
|---|---|---|
| DTH broadcasting | 2,679 | 41% |
| Other Space Applications | 1,864 | 28% |
| Space Manufacturing | 1,090 | 17% |
| Space Operations | 690 | 11% |
| Ancillary Services | 225 | 3% |
| Total | 16,440 | 100% |
Employment
Total employment (headcount) in the UK space industry was 45,100 employees in 2018/19 (41,900 employees in 2016/17) – equivalent to 0.14% of the total UK workforce.
Space Applications also dominated employment, accounting for 67% of the industry’s total, of which DTH broadcasting is 44% of the total. Space Manufacturing employs a greater number of staff than Space Operations (20% and 7%, respectively), with Ancillary Services making up a small but important workforce (6%).
UK space industry employment by segment, 2018/19
| Segment | Employees (2018/19) | % of total |
|---|---|---|
| DTH broadcasting | 19,796 | 44% |
| Other Space Applications | 10,256 | 23% |
| Space Manufacturing | 8,924 | 20% |
| Space Operations | 3,360 | 7% |
| Ancillary Services | 2,752 | 6% |
| Total | 16,440 | 100% |
Employment by gender
The majority (63.5%) of employees in the UK space industry are male, based on the limited sample of responses. Just 36.5% of space industry employees are female.
Productivity & Skills
The labour productivity (GVA per employee) for the UK space industry in 2018/19 is estimated at £145,468 (slightly up from £142,011 in 2016/17) – equivalent to 2.6 times the UK’s average labour productivity (£56,387).[footnote 9]
This high level of labour productivity reflects the exceptionally skilled workforce of the UK space industry. Survey respondents indicate that most employees have undertaken university education, with 77% of employees possessing at least a bachelor’s degree. In terms of the ‘share of employees holding a higher degree, first degree or HNC/HND and equivalent qualifications’, the average qualification level of space industry employees is higher than any sector covered by ONS Census data for England and Wales[footnote 10]. This applies for the whole space industry and all four of the value chain segments.
Research and Development (R&D)
An estimated £702m was spent on space-related R&D (equivalent to 4.3% of total industry income) in 2018/19 – an increase of 8.6% per annum since 2016/17. This R&D investment was funded almost equally from internal (48%) and external (52%) sources. Investment in R&D can have a long and broad economic effect if it generates new knowledge, technologies, capabilities and derived products and services. This is particularly true in the space industry whereby capabilities developed in the R&D-intensive manufacturing and operations segments are commercialised in the applications segment and by commercial users.
With the equivalent of 10.7% of direct industry GVA invested in R&D, space industry R&D is 5 times higher than the UK average of 1.71%[footnote 11].
Industry composition
The UK space industry covers the full spectrum of organisation size (in terms of space-related income and not total organisation income), from start-ups with low space-related income to multinational conglomerates turning over tens of millions in space-related income. However, the space industry is concentrated and dominated by a few large organisations, with just 13 organisations accounting for 82% of total space-related income, 119 for the next 13% and 1,086 for the remaining 5%. Only 132 organisations generate space income in excess of £5m.
2.3 Regional distribution of the UK space agency (2018/19)
Population by region
Based on postcode data from survey responses and gathered through desk-based research, it is possible to analyse the regional composition of the UK space industry workforce across the twelve ‘NUTS1[footnote 12]’ regions of the UK – the nine regions of England and the three country-level regions of Scotland, Wales and Northern Ireland – and the British Crown Dependencies.
As in 2016/17, space-related activity sites are concentrated in the South and East of England – comprised of South-East (460 sites), London (289 sites), South-West (222 sites) and East of England (172 sites) regions – tied with Scotland (173 sites). Wales is home to 61 space-related organisation sites, and Northern Ireland has 35 sites. All NUTS1 regions have a count of space-related organisation sites in the double-digits, whilst there were 3 such sites in the British Crown Dependencies.
UK space organisation population by region, 2018/19
| Region | Space organisations |
|---|---|
| South East | 460 |
| London | 289 |
| South West | 222 |
| Scotland | 173 |
| East of England | 172 |
| East Midlands | 120 |
| North West | 104 |
| West Midlands | 92 |
| Yorkshire and the Humber | 63 |
| Wales | 61 |
| North East | 51 |
| Northern Ireland | 35 |
| Crown Dependencies | 3 |
| Other/Undefined | 106 |
| Total | 1,951 |
Note: Total of regional population exceeds the UK total due to some organisations being present in multiple regions.
Income by region
The geography of income is defined with respect to the location of the organisation’s headquarters. Though each of the 13 regions/nations is home to many headquartered organisations, the distribution of total income of varies greatly across regions.
London accounted for the majority (£9.7bn, 59%) of total UK space industry income in 2018/19, followed by the South East (£2.9bn, 18%), East of England (£2.1bn, 13%) and West Midlands (£0.8bn, 5%). Together, the 4 regions account for 94% of total UK space income. Both the South East and East of England showed an income share increase from 16% and 14%, respectively, when compared to the last edition, with a consequent decline for London’s income share from 64% in 2016/17.
UK space industry income by region, 2018/19
| Region | Space organisation HQs | Income 2018/19, £m |
|---|---|---|
| London | 227 | 9,700 |
| South East | 325 | 2,899 |
| East of England | 117 | 2,114 |
| West Midlands | 51 | 809 |
| South West | 125 | 231 |
| Scotland | 96 | 137 |
| Yorkshire and the Humber | 31 | 128 |
| North East | 28 | 88 |
| East Midlands | 74 | 83 |
| Wales | 31 | 73 |
| North West | 52 | 44 |
| Northern Ireland | 17 | 32 |
| Crown Dependencies | 3 | 0 |
| Other/Undefined | 41 | 103 |
| Total | 1,218 | 16,440 |
Note: Income distribution reflects the location of the headquarters rather than the deistribution of value creation.
Employment by region
Space employment is much more evenly distributed across regions than income, revealing that large UK space organisations (especially those headquartered in London and the South-East/East regions) have locations in multiple regions.
London (27%, down from 29% in 2016/17) and the South East (23%) employ the most staff and account for half of all employees combined. Scotland and the East of England follow, with shares of 17% and 11%, respectively.
UK space industry employment by region, 2018/19
| Region | Space organisations | Employees 2018/19 |
|---|---|---|
| South East | 460 | 10,475 |
| London | 289 | 11,999 |
| Scotland | 173 | 7,703 |
| East of England | 172 | 4,933 |
| South West | 222 | 1,799 |
| North West | 104 | 2,543 |
| East Midlands | 120 | 1,179 |
| West Midlands | 92 | 1,318 |
| Yorkshire and the Humber | 63 | 1,314 |
| North East | 51 | 1,014 |
| Wales | 61 | 415 |
| Northern Ireland | 35 | 133 |
| Crown Dependencies | 3 | 2 |
| Other/Undefined | 106 | 255 |
| Total | 1,951 | 45,086 |
2.4 Growth of the UK space industry
Population growth
The industrial population grew once again to 1,218 organisations with confirmed space-related activities in the UK – continuing a strong growth trend since 2012 (CAGR 23%, see table below). This growth demonstrates the dynamism of the sector – with new entrants such as start-ups and spin-outs, and a growing list of inward investments offsetting attrition from the industry.
There were 95 new incorporations in the period, continuing a recent trend of 53 incorporations per year since 2012, having averaged 28 per year between 2000 and 2012.
| Year | Number of organisations |
|---|---|
| 2006 | 227 |
| 2008 | 208 |
| 2010 | 260 |
| 2012 | 234 |
| 2014 | 303 |
| 2016 | 697 |
| 2018 | 948 |
| 2020 | 1,218 |
Income growth
UK space industry income continued to grow, although the rate of growth slowed slightly to 2.8% per annum between 2016/17 and 2018/19 – from an average of 7.8% per annum between 1999/00 and 2016/17, and more recently 3.3% between 2014/15 and 2016/17. While this represents slower growth than the historical trend, it still outpaced growth in the general UK economy which also exhibited a slowdown over the same period (1.3%)[footnote 13]. Note that to reflect current challenges and uncertainty, 2019/20 has been conservatively forecasted as a two-year historical average.
UK space industry income, 2009/10 - 2019/20
| Year | Current prices (£m) | 2018/19 prices (£m) | Growth y-o-y% |
|---|---|---|---|
| 2009/10 | 8,334 | 10,160 | 8.0% |
| 2010/11 | 9,188 | 10,822 | 6.5% |
| 2011/12 | 11,087 | 12,520 | 15.7% |
| 2012/13 | 11,848 | 13,036 | 4.1% |
| 2013/14 | 13,347 | 14,353 | 10.1% |
| 2014/15 | 13,702 | 14,581 | 1.6% |
| 2015/16 | 13,998 | 14,880 | 2.1% |
| 2016/17 | 14,792 | 15,553 | 4.5% |
| 2017/18 | 15,242 | 15,586 | 0.2% |
| 2018/19 | 16,440 | 16,440 | 5.5% |
| 2019/20 | 16,865 | 16,578 | 0.8% |
Note: 2019/20 is a forecasted estimate. Reflecting the considerable prevailing uncertainty, 2019/20 has been estimated for non-respondents using a two-year average rather than an historical growth rate (as used in previous editions).
A longer-term perspective reveals the true success story of the UK space industry: industry income has almost quadrupled (x3.8) in real terms since the turn of the millennium (a CAGR of 5.5% since 1999/00), and increased by 62% in real terms since 2009/10.
Long-term UK space industry income, 1999/00 – 2019/20e
| Year | UK space industry income in £m (2018/19 prices) |
|---|---|
| 1999/00 | 4,317 |
| 2000/01 | 4,963 |
| 2001/02 | 5,447 |
| 2002/03 | 5,821 |
| 2003/04 | 6,374 |
| 2004/05 | 6,596 |
| 2005/06 | 7,004 |
| 2006/07 | 7,613 |
| 2007/08 | 8,573 |
| 2008/09 | 9,242 |
| 2009/10 | 10,160 |
| 2010/11 | 10,822 |
| 2011/12 | 12,520 |
| 2012/13 | 13,036 |
| 2013/14 | 14,353 |
| 2014/15 | 14,581 |
| 2015/16 | 14,880 |
| 2016/17 | 15,553 |
| 2017/18 | 15,586 |
| 2018/19 | 16,440 |
| 2019/20 | 16,578 |
The aggregate-level growth rate conceals variation in performance by activities.
The segments that experienced growth were:
- Space Applications (+4%, +£852m; with non-DTH applications driving the vast majority of growth)
- Space Manufacturing (+2%, +£73m)
- Ancillary Services (+4%, +£38m)
The activities that saw the most significant growth were:
- Location-based signal service providers (+115%, +£453m)
- Fixed satellite communication services (+52%, +£392m)
- Processors of satellite data (+34%, +£146m)
- Applications leveraging satellite data (+26%, +£219m)
- Suppliers of materials and components (+25%, +£157m)
The following tables show the income growth for activities in each segment between 2016/17 and 2018/19, in 2018/19 prices.
| Industry segment / activity | 2016/17 income (£m) | 2018/19 income (£m) | CAGR % |
|---|---|---|---|
| All segments and activities | 15,553 | 16,440 | 3% |
| Space Manufacturing activity | 2016/17 income (£m) | 2018/19 income (£m) | CAGR % |
|---|---|---|---|
| Launch vehicles and subsystems | 425 | 317 | -14% |
| Satellites/payloads/spacecraft and subsystems | 692 | 697 | 0% |
| Scientific instruments | 55 | 101 | 36% |
| Ground segment systems and equipment | 295 | 243 | -9% |
| Suppliers of materials and components | 275 | 433 | 25% |
| Scientific and engineering support | 109 | 140 | 13% |
| Fundamental and applied research | 126 | 114 | -5% |
| Space test facilities | - | 7 | - |
| Segment total | 1,979 | 2,052 | 2% |
| Space Operations activity | 2016/17 income (£m) | 2018/19 income (£m) | CAGR % |
|---|---|---|---|
| Launch services | 2 | 4 | 36% |
| Launch brokerage services | 4 | 1 | -49% |
| Proprietary satellite operation (incl. sale/lease) | 1,773 | 1,669 | -3% |
| Third-party ground segment operation | 37 | 33 | -6% |
| Ground station networks | 475 | 501 | 3% |
| In-Orbit Servicing | - | 5 | - |
| Debris Removal | - | 1 | - |
| Space Surveillance & Tracking (SST) | - | 2 | - |
| Space Tourism | - | ~o | - |
| In-space manufacturing | - | ~0 | - |
| Spaceports | - | 2 | - |
| Segment total | 2,291 | 2,216 | -2% |
| Space Applications activity | 2016/17 income (£m) | 2018/19 income (£m) | CAGR % |
|---|---|---|---|
| Direct-To-Home (DTH) broadcasting | 7,466 | 7,533 | 0% |
| Fixed satellite communication services | 298 | 689 | 52% |
| Mobile satellite communication services | 568 | 329 | -24% |
| Location-based signal service providers | 125 | 578 | 115% |
| Supply of user devices and equipment | 1,802 | 1,612 | -5% |
| Processors of satellite data | 182 | 328 | 34% |
| Applications leveraging satellite signals/data | 366 | 585 | 26% |
| Other | - | 4 | - |
| Non-DTH Space Applications segment subtotal | 3,341 | 4,126 | 11% |
| Segment total | 10,807 | 11,659 | 4% |
| Ancillary Services activity | 2016/17 income (£m) | 2018/19 income (£m) | CAGR % |
|---|---|---|---|
| Launch and satellite insurance (incl. brokerage) services | 93 | 82 | -6% |
| Legal and financial services | 13 | 14 | 4% |
| Software and IT services | 141 | 178 | 12% |
| Market research and consultancy services | 147 | 157 | 3% |
| Business incubation and development | 52 | 50 | -2% |
| Policymaking, regulation and oversight | 33 | 34 | 2% |
| Segment total | 476 | 514 | 4% |
The dominance of Direct-to-Home (DTH) Broadcasting in industry income (69% in 2010/11) continues to be eroded. Though still the largest single activity by some distance, the share of income accounted for by DTH fell again to 47% in 2018/19, as DTH income remained static whilst the wider industry income grew (particularly other space applications).
The one segment that experienced decline was Space Operations (-2%, -£75m).
The activities that had notable declines were:
- mobile satellite communication services (-24%, -£239m)
- suppliers of user devices and equipment (-5%, -£190m)
- proprietary satellite operation (-3%, -£104m)
- launch vehicles and subsystems (-14%, -£108m, with a decline in defence contracts)
Employment growth
Direct employment in the UK space industry was around 45,100 jobs in 2018/19 following strong growth of 2.3% since 2017/18 – double the growth rate of the total employed UK workforce (1.1%)[footnote 14].
UK space industry employment, 2009/10 - 2019/20e
| Year | Employees | Growth year-on-year % |
|---|---|---|
| 2009/10 | 28,995 | 16.5% |
| 2010/11 | 28,942 | -0.2% |
| 2011/12 | 32,024 | 10.6% |
| 2012/13 | 33,882 | 5.8% |
| 2013/14 | 37,391 | 10.4% |
| 2014/15 | 38,522 | 3.0% |
| 2015/16 | 41,690 | 8.2% |
| 2016/17 | 41,929 | 0.6% |
| 2017/18 | 44,052 | 5.1% |
| 2018/19 | 45,086 | 2.3% |
| 2019/20* | 46,135 | 2.3% |
DTH broadcasting accounts for 44% of total space industry employment. Space Manufacturing is the second largest employer (after Space Applications) with 8,924 employees.
Employment in the UK space industry has grown strongly (CAGR 5.8%) since 1999/00.
Long-term UK space industry employment, 1999/00 - 2019/20e
| Year | UK space industry employees |
|---|---|
| 1999/00 | 14,651 |
| 2000/01 | 15,256 |
| 2001/02 | 15,466 |
| 2002/03 | 15,575 |
| 2003/04 | 15,397 |
| 2004/05 | 16,241 |
| 2005/06 | 17,206 |
| 2006/07 | 18,873 |
| 2007/08 | 22,789 |
| 2008/09 | 24,887 |
| 2009/10 | 28,995 |
| 2010/11 | 28,942 |
| 2011/12 | 32,024 |
| 2012/13 | 33,882 |
| 2013/14 | 37,391 |
| 2014/15 | 38,522 |
| 2015/16 | 41,690 |
| 2016/17 | 41,929 |
| 2017/18 | 44,052 |
| 2018/19 | 45,086 |
| 2019/20 | 46,135 |
Gross Value-Added (GVA) growth
Space GVA increased by 5.0% p.a. between 2016/17 and 2018/19 to £6.6 billion.
UK space industry Gross Value-Added, 2009/10 - 2019/20e
| Year | Current prices (£m) | 2018/19 prices (£m) | Growth y-o-y% |
|---|---|---|---|
| 2009/10 | 3,789 | 4,619 | 0.5% |
| 2010/11 | 4,130 | 4,865 | 5.3% |
| 2011/12 | 4,597 | 5,191 | 6.7% |
| 2012/13 | 5,044 | 5,550 | 6.9% |
| 2013/14 | 5,020 | 5,398 | -2.7% |
| 2014/15 | 5,132 | 5,461 | 1.2% |
| 2015/16 | 5,257 | 5,588 | 2.3% |
| 2016/17 | 5,663 | 5,954 | 6.6% |
| 2017/18 | 6,438 | 6,583 | 10.6% |
| 2018/19 | 6,559 | 6,559 | -0.4% |
| 2019/20 | 6,703 | 6,589 | 0.5% |
Enablers of growth
In a validation of the Agency’s work, 3 in 4 respondents (76%) cited support and engagement with the UK Space Agency as a key enabler for ongoing commercial success, followed by a desire for increased spend on a UK National Space Programme (61%) and UK-EU partnership deal for the UK’s exit from the EU (55%).
| Growth enabler | % of respondents citing as a key enabler |
|---|---|
| Support and engagement with the UK Space Agency | 76% |
| Increased spend on a UK national space programme | 61% |
| UK-EU partnership deal after the UK’s exit from the EU (Brexit) | 55% |
| National Space Council & National Space Strategy | 45% |
| Business-friendly legislation and regulation | 41% |
| Encouraging STEM update through education & outreach | 35% |
| UK sector deal | 32% |
| Securing space launch capability in the UK | 25% |
| Enhanced export support | 26% |
| Regulation of spaceflight and associated activities | 14% |
| Other | 10% |
| None of the above | 3% |
Obstacles to growth
EU exit-related challenges was the most prevalent obstacle to ongoing commercial success, cited by more than half (55%) of respondents, followed closely by COVID-related challenges (48%) and economic uncertainty (43%). A wide range of diverse barriers were also indicated by respondents.
| Growth barrier | % of respondents citing as an obstacle to growth |
|---|---|
| EU exit-related challenges | 55% |
| COVID-related challenges | 48% |
| Economic uncertainty | 43% |
| Cash flow | 29% |
| Obtaining finance | 28% |
| Recruiting staff | 28% |
| Shortage of skills generally | 24% |
| Competition in the market | 23% |
| Late payment | 19% |
| Exchange rates | 16% |
| Regulations | 16% |
| Export controls | 15% |
| Other (please specify): | 16% |
| Overseas preference for domestic suppliers | 14% |
| Difficulty identifying overseas sales opportunities | 13% |
| Shortage of managerial skills / expertise | 13% |
| Red tape | 13% |
| Tax (VAT, PAYE, business rates) | 12% |
| Overseas licensing and regulation | 9% |
| Availability / cost of suitable premises | 7% |
| Not being able to increase prices / fees | 6% |
| None of the above | 5% |
| Pension | 2% |
Impact of EU exit
Reflecting the identification of EU exit-related challenges as a key obstacle to commercial success, a little under half of survey respondents indicated a negative impact on income (46%, of which 20% rated the impact as significantly negative) and demand (45%). About 1 in 3 reported some negative impact in their workforce (36%), suppliers (31%) and investments (25%). These views correspond with the widely identified barrier of UK’s exit from the EU. Very few respondents (1%-6%) indicated a positive effect of EU exit.
Impact of EU exit
| Significant negative impact | Some negative impact | No impact | Some positive impact | Significant positive impact | N/A | |
|---|---|---|---|---|---|---|
| Investments | 8% | 17% | 45% | <1% | 1% | 15% |
| Suppliers | 8% | 25% | 51% | <1% | 1% | 8% |
| Workforce | 12% | 24% | 46% | 1% | 1% | 8% |
| Income | 20% | 26% | 37% | 2% | 1% | 5% |
| Demand | 17% | 28% | 36% | 4% | 3% | 5% |
Impact of COVID-19
Similarly, negative sentiments were indicated with respect to the impact of COVID-19. More than half of the survey responses indicated a negative effect of COVID-19 on their income (54%) and demand (51%). About 2 in 5 (37%-41%) companies were also negatively affected in terms of their workforce (37%), suppliers (41%), and investments (37%). On the other hand, a small number of respondents experienced positive effects on demand (15%), income (9%) and workforce (7%).
Impact of COVID-19
| Significant negative impact | Some negative impact | No impact | Some positive impact | Significant positive impact | N/A | |
|---|---|---|---|---|---|---|
| Investments | 13% | 24% | 39% | <1% | 1% | 15% |
| Suppliers | 6% | 35% | 41% | <1% | 1% | 8% |
| Workforce | 8% | 29% | 42% | 6% | 1% | 6% |
| Income | 15% | 39% | 27% | 8% | 1% | 4% |
| Demand | 17% | 34% | 25% | 10% | 5% | 5% |
Investment monitor
New for 2020, this inaugural analysis portrays a vibrant sector attracting increasingly valuable and frequent investments from an increasingly diverse range of private investors.
Research of investments[footnote 15] into UK-headquartered space companies[footnote 16] between 2013 and 2020 using Crunchbase made a number of findings.
Over £4.33bn was invested in total, in over 240 investment deals[footnote 17] by at least 251 unique individual investors[footnote 18] making a total of 435 individual investment contributions in at least 110 UK space companies, of which at least:
- 101 received private investment
- 36 received public or other investment
- 27 received funding of unknown source
Three £1bn+ investments in large companies (two in OneWeb, one in Inmarsat), overshadow more numerous but lower-value investments. Filtering out such deals shows a clear and continuous increasing trend in the total value invested (with the exception of 2020, which may have been constrained by the COVID-19 pandemic).
There is a strong upward trend in both number of investments (from 3 in 2013 to 39 in 2020) and the population of investors (from 4 in 2013 to 69 in 2020), driven by private investors – revealing that investing in space is no longer limited to governments, high net-worth individuals and niche specialists.
Unsurprisingly, the most common investment type was a grant (50 grants)
Population of investors, by year
| Year | Private investors | Non-private investors | Unknown investors | All |
|---|---|---|---|---|
| 2013 | 4 | - | - | 4 |
| 2014 | 21 | 4 | 2 | 27 |
| 2015 | 63 | 3 | 3 | 69 |
| 2016 | 46 | 10 | 3 | 59 |
| 2017 | 41 | 12 | 5 | 58 |
| 2018 | 61 | 7 | 9 | 77 |
| 2019 | 46 | 8 | 10 | 64 |
| 2020 | 46 | 17 | 6 | 69 |
Number of investments by year
| Year | Total number of investments |
|---|---|
| 2013 | 3 |
| 2014 | 19 |
| 2015 | 31 |
| 2016 | 30 |
| 2017 | 34 |
| 2018 | 41 |
| 2019 | 42 |
| 2020 | 39 |
Total invested (all deals), by year
| Year | Total investment (all deals), £m |
|---|---|
| 2013 | 0 |
| 2014 | 14 |
| 2015 | 418 |
| 2016 | 939 |
| 2017 | 148 |
| 2018 | 180 |
| 2019 | 2,441 |
| 2020 | 189 |
Total invested (deals <£100m only), by year
| Year | Total invested (<£100m only) |
|---|---|
| 2013 | 0 |
| 2014 | 14 |
| 2015 | 48 |
| 2016 | 51 |
| 2017 | 148 |
| 2018 | 180 |
| 2019 | 221 |
| 2020 | 189 |
Three-year outlook
Survey respondents indicated optimism with respect to near-term growth:
- 3 in 5 (62%) expect income to be higher in the coming three years, of which 2 in 5 (41%) expect income to be much higher
- over half (54%) of respondents expecting to employ more staff
- more than 2 in 5 respondents expect higher investment (44%) and increased R&D expenditure (43%)
- 2 in 5 (40%) respondents foresee increased exports
The picture is not all positive, however, as almost 1 in 5 (17%) respondents expect income to be lower, and 15% expect reduced exports.
Three-year future outlook
| Much (>10%) lower | Slightly (<10%) lower | About the same | Slightly (<10%) higher) | Much (>10%) higher | N/A | |
|---|---|---|---|---|---|---|
| Investments | 3% | 5% | 27% | 19% | 26% | 13% |
| R&D spend | 5% | 6% | 28% | 18% | 26% | 10% |
| Exports | 7% | 8% | 25% | 16% | 24% | 12% |
| Employment | 6% | 5% | 25% | 25% | 29% | 5% |
| Income | 8% | 9% | 12% | 21% | 41% | 3% |
2.5 Supply chain effects
In order to capture the full economic impact of the UK space industry, it is necessary to consider not only its direct impact, but also indirect (secondary demand to UK suppliers) and induced impacts (derived demand from employee expenditure) across the economy.
This is achieved by estimating and applying a series of economic multipliers using Input-Output analysis and analytical tables published by the Office for National Statistics (ONS) and space-related GVA share of more than 100 different sectors (5-digit SIC codes).
Gross Value-Added (GVA)
The Type II multiplier measures direct, indirect and induced effects. It is estimated at 2.4 (up from 2.3 in 2018 edition), implying that each £1 of space industry GVA generates £1.40 worth of GVA in the supply chain and supporting sectors.
The contribution of the UK space industry including indirect and induced effects is therefore estimated at £15.8 billion in 2018/19. This implies that the sector’s direct GVA of £6.6 billion generates an additional GDP contribution of £9.2 billion in the UK economy through indirect impacts and induced impacts.
Employment
The Type II employment multiplier measures direct, indirect and induced effects. It is estimated at 2.8 (unchanged from the 2018 edition), suggesting that the activity of 100 employees in the space industry supports 180 additional employees among suppliers and in other economic sectors (such as retail and services). Using this multiplier, we estimate that the total UK-based employment supported by the activities of the UK space industry in 2018/19 is 126,300 employees. Direct employment in the space industry (45,100) thus supports 81,200 additional UK jobs through indirect and induced effects.
2.6 Wider UK GDP supported by satellite services
As flagged in the approach, the impact of space extends far beyond the space industry to a wide range of public, commercial and consumer users. Beyond the direct effects of the space industry itself, an assessment was made of which (non-space) UK industries employ satellite services in their commercial operations in order to derive an estimate of the proportion of UK GDP that is supported by satellite services.
The estimates are not a valuation of the economic value contributed by satellite services, and the estimates are not specific to UK-owned/operated satellites. Rather, the estimates indicate the total value of output of those industries that are supported by satellite services from UK and non-UK satellites.
Caveat: The analysis does not cover the full UK economy. Instead, it reflects the coverage of the ONS’s Annual Business Survey (ABS) and is limited to the UK Non-Financial Business Economy which accounts for approximately two thirds of the UK economy in terms of Gross Value Added. In other words, it excludes: financial and insurance, public administration and defence, public provision of education, public provision of health and all medical and dental practice activities. Furthermore, the ABS is a sample-based snapshot rather than a time-series data source and changes in the sample can affect the approximated Gross Value Added (aGVA) results.
Value of industrial activity supported
On the basis of the latest granular industry data (Annual Business Survey 2018) it has been estimated that satellite services (be they from UK or non-UK and public or commercial satellites) support wider industrial activities across the UK (non-financial business) economy that contribute at least £361 billion to UK GDP,[footnote 19] equivalent to 16.9% of UK GDP[footnote 20] (up from £302 billion and 15.3% in 2016/17).
Delving deeper reveals the importance of all satellite services, but highlights the particularly high adoption of GNSS (Global Navigation Satellite Systems, or more commonly: ‘satnav’), which enables a wide range of positioning, navigation and timing (PNT) applications:[footnote 21]
- GNSS satellite services support an estimated £314 billion of GDP (14.7%)
- meteorological satellite services support an estimated £211 billion of GDP (9.8%)
- communications satellite services support an estimated £101 billion of GDP (4.7%)
- earth Observation satellite services support an estimated £100 billion of GDP (4.7%)
2.7 Progress towards 2030 ambitions
As the definitive measure of UK space income, employment and exports, below presents a progress report on the UK government’s strategic ambitions for the industry by 2030.
Income share
Ambition: 10% of the world’s space economy by 2030. Status: 5.1% of the global space economy in 2018/19.
The UK’s global space share is strongly influenced by the Sterling (GBP) / US Dollar (USD) exchange rate – used to compare UK income (in GBP) with global income (in USD in The Space Report). Despite a 19% depreciation in Sterling since Space IGS ambitions were set (see below), the rate was unchanged at the end of the two-year period of analysis.
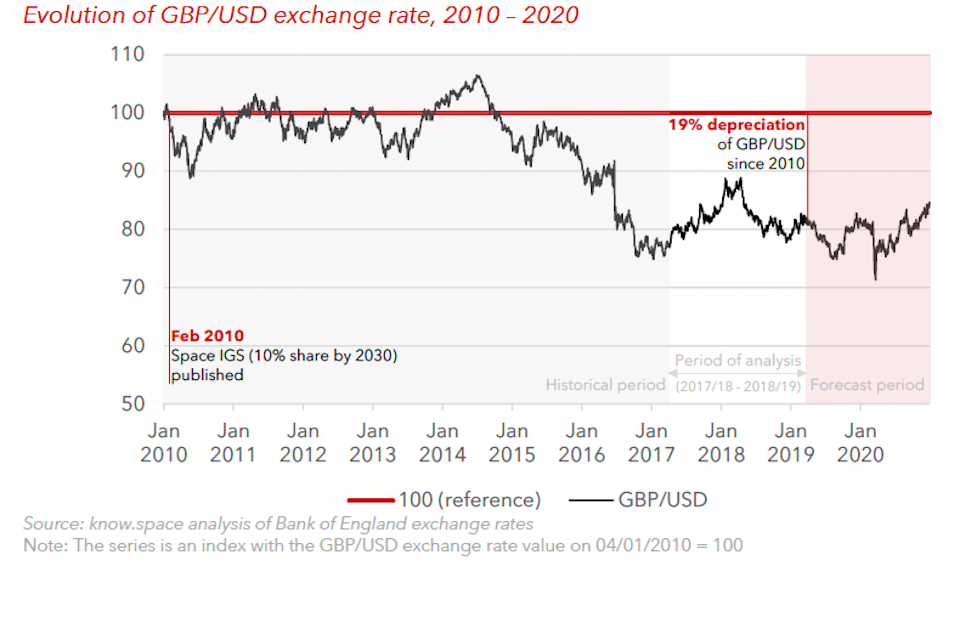
Graph showing evolution of GBP/USD exchange rate from 2010 to 2020
With a (relatively) stable GBP/USD exchange rate, the UK’s share of the global space economy remained unchanged at 5.1% in 2018/19. This trend is better understood by considering indices of UK and global industry size estimates (below). The UK industry has grown more than the global industry since 2009/10, boosted by fast growth in the early years, though UK growth has slowed to match the global growth rate in recent years. In fact, in 2017/18 the global industry growth outpaced the UK growth rate.
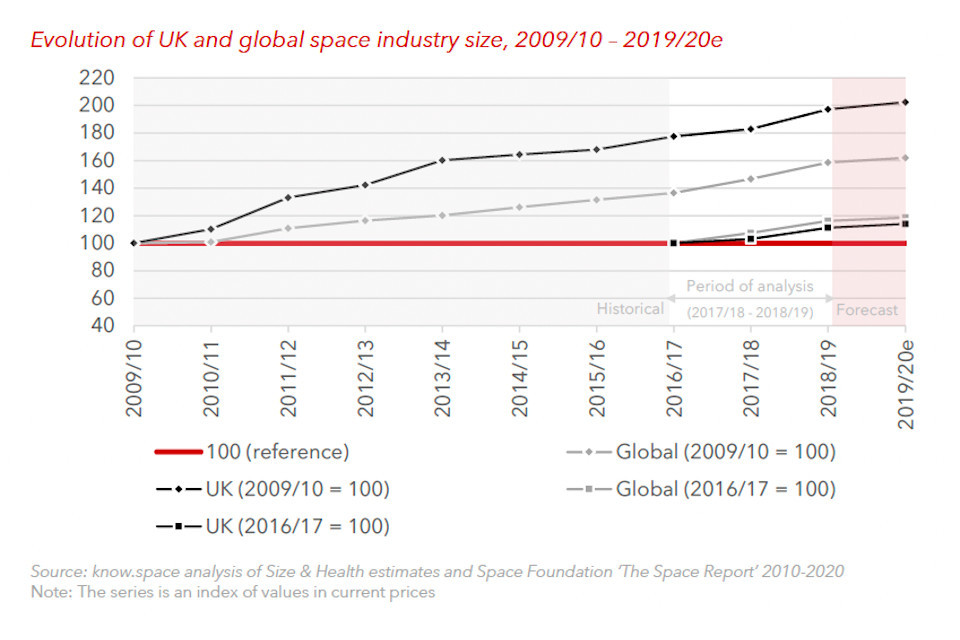
Graph showing evolution of UK and global space industry size from 2010 to 2020
Export intensity
Ambition: Export share of 60%. Status: Export share of 35.5%
The Space IGS targets an export share of 60% by 2030 from a starting point of 22% in 2010. The 2018 report showed an export share of 37.4% in 2016/17, but the export share of income fell slightly to 35.5% in 2018/19.
Considering the non-DTH activities of the space industry (where export is more likely), export intensity is estimated at 59.5% in 2018/19 (also down slightly from 65.4% in 2016/17).
Employment
Ambition: 100,000 jobs created by 2030, equivalent ot a total space industry workforce of 119,100. Status: 45,100 space industry jobs (direct) in 2018/19.
The Space IGS targets the creation of a further 100,000 space industry jobs from a starting point of 19,100 in 2007. Nine years later, in 2018/19, the space industry supported an estimated 45,100 direct jobs, also up from 41,900 jobs supported in 2016/17.
3. About know.space
know.space is a specialist space economics consultancy, based in London and Dublin. Founded by the leading sector experts, Greg Sadlier and Will Lecky, it is motivated by a single mission: to be the source of authoritative economic knowledge for the space sector. Email: hello@know.space
4. Acknowledgements
We would like to thank all the organisations who responded to our survey, and to those who helped promote it. We would also like to acknowledge the support of the UK Space Agency over the course of the project, and the bespoke analysis undertaken by the Office for National Statistics (ONS). Responsibility for the content of this report remains with know.space.
*[aGVA: approximated Gross Value Added *[GNSS]: Global Navigation Satellite Systems] *[ONS]: Office for National Statistics
-
know.consulting ltd. (CRN: 12152408; VAT: 333424820), trading as know.space ↩
-
The Prime Minister formally triggered Article 50 on 29 March 2017, and the United Kingdom ultimately left the EU single market and customs union on 31 December 2020. ↩
-
Note that here, as in other instances, Size & Health survey-based estimates are compared for context against national and regional ‘official statistics’ produced to rigorous standards defined in the [Code of Practice for Statistics]:(https://code.statisticsauthority.gov.uk/wp-content/uploads/2018/02/Code-of-Practice-for-Statistics.pdf). ↩
-
The Size and Health of the UK Space Industry 2018 report is available at: https://www.gov.uk/government/publications/uk-space-industry-size-and-health-report-2018 ↩
-
This 2020 edition fully adopts the modernised value chain segmentation introduced in the 2016 edition. For reference, Space Manufacturing and Space Operations combined can (roughly) be considered as ‘upstream’, and Space Applications as ‘downstream’. Ancillary Services provide specialised support to all other value chain segments. ↩
-
By definition, goods and services sold to ESA are an export as the ownership of goods or intellectual property changes hands from a UK entity to an entity that is based in a foreign country and which is not majority-controlled by UK interests. ↩
-
Department for International Trade (2019). UK Trade in Numbers, February 2019. ↩
-
Includes European Space Agency, European Commission, and European governments, businesses and consumers. ↩
-
Estimated UK GVA per filled job in 2018. Source: ONS (2020) Subregional Productivity: Labour Productivity (GVA per hours worked and GVA per filled job) indices by UK NUTS2 and NUTS3 regions. ↩
-
Note that here, as in other instances, Size & Health survey-based estimates are compared for context against national and regional ‘official statistics’ produced to rigorous standards defined in the Code of Practice for Statistics. ↩
-
ONS. (2020). Gross domestic expenditure on research and development, UK: 2018. ‘Total R&D expenditure in the UK in 2018 represented 1.71% of gross domestic product (GDP)’. ↩
-
Eurostat’s Nomenclature of Territorial Units for Statistics (NUTS). ↩
-
ONS (2020). Gross Domestic Product: chained volume measures: Seasonally adjusted £m. 2017Q2 to 2019Q2. ↩
-
Office for National Statistics (2020). A01: Summary of labour market statistics, December 2020. https://www.ons.gov.uk/employmentandlabourmarket/peopleinwork/employmentandemployeetypes/datasets/summaryof labourmarketstatistics ↩
-
Investment types covered by Crunchbase are: Funding Round, Equity Crowdfunding, Product Crowdfunding, Angel, Pre-Seed, Seed, Series A, Series B, Series C, Series Unknown, Convertible Note, Grant, Non-Equity Assistance, Post-IPO Equity, Debt Financing, Post-IPO Debt. ↩
-
Of the total 1,218 space organisations, approximately 500 appear on Crunchbase, of which c.290 list a UK headquarters. ↩
-
Note: Lower bound estimate – Investment value for 70 of the 240 deals was ‘undisclosed’, so treated conservatively as £0. ↩
-
Note: Lower bound estimate – The identity of 39 investors was ‘unknown’, which is treated together. ↩
-
This estimate has been calculated with the support of the Office for National Statistics (ONS). ↩
-
ONS (2020). Gross Domestic Product at market prices: Current price: Seasonally adjusted £m, https://www.ons.gov.uk/economy/grossdomesticproductgdp/timeseries/ybha/ukea. ↩
-
Usage of satellite services are not mutually exclusive so the sum across satellite types exceeds the total value supported. ↩