Trend Deck 2021: Urbanisation
Published 28 June 2021

© Crown copyright 2021
This publication is licensed under the terms of the Open Government Licence v3.0 except where otherwise stated. To view this licence, visit nationalarchives.gov.uk/doc/open-government-licence/version/3 or write to the Information Policy Team, The National Archives, Kew, London TW9 4DU, or email: psi@nationalarchives.gov.uk.
Where we have identified any third party copyright information you will need to obtain permission from the copyright holders concerned.
This publication is available at https://www.gov.uk/government/publications/trend-deck-2021-urbanisation/trend-deck-2021-urbanisation
1. Increasing global urban population
Between 2018 and 2030, the urban population is projected to increase in all size classes, while the rural population is projected to decline slightly. Rural areas were home to 45% of the world’s population in 2018, a proportion that is expected to fall to 40% by 2030.
In 2018, 1.7 billion people (23% of the world’s population) lived in a city with at least 1 million inhabitants. In 2030, a projected 28% of people worldwide will be concentrated in cities with at least 1 million inhabitants. Cities with more than 10 million inhabitants are often termed ‘megacities’. Globally, the number of megacities is projected to rise from 33 in 2018 to 43 in 2030.
World’s population by size of class settlement, 1990 to 2030
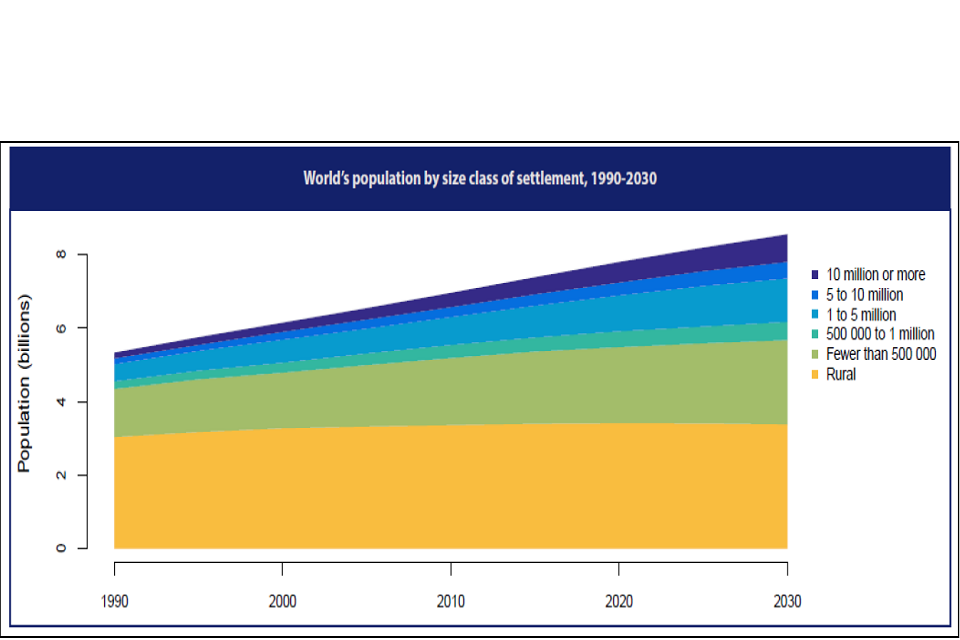
Line graph of population in billions over the time period 1990 to 2030.
Source:
- United Nations, Department of Economic and Social Affairs, Population Division (2018). The World’s Cities in 2018 Data Booklet
2. Significant growth in Gross Domestic Product in a number of global cities
Three of the top 10 cities by Gross Domestic Product (GDP) in 2035 are expected to be in the US and four in China. London, Paris and Tokyo form the remaining three. Altogether, these top 10 cities will contribute $13.5 trillion in GDP by 2035. Clusters of such metropolitan areas are typically considered mega-regions which account for a large share of global economic activity.
The average annual GDP growth across cities is 2.6%. The highest top ten growth rates will all be in Asian cities – Bangalore at 8.5% is top of the rankings.
GDP growth % Change year over year

Infographic of the world showing Gross Domestic Product growth in cities.
Credit: Visual Capitalist
Source:
- These will be the most important cities by 2035, World Economic Forum blog, October 2019
3. England’s urban population is growing faster than the rural population
In England, both rural and urban areas have seen an increase in overall population between 2011 and 2019. Rural population increased by 5.2% and urban by 6.2%. Within rural areas, the greatest rate of population increase was in rural town and fringe areas (5.7%). Within urban areas it was in urban major conurbations (6.9%).
In 2019, 56.3 million people lived in urban areas (82.9% of England’s population) and 9.6 million in rural areas (17.1%).
Index of population change, England, 2011-2019, 2011 = 100

Infographic of index of population change from 99 to 107 over the time period 2011 to 2019. The green line represents rural populations, the red England and blue urban.
Source:
- Statistical Digest of Rural England Department for Environment, Food and Rural Affairs, February 2021
4. Population in England and Wales has increased more in cities than towns
Between 2001 and 2019, built-up areas in London were the fastest-growing places in population percentage terms. Inner London had the most significant growth rate of 27%, followed by Outer London with a growth rate of 19%.
The population in cities outside of London increased by 16% during the same period. While all cities outside of London experienced population growth, comparisons across cities reveal that the population growth was quite diverse. In Manchester, the population grew by 30% between 2001 and 2019, followed by Nottingham where the population grew by 25%. In contrast, the cities of Kingston upon Hull and Stoke-on-Trent recorded a population growth of just 4% and 6%, respectively.
Population growth, England and Wales, mid-2001 to mid-2019 (BUA = built up areas)
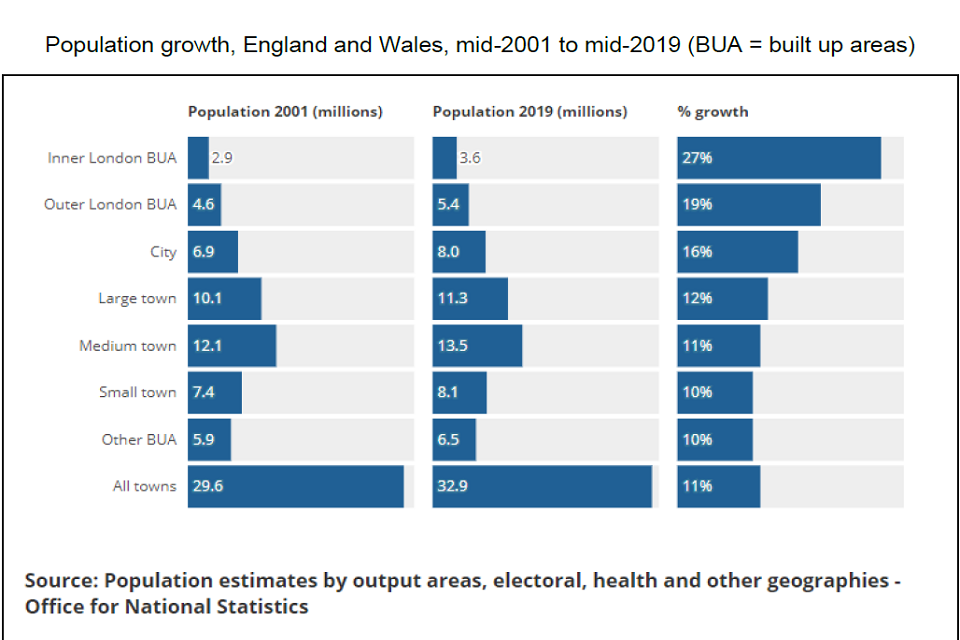
Bar charts of population in millions and percentage growth for different types of UK towns and cities.
Source:
- Understanding towns in England and Wales: population and demographic analysis, Office for National Statistics, February 2021
5. London’s contribution to England’s Gross Value Added is increasing
Urban areas contribute more to England’s Gross Value Added (GVA) than rural areas; this has been a consistent trend since 2001. London’s GVA has gradually risen since 2001.
In 2018, GVA from predominantly rural areas contributed 15.9% of England’s GVA, and was worth an estimated £261 billion. This compares with 45.6% from predominantly urban areas (£749 billion), 27.4% from London (£450 billion) and 11.2% from urban with significant rural areas (£184 billion).
Gross Value Added (GVA) by Local Authority Classification as a % of England GVA, 2001-2018
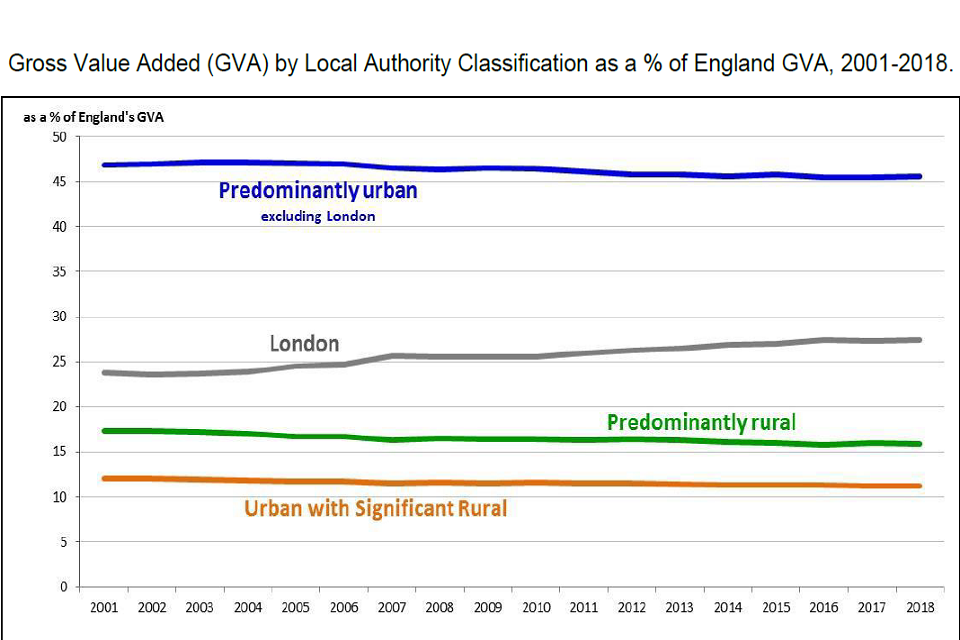
Line graph of percentage from 0 to 50 over the time period 2001 to 2018. The blue line is predominantly urban, grey refers to London, green predominantly rural and orange urban with significant rural.
Gross Value Added (GVA) measures the contribution to the economy of each individual producer, industry, or sector.
Source:
- Rural productivity and Gross Value Added (GVA), Department for Environment, Food and Rural Affairs and Office for National Statistics, January 2020
6. Strong population growth rates in city regions
In total 11 city regions had over 27 million residents in 2015, over 40% of the total UK population of 65 million. Population projections from 2015 to 2025 show city regions have a percentage growth rate of 7.6% compared to the UK growth rate of 6.7%.
Greater London, Bristol, the West Midlands and Edinburgh city regions all have higher projected population growth rates than the UK.
Projected population change (principal projections), mid-2015 to mid-2025
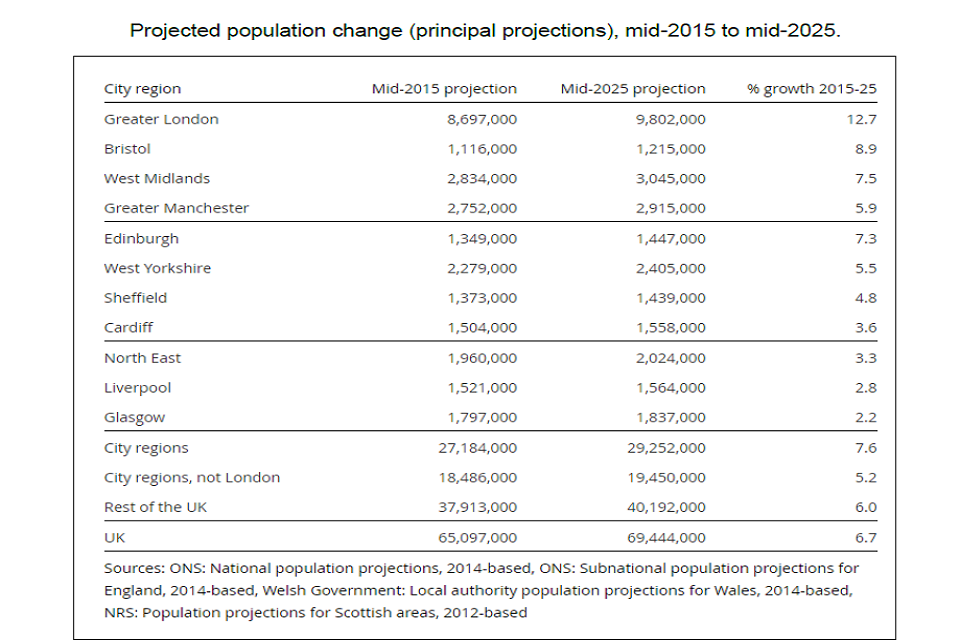
Table of city regions, projected population change and percentage growth between 2015 and 2025.
Source:
- Population dynamics of UK city regions since mid-2011, Office for National Statistics, October 2016
7. Small decrease in the area of Green Belt land in England
Allowing for overlaps, just over 40% of the area of England (5.6 million hectares) is protected against development by one or more environmentally-protected designations. The extent of the designated Green Belt in England, as at 31 March 2019, was estimated at around 12.4% of the land area of England.
Trends between 2013 and 2014 and 2018 and 2019 show a 1.1% loss of Green Belt land in England, this is partly due to local authorities adopting new plans in 2018 and 2019.
Extent of Green Belt as at 31 March 2019
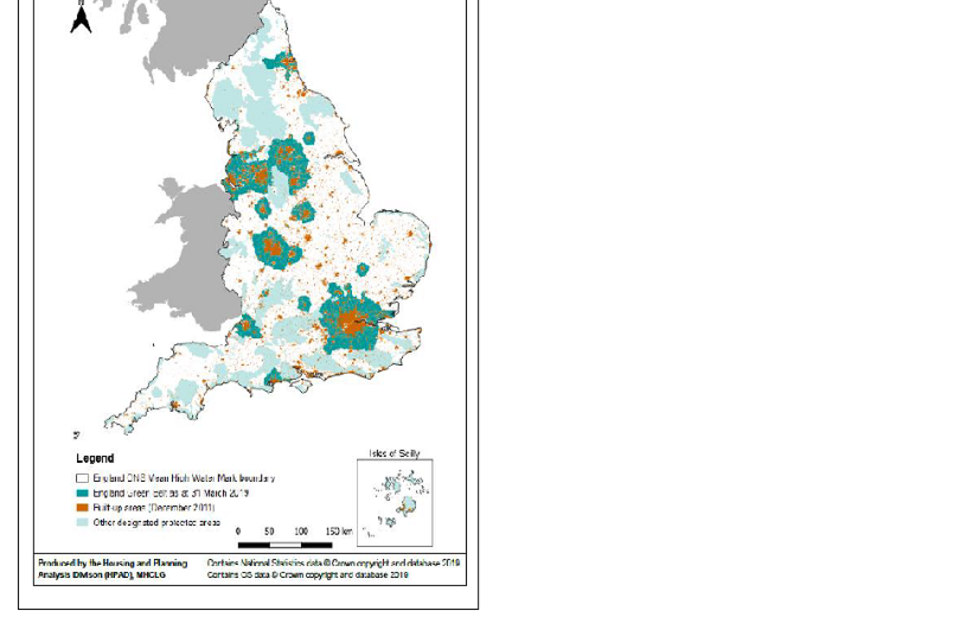
Map of England. Orange refers to built up areas, dark green is green belt and light green other designated protected areas.
Source:
- Local Planning Authority Green Belt: England 2018/19, Ministry of Housing, Communities and Local Government, October 2019
8. Agriculture continues to dominate land use in England by area
In 2018, 8.3% of land in England was of a developed use with 91.5% non-developed and 0.2% vacant (unclassified in terms of land use). The highest percentages of land use were agriculture (62.8%), forest, open land and water (21%) and residential gardens (4.8%).
The amount of land with developed use varies significantly by English region. London has the highest percentage of land in developed use at 39.6%. The South West has the lowest figure at 6.7%.
Land use in England 2018 by group as a proportion of total land use area
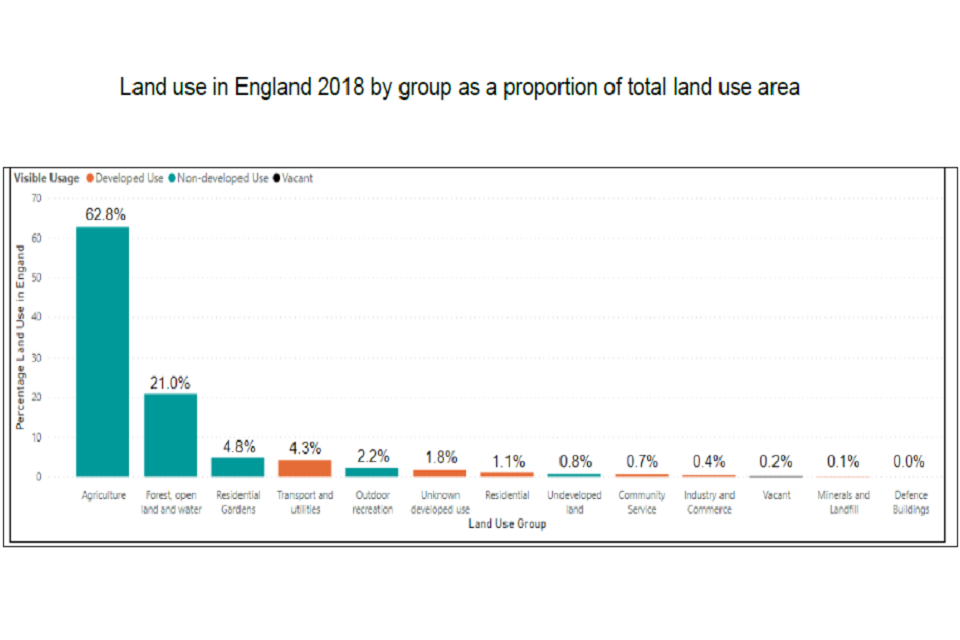
Bar graph of percentage from 0 to 70 for different land use types. Orange bars represent developed use, turquoise bars non-developed use and black vacant land.
Source:
- Land Use in England 2018, Ministry of Housing, Communities and Local Government, May 2019