Trend Deck 2021: Technology
Published 28 June 2021

© Crown copyright 2021
This publication is licensed under the terms of the Open Government Licence v3.0 except where otherwise stated. To view this licence, visit nationalarchives.gov.uk/doc/open-government-licence/version/3 or write to the Information Policy Team, The National Archives, Kew, London TW9 4DU, or email: psi@nationalarchives.gov.uk.
Where we have identified any third party copyright information you will need to obtain permission from the copyright holders concerned.
This publication is available at https://www.gov.uk/government/publications/trend-deck-2021-technology/trend-deck-2021-technology
1. Internet use is increasing globally but significant numbers still do not use the internet in the UK
Globally the number of internet users increased from 413 million in 2000 to over 3.4 billion in 2016. In 2017, countries such as the United States, Canada, Australia, Russia, Saudi Arabia, Argentina and much of Europe had more than two thirds of the population using the internet. Usage rates are much lower in developing nations. In parts of sub-Saharan Africa usage rates were below 10% in 2017.
13% of UK adults did not use the internet in 2019, unchanged since 2014. For those who do use the internet the coronavirus (COVID-19) pandemic led to online usage reaching a record high. In April 2020, internet users in the UK spent an average of 4 hours 2 minutes online each day.
The proportion of non-users of the internet is unchanged since 2014 in the UK. Older people and those in the DE socio-economic group (semi-skilled, unskilled manual occupations and unemployed) remain less likely to be online.
The proportion of non-users of the internet is unchanged since 2014; older people and those in the DE socio-economic group remain less likely to be online
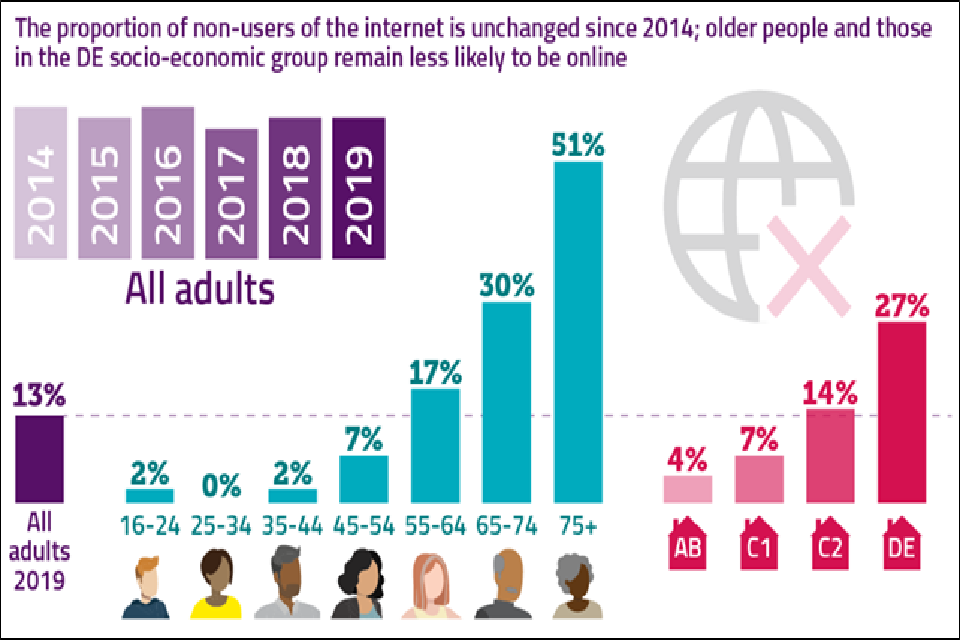
Infographic of percentage of adults over the time period 2014 to 2019 using the internet. The aqua bars refer to different age groups and the pink bars different socio-economic groupings.
Sources:
- Max Roser, Hannah Ritchie and Esteban Ortiz-Ospina (2015) “Internet“.
- Adults’ Media Use & Attitudes report 2020., Ofcom, June 2020.
- Online Nation 2020 Summary Report, Ofcom, June 2020.
2. Increase in government digital services
The provision of digital government services has improved significantly. More than 84% of countries now offer at least one online transactional service and the global average is 14.
The most common digital services offered worldwide are registering a new business, applying for a business licence, applying for a birth certificate, and paying for public utilities.
In terms of top performers, in digital or Electronic Government (E-Government) development, the UK ranks seventh in the 2020 UN E-Government survey.
Geographical distribution of the four E-Government Development Index (EDGI) groups, 2020
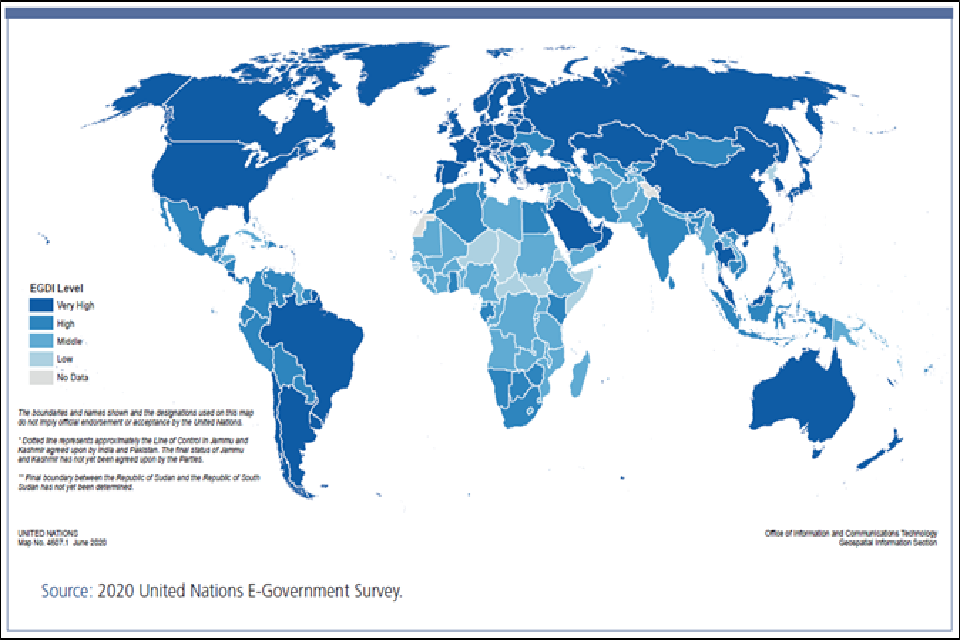
Map of the world showing the ranking of countries on the UN E-Government Development Index. The scale is from dark blue, very high on the Index to pale blue, low on the Index, grey is no data.
EGDI assesses national websites and how e-government policies, and strategies are applied in general and in specific sectors for delivery of essential services. The ranking is relative to other countries rather than being an absolute measurement.
Source:
1. UN E-government survey 2020, UN Department of Social and Economic Affairs ©2021 by United Nations.
3. Growth in digital identities to streamline services and combat fraud in the UK
Increasingly, people are required to prove their identity to access government services. Digital identities give the user control of their data. They provide clear audit trails and streamline how businesses and governments allow people to register and access their services, counteracting fraud. Figures from 2019 show a 32% rise in identity fraud in the UK over five years.
Reports show the digital identity market could add 3% to UK Gross Domestic Product by 2030
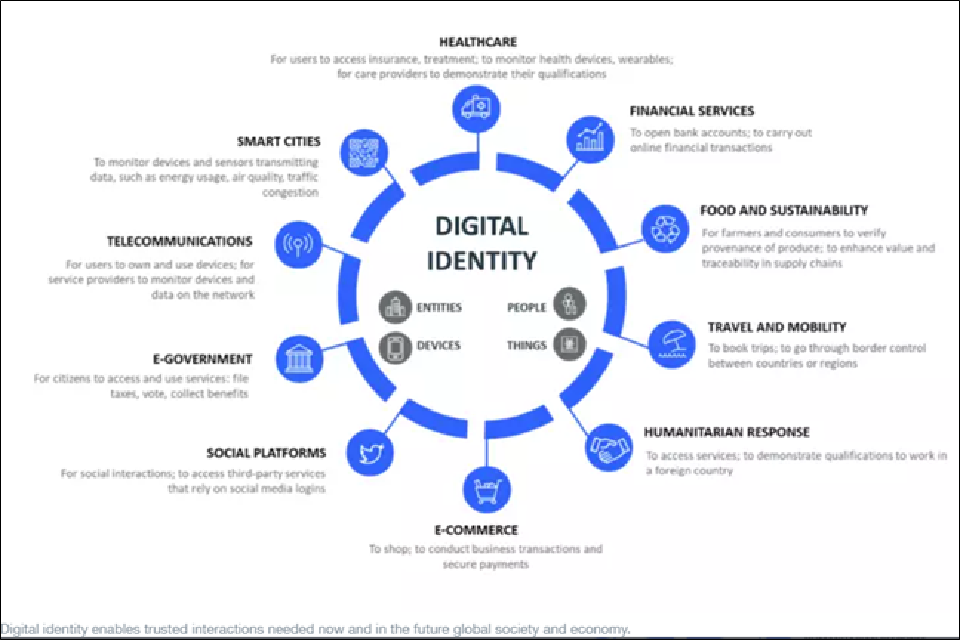
: Infographic showing the interactions between digital identity and healthcare, financial services, food and sustainability, travel and mobility, humanitarian response, e-commerce, social platforms, e-government, telecommunications and smart cities.
Sources:
- Next steps outlined for UK’s use of digital identity, Department for Digital, Media, Culture and Sport, September 2020.
- How digital identity can improve lives in a post-COVID-19 world, World Economic Forum, January 2021.
4. Growing number of Internet of Things connected devices in the UK
In its most basic form, the Internet of Things (IoT) connects devices through the internet to collect and share data. The number of IoT devices in the UK is projected to grow to over 150 million in 2024 from 13 million in 2006. Consumer wearables and the white goods market account for over 40% of all IoT connections. However, most of the projected future growth will be in the automotive, consumer electronics and utilities sectors.
Percentage of UK households with different types of internet-connected devices, 2020
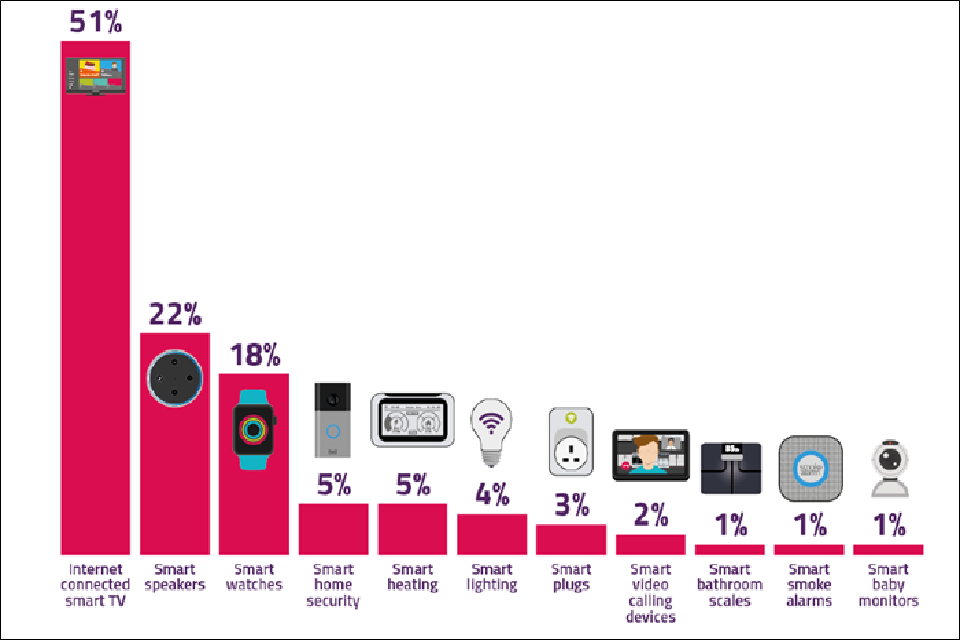
Bar graphs of percentage of UK households with 11 different types of devices, ranging from 1 to 51 per cent.
Source: Ofcom Technology Tracker, 2020
- Connected Nations Report 2017: Data analysis. Ofcom and Cambridge Consultants Ltd.
- Online Nation 2020 Summary Report, Ofcom, June 2020.
5. Increase in the number of wearable devices
Wearables are electronic devices which usually have smart sensors and are connected to the internet for data exchange. The number of connected wearable devices worldwide is expected to grow to over 1.1 billion in 2022. The most common wearable devices are smart watches and health and fitness trackers with ear-worn devices projected to become the most dominant category in the future. More than 270 million units of ear-worn devices are forecast to be shipped in 2023, more than any other wearable category. Wristwear (watches and wristbands) are projected to reach almost 180 million units by 2023.
Number of connected wearable devices worldwide from 2016 to 2022 (in millions)
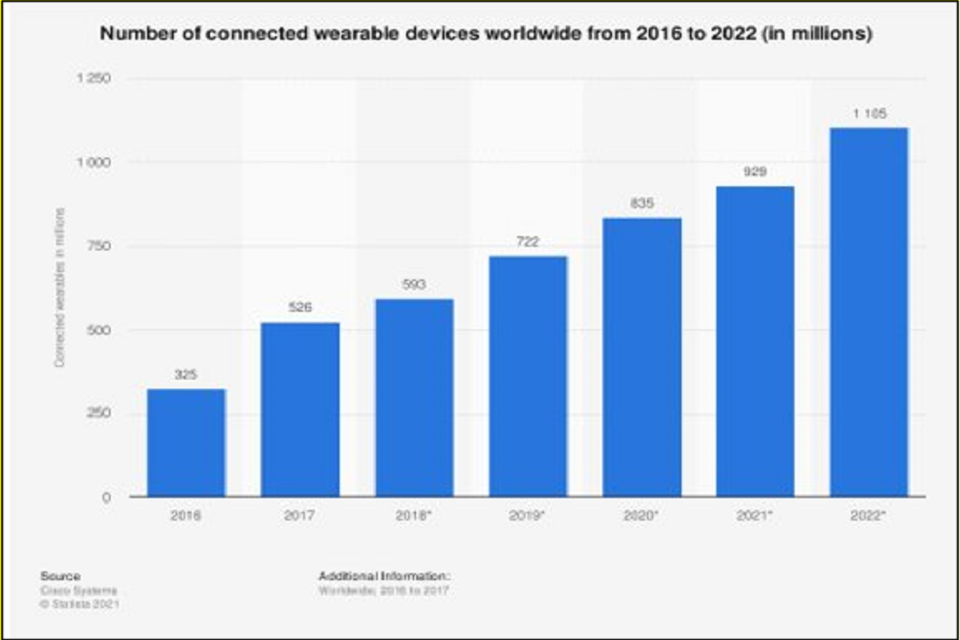
Bar graph of 0 to 1.25 million over the time period 2016 to 2022.
Source:
- Number of connected wearable devices worldwide from 2016 to 2022, Statista, January 2021.
6. Recent decline in fact checking of online content by UK internet users
Survey findings from 2019 show 10% of UK internet users do not consider the truthfulness of information they find online. A further 2% think all information online is truthful, 25% think most is and 59% show a greater degree of critical understanding, thinking that only some of it is truthful.
Internet users are less likely in 2019 than in 2018 to make checks on the factual information they find online. 29% do not make any checks on the information, up from 23% in 2018.
Similarly, social media users are less likely to check the information in articles they see on social media to establish its truth, 26% would not tend to check versus 18% in 2018.
Adults’ Media Use and Attitudes report, 2020
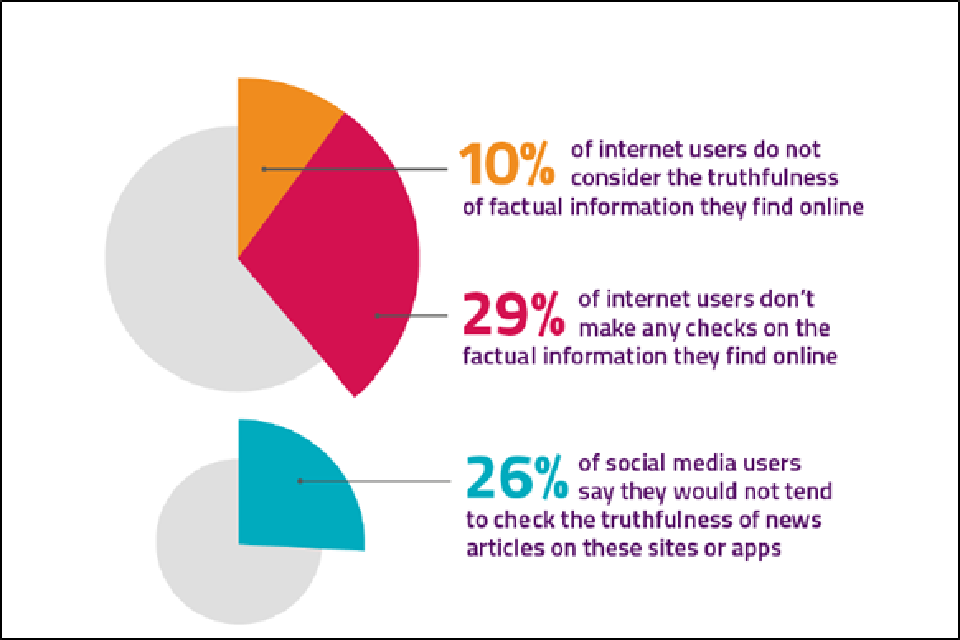
The red part 29% refers to checks on factual information by internet users, the yellow part 10% how many users don't consider the truthfulness of information and the blue 26% how many social media users don't check the truthfulness of articles.
Source:
7. Digital technologies could reshape the UK healthcare workforce
Digital medicine, artificial intelligence and robotics could significantly change the roles and functions of clinical staff by 2040, delivering improvements in patient care, labour productivity of healthcare staff and reduced costs.
Telemedicine (provision of clinical care using telecommunication and information technology), smartphone apps and wearable sensors are all examples of technologies likely to be routinely used. Progress towards this has accelerated during the coronavirus (COVID-19) pandemic, with 99% of England’s GP practices now activating remote consultation platforms.
Digital healthcare technologies and their projected impact on the NHS workforce from 2020 to 2040
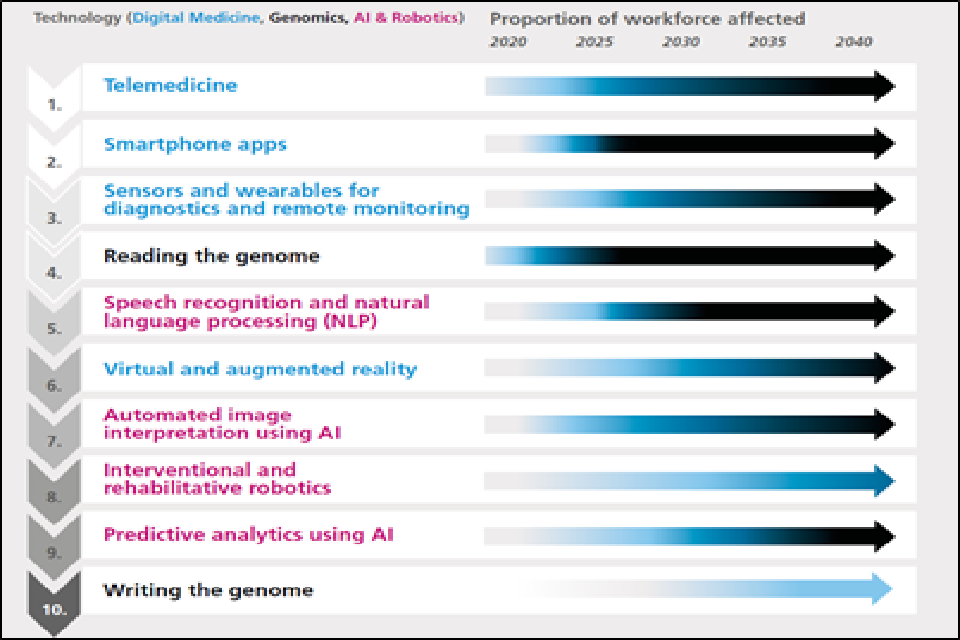
Arrow heat map of 10 technologies and how they could affect the health workforce to 2040. The darker the arrow the higher the perceived magnitude of impact. Blue text is digital medicine, black to genomics and pink to artificial intelligence and robotics.
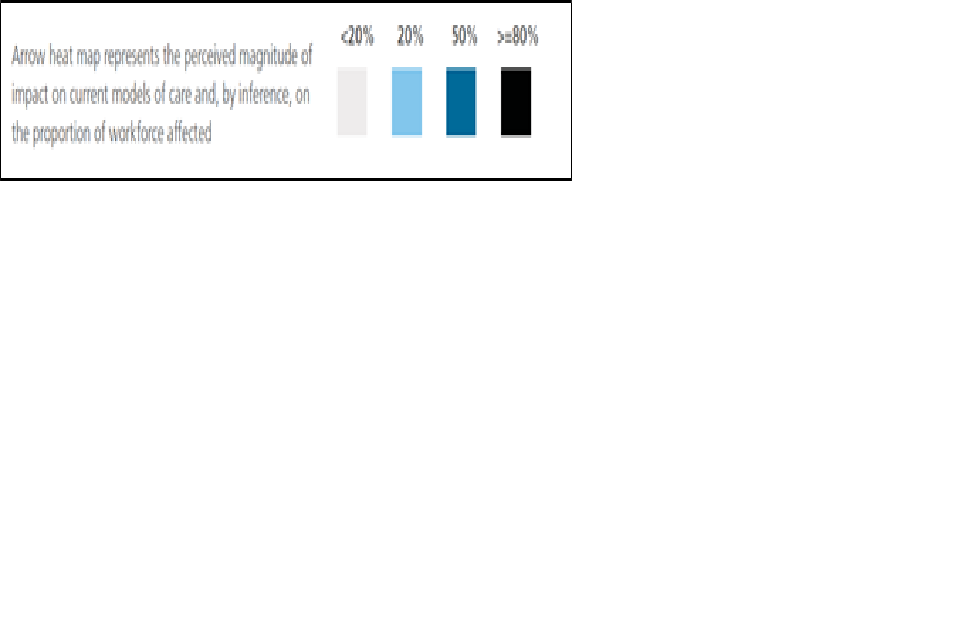
legend for the above image. grey is for less than 20 percent, light blue for 20 percent, dark blue for 50 percent and black for 80 percent or higher.
Source:
- The Topol Review, Preparing the healthcare workforce, NHS, February 2019.
- Millions of patients benefiting from remote consultations as family doctors respond to COVID-19, NHS England, May 2020.
8. Private sector is becoming more involved in space technology
More than 3,300 operational satellites are currently orbiting the Earth. Reduced costs and growing competition has seen an increasing number of commercial satellites reaching the Earth’s orbit.
Satellites owned by companies heavily outnumber those used by the military, which reflects a growing trend of the private sector becoming more involved in space technology. It is estimated, by Euroconsult, that an average of 990 satellites could be launched every year by 2028.
Satellites Skyrocket: past, present and future satellites launched
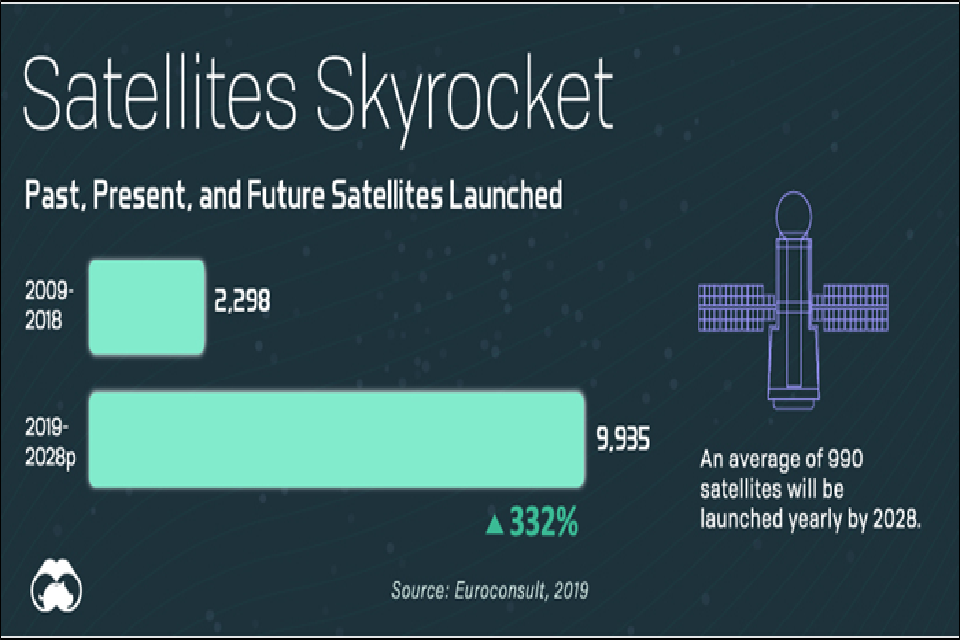
Infographic showing green bar charts for number of satellites launched in 2009 to 2019 and 2019 to 2028.
Image by Visual Capitalist
Sources:
- Union of Concerned Scientists Satellite Database.
- The countries with the most satellites in space, World Economic Forum.
- Who owns our orbit: Just how many satellites are there in space? World Economic Forum.
- Visualizing All of Earth’s Satellites: Who Owns Our Orbit?, Visual Capitalist, October 2020.
- Commercial space surveillance and tracking, Euroconsult for the UK Space Agency, March 2020.
9. Artificial Intelligence could make a significant contribution to the UK economy
Artificial Intelligence (AI) has the potential to offer massive gains in efficiency and performance to most or all industry sectors, from drug discovery to logistics. AI can be integrated into existing processes, improving them, scaling them, and reducing their costs by making or suggesting more accurate decisions through better use of information.
It has been estimated that AI could add an additional £630 billion to the UK economy by 2035, increasing the annual growth rate of Gross Value Added (the measure of the value of goods and services produced in an area, industry, or sector of an economy) from 2.5 to 3.9%.
While the majority of AI companies are based in London, there are a number of geographical clusters around the UK. The map, developed for the Open Data Institute and the Digital Catapult, illustrates clustering of activity in AI based on tech events, scientific publications, and data such as local skills, business start-up rates and research and development spending.
Growing the Artificial Intelligence Industry in the UK
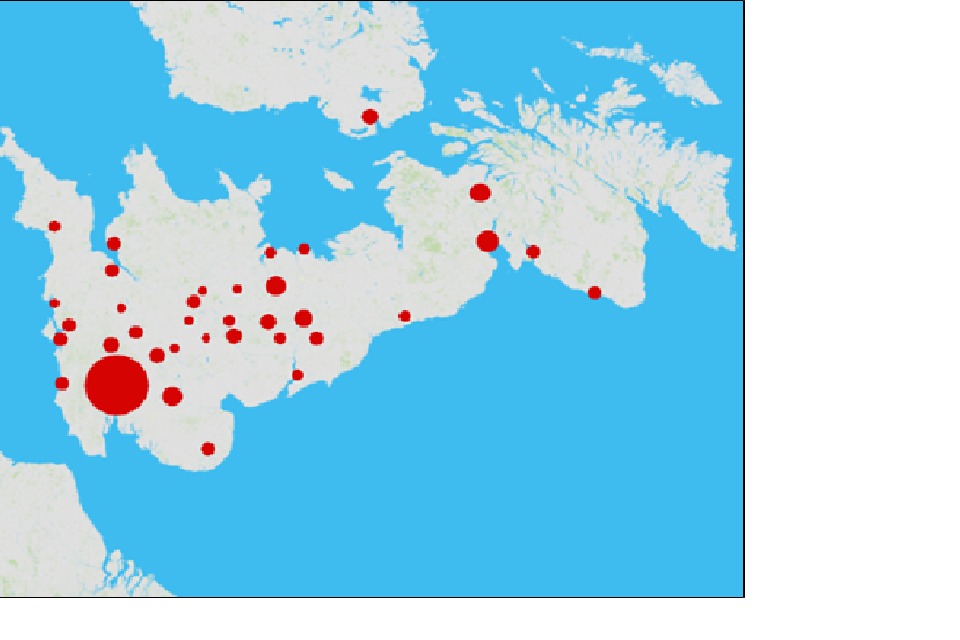
Map of the UK. The red circles show clusters of artificial intelligence companies. The bigger the circle the larger the cluster.
Source:
- Growing the Artificial Intelligence Industry in the UK, Department for Digital, Culture, Media and Sport and Department for Business, Energy and Industrial Strategy, October 2017.
10. Significant increase in global science and technology research and development expenditure
Total global science and technology research and development expenditures have risen substantially, expanding threefold between 2000 ($722 billion) and 2017 ($2.2 trillion). Global research and development activity remains concentrated in the United States, EU and the combination of East-Southeast and South Asia regions.
Across countries, regions, and economies, differential growth rates have led to shifting global research and development shares. Despite average annual growth in research and development spending of 4.3% in the United States and 5.1% in the EU between 2000 and 2017 global research and development shares declined for the United States (37% to 25%) and for the EU (25% to 20%). At the same time, the economies of China, Japan, Malaysia, Singapore, South Korea, Taiwan, and India increased their combined global share from 25% to 42%.
Average growth rate of domestic Research and Development expenditure, by selected region, country or economy: 2000 to 2017
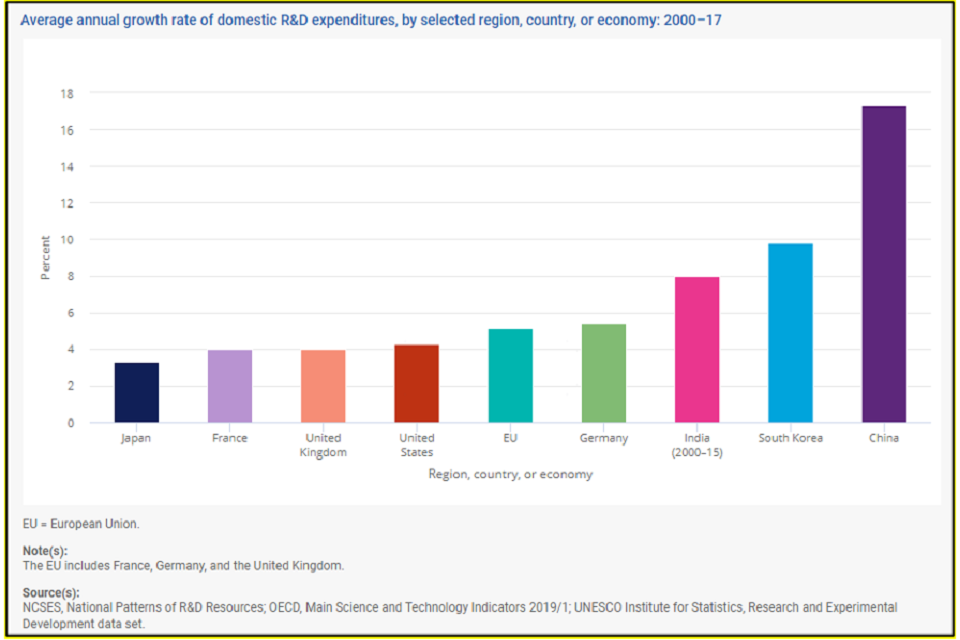
Bar graph of percentage annual growth rate from 0 to 18 for nine selected regions, countries or economies.
Sources:
- National Science Board, National Science Foundation. 2020. Science and Engineering Indicators 2020: The State of U.S. Science and Engineering. NSB-2020-1. Alexandria, VA.