Trend Deck 2021: Skills
Published 28 June 2021

© Crown copyright 2021
This publication is licensed under the terms of the Open Government Licence v3.0 except where otherwise stated. To view this licence, visit nationalarchives.gov.uk/doc/open-government-licence/version/3 or write to the Information Policy Team, The National Archives, Kew, London TW9 4DU, or email: psi@nationalarchives.gov.uk.
Where we have identified any third party copyright information you will need to obtain permission from the copyright holders concerned.
This publication is available at https://www.gov.uk/government/publications/trend-deck-2021-skills/trend-deck-2021-skills
1. Little change in the probability of jobs at risk of automation
In 2017, 7.4% (1.5 million) people were employed in jobs at high risk of automation (out of 19.9 million jobs analysed in England). This is 0.7% fewer when compared with 2011. When looking at those in jobs with a high risk of automation, women account for 70.2% of employees.
The number of employees that were in jobs at low risk of automation in 2017 was 5.5 million, equating to 27.7% of all employees, a rise of 2.4% since 2011.
Proportion of main jobs at risk of automation, England, 2011, 2014 and 2017
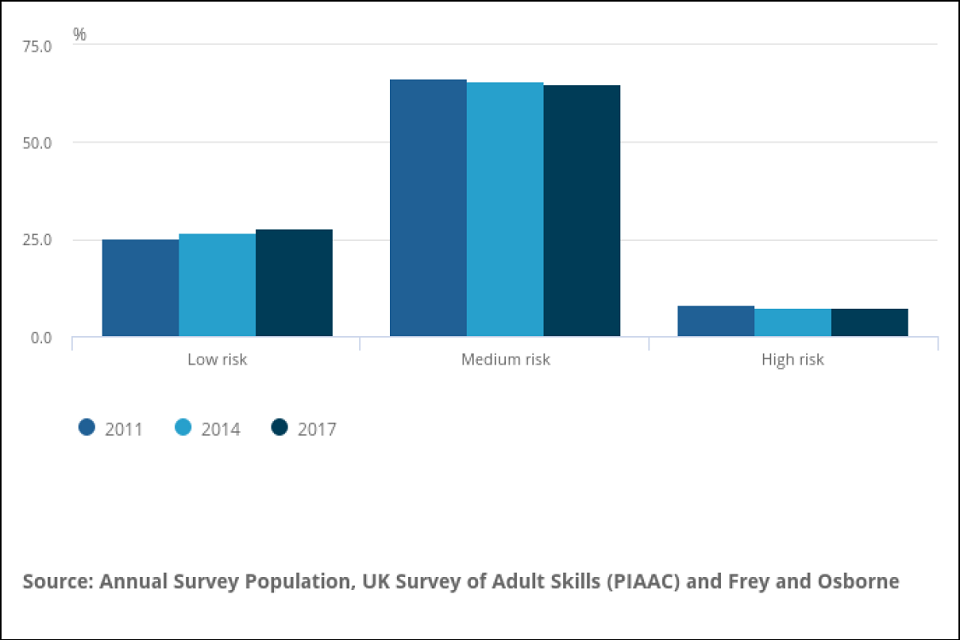
Bar graph of percentage from 0 to 75 over three time periods. Mid blue represents 2011, light blue 2014 and dark blue 2017.
Source:
- The probability of automation in England: 2011 and 2017, Office for National Statistics, March 2019
2. Decrease in apprenticeship starts in England
The number of apprenticeship starts fell after the introduction of a new funding system in May 2017. It fell again in 2019 and 2020 after a slight increase in 2018 and 2019 due to the impact of the coronavirus (COVID-19) pandemic. The pandemic and lockdown period had a disproportionate negative impact on apprenticeship starts for those aged under 19 and those starting an intermediate level apprenticeship.
There were 322,500 apprenticeship starts in 2019 and 2020, 70,900 less than in 2018 and 2019.
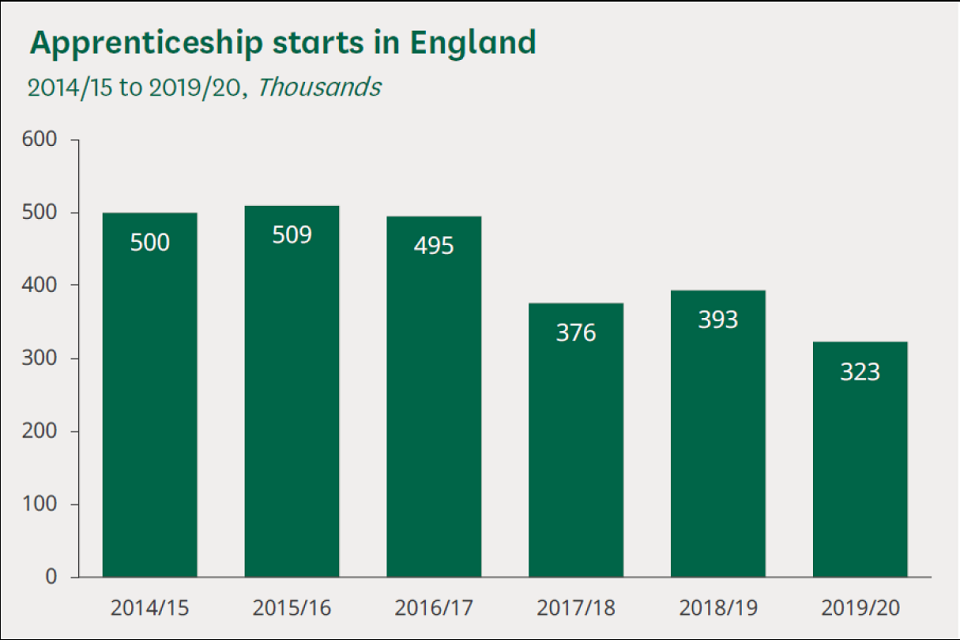
Bar graph of apprenticeship starts from 0 to 600 over the time period 2014/5 to 2019/20.
Source:
- Department for Education Apprenticeships and traineeships data, House of Commons Library Briefing Paper, March 2021
3. Participation in adult learning is declining
The 2019 Adult Participation in Learning Survey records the lowest participation rate in the 23-year history of the survey. It is the third year in a row in which the participation rate has fallen to a record low. One third (33%) of adults say that they have participated in learning during the previous three years, while 38% say that they have not done any learning since leaving full time education.
The coronavirus (COVID-19) lockdown in March 2020 accelerated the trend towards online learning. 22 million people (43%) across the UK took part in some form of ‘lockdown learning’. The participation rates varied considerably depending on when an adult had left school, whether they were employed and their socio-economic group.
Participation in learning, 1996 to 2019
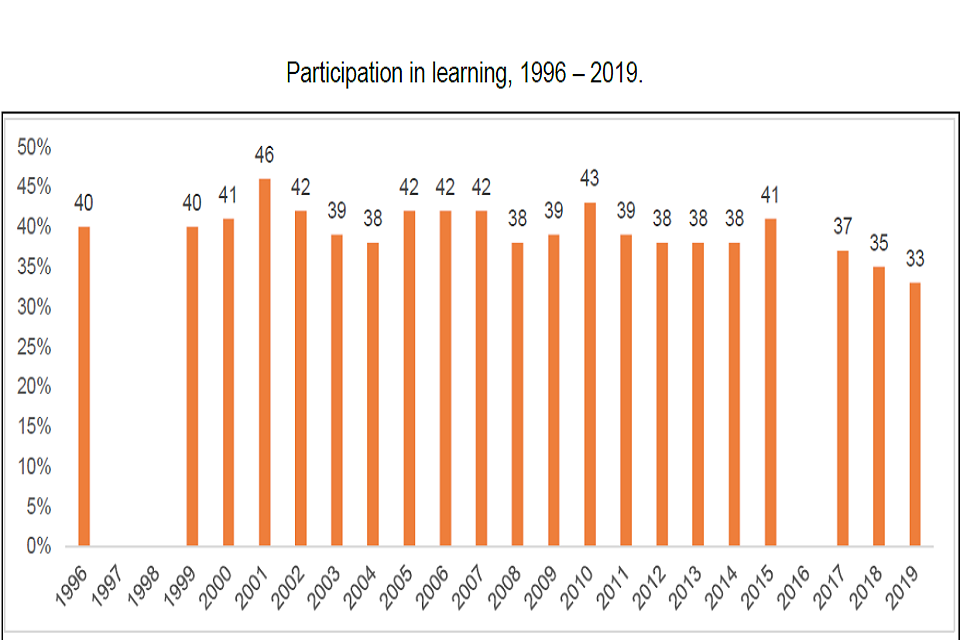
Bar chart of percentage from 0 to 50 over the time period 1996 to 2019.
Surveys were taken annually except in three years: 1997, 1998 and 2016.
Base: all respondents to each survey. Weighted base for 2019 = 5011. Unweighted base for 2019 = 5,314.
Sources:
- Adult Participation in Learning Survey 2019, Learning and Work Institute, December 2019
- Learning through lockdown, Findings from the 2020 Adult Participation in Learning Survey, Learning and Work Institute
4. Steady increase in first degree and taught postgraduate enrolments
First degree courses (leading to a bachelor’s qualification) remained the most popular type of higher education, as enrolments in other types of undergraduate courses such as foundation degrees, diplomas and vocational qualifications continued to fall, with a decline of 6% each year from 2017 and 2018 to 2019 and 2020.
Postgraduate taught courses saw an increase in first year student numbers in recent years, particularly in 2019 and 2020. The rise is largely due to an increase in enrolments from non-European students.
In 2019 and 2020 business and management attracted the highest number of students, with 16% of all students enrolling in this subject.
First year higher education student enrolments by level of study, academic years 2010 to 2011 and 2019 to 2020
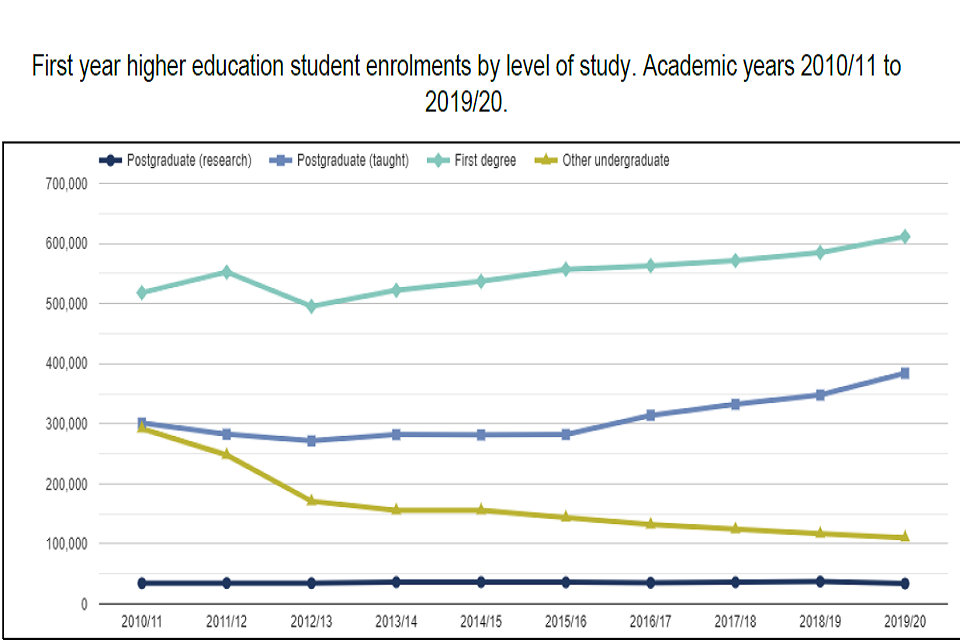
Line graph of student enrolments from 0 to 700,000 over the time period 2010/11 to 2019/20. The dark blue line represents postgraduate research, lime line other graduate, light blue line taught postgraduate and pale green line first degree.
Source:
- Higher Education Student Statistics: UK, 2019/20, Higher Education Statistics Agency, Statistical Bulletin, January 2021
5. Small increase in skill-shortage vacancies
Despite a fall in job vacancies between 2017 and 2019 (17% compared with 20%) more vacancies than at any point in the Employer Skills Survey series, since 2011, were proving hard to fill due to lack of qualifications, relevant skills or experience. Skill-shortage vacancies comprised nearly a quarter of all vacancies in 2019 (24% up from 22% in the 2013 to 2017 period).
Skilled trade roles have historically had the highest skill-shortage density (the proportion of vacancies which are skill-shortage vacancies). In 2019 density was highest in construction (36% the same as 2017) and manufacturing (36% up from 29% in 2017).
Number and density of skill-shortage vacancies (SSVs), by sector
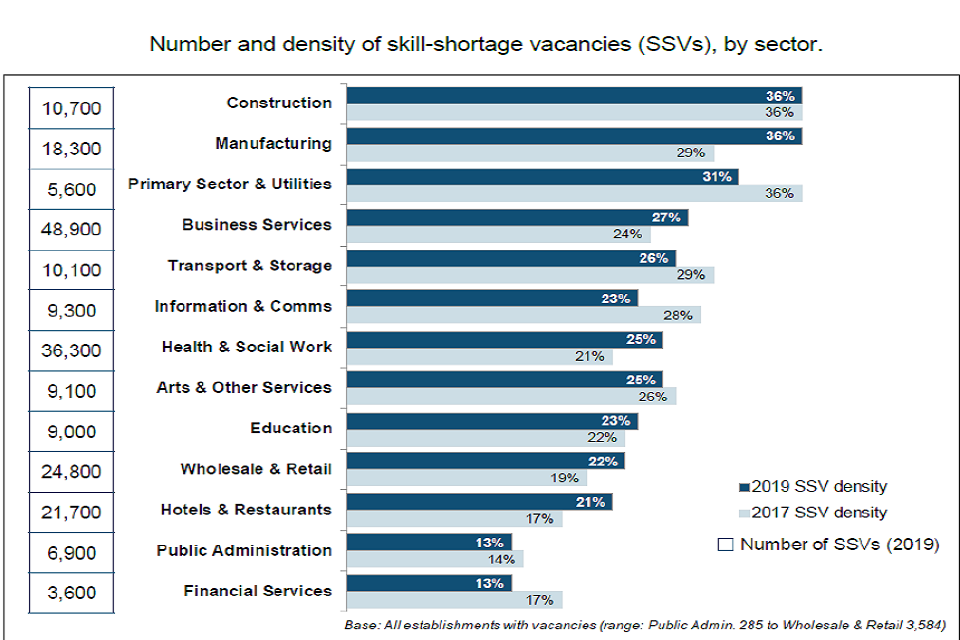
Bar chart of percentage of density of skills-shortage vacancies, by sector, in 2017 (light blue bars) and 2019 (dark blue bars).
Source:
- Employer Skills Survey 2019, Research Report, Department for Education, October 2020
6. Continued perception that levels of education are linked to family background
The higher an individual’s level of education, the more likely they are to believe that their family background has been helpful with their education. Nearly half (48%) of those with a high level of education feel that their background has been advantageous. This is 28% higher than those who achieved a low level of education.
Overall, people are most likely to say that their own background has had no advantages or disadvantages in terms of impacting on their career and education. However, a third (33%) say their background has given them advantages with their education, which is slightly down on the 2019 figure of 35%.
Thinking about your family background, do you think it gave you any advantages or disadvantages in your education?
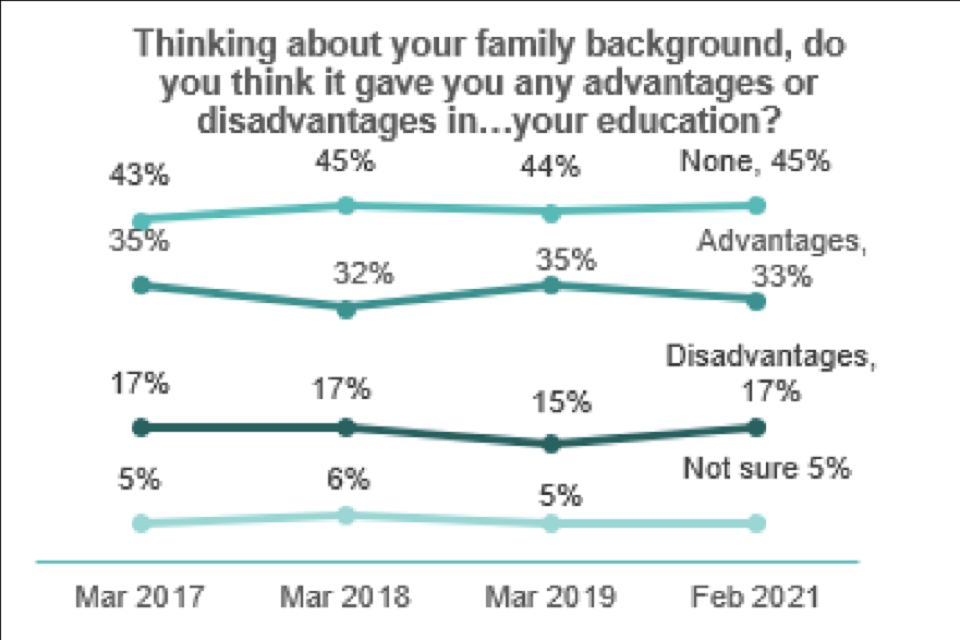
Line graph of percentage change over the time period March 2017 to February 2021.
Source:
- Public attitudes to social mobility in the UK, 2021, Social Mobility Commission, January 2021
7. Projected supply of skills differs from employer demand
Research conducted by the Learning and Work Institute estimated that by 2030 there could be 5.1 million low-skilled people chasing 2 million low-skilled jobs; 12.7 million people with intermediate skills chasing 9.5 million jobs; and 17.4 million high-skilled jobs with only 14.8 million high-skilled workers.
England potentially faces a deficit of high skills in 2030 amounting to around 2.5 million people if there is not an increase in qualification levels.
Projected composition of skills demand and supply in England, 2030
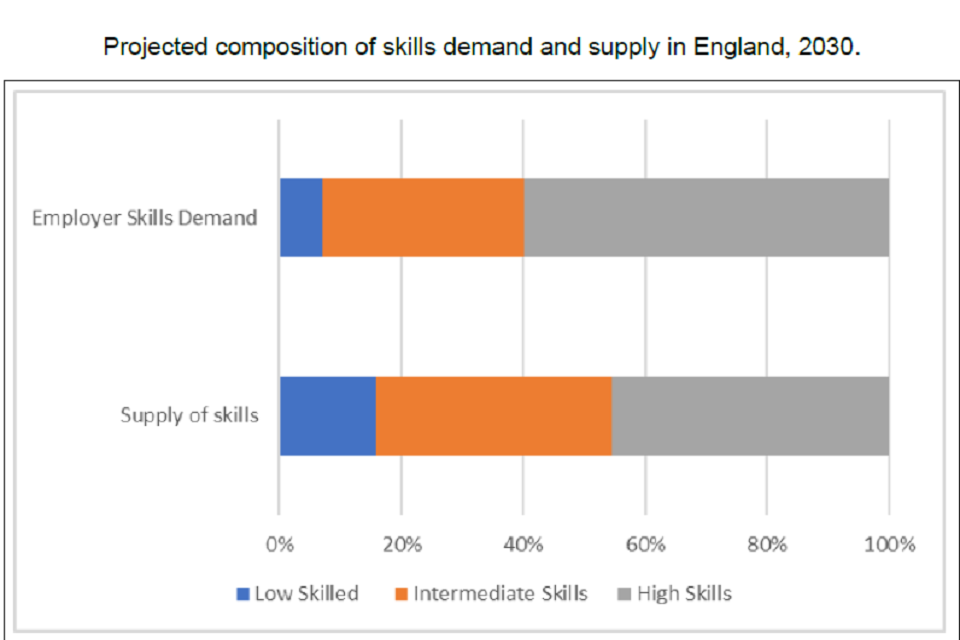
Bar graph of percentage from 0 to 100. Blue bars represent low skilled workers, orange bars intermediate skills and grey bars high skills.
The figure shows the difference between the composition of the projected employer demand for skills in England in 2030 and the skills we expect to be held by the population of working age in England in 2030 (labour supply).
The composition of the projected supply of skills for England does not match the expected shape of demand for skills for England in 2030. There are projected to be surpluses at both the low and intermediate levels, especially the former and a shortage of people with high skill levels.
Source:
- Local Skills Deficits and Spare Capacity, Learning and Work Institute, December 2019
8. Small increase in people overeducated for their job
Overeducation occurs when a person possesses more education than required for their job. In 2017, 16.1% of all those in employment aged 16 to 64 years were overeducated; the corresponding figure for graduates (with first degree or equivalent) was around 31%. From 2013, the overeducation rate began to rise reaching a peak of 16.3% in 2016.
51% of recent graduates in the arts and 50% in biological sciences were defined as overeducated for their jobs in 2017.
Percentage of those in employment defined as “overeducated”, 16 to 64 years, UK, 2006 to 2017
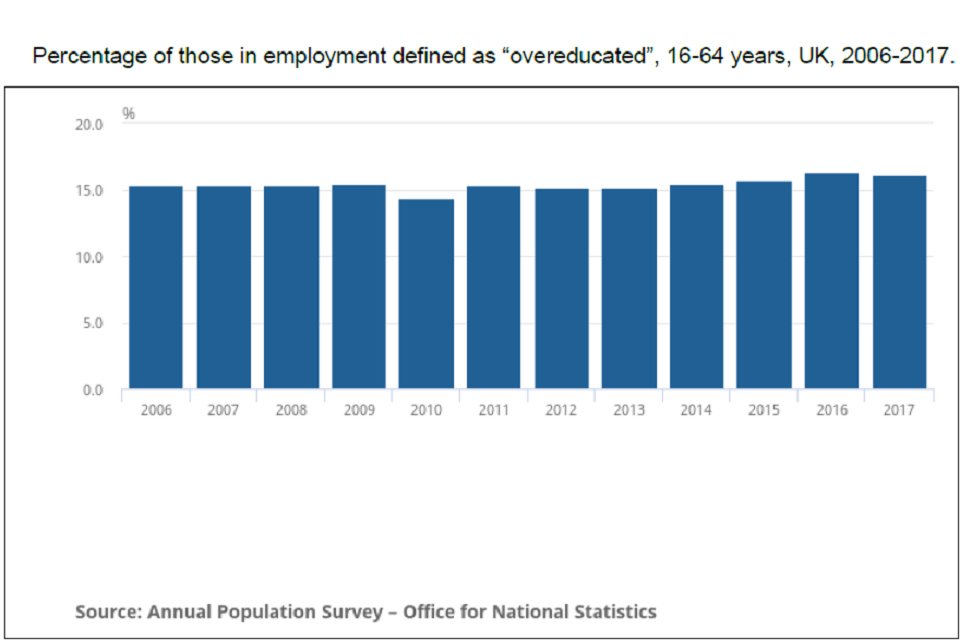
Bar chart of percentage from 0 to 20 over the time period 2006 to 2017.
Sources:
- Overeducation and hourly wages in the UK labour market; 2006 to 2017, Office for National Statistics, April 2019
9. Increasing number of degree level qualifications in the workforce
By 2027, 55.2% of people in employment are expected to be qualified at level 4 (degree level) and above, whilst the proportion of people with level 1 (GCSE, BTEC award, certificate and diploma 1) or no formal qualifications is expected to fall to 10.6%. The projections are based on a continuation of current educational trends and certain assumptions about how newly qualified people obtain and retain jobs. The average qualification level held is expected to rise within all occupations.
Qualification profile of workforce, 2007-2027
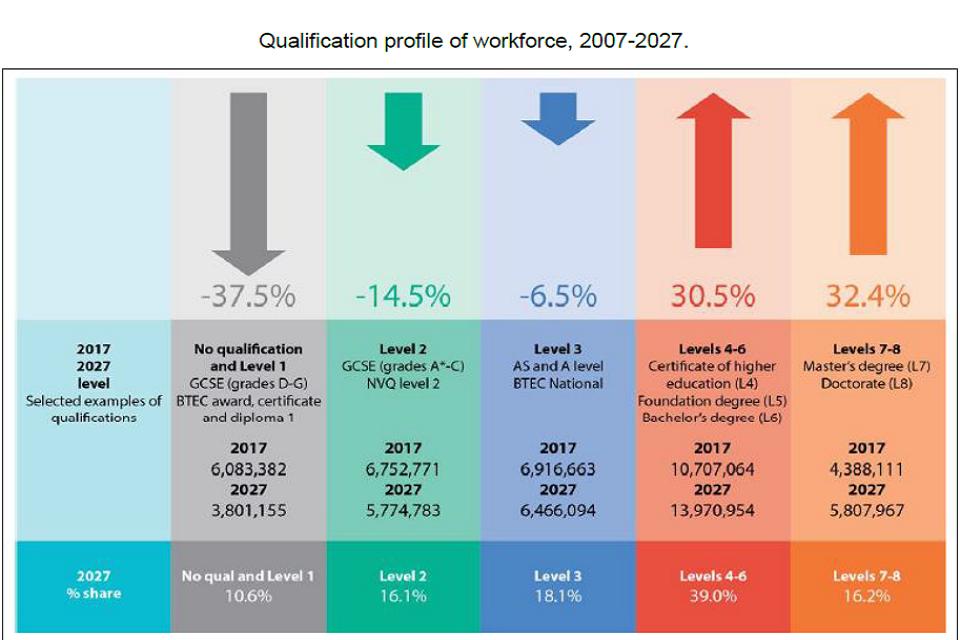
Infographic of percentage change and percentage share of different levels of education in 2027.
Source:
- Working Futures 2017-2027: Long-run labour market and skills projections Department for Education, February 2020
10. Postgraduates continue to have the highest high skilled employment rate
Although graduates and postgraduates had similar employment rates in 2019 a much larger share of postgraduates were in high skilled employment for both working-age (16 to 64) and young individuals (21 to 30 year-olds).
65.6% of working-age graduates were in high skilled employment in 2019, compared with 78.9% of postgraduates and 23.9% of non-graduates. This represents a slight increase of 0.2% since 2018 for graduates. The rise was larger for postgraduates at 2.4% and non-graduates at 1%.
Annual high skilled employment rates; 2007-2020
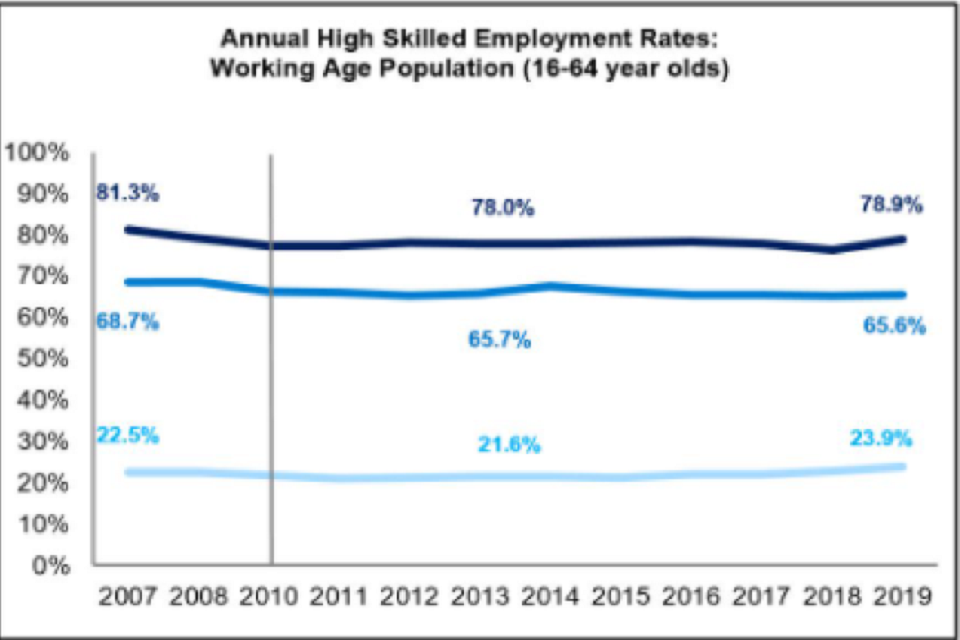
Line graph of percentage change from 0 to 100 over the time period 2007 to 2019. The light blue line refers to non-graduates, mid blue line graduates and dark blue line postgraduates.
Source:
- Graduate labour market statistics Reporting Year 2019, Government Statistics, May 2020