Trend Deck 2021: Governance and Law
Published 28 June 2021

© Crown copyright 2021
This publication is licensed under the terms of the Open Government Licence v3.0 except where otherwise stated. To view this licence, visit nationalarchives.gov.uk/doc/open-government-licence/version/3 or write to the Information Policy Team, The National Archives, Kew, London TW9 4DU, or email: psi@nationalarchives.gov.uk.
Where we have identified any third party copyright information you will need to obtain permission from the copyright holders concerned.
This publication is available at https://www.gov.uk/government/publications/trend-deck-2021-governance-and-law/trend-deck-2021-governance-and-law
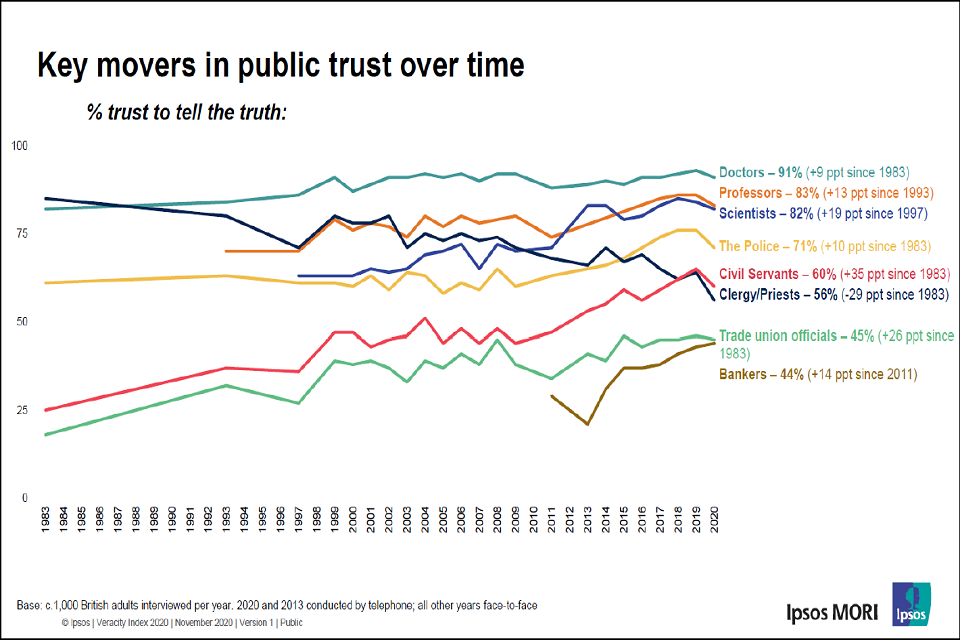
1. Increase in public trust greatest for civil servants, scientists, and Trade Union officials
The Ipsos MORI Veracity Index is the longest-running poll on trust in professions in Britain, having been asked consistently since 1983. Percentage trust to tell the truth has remained consistently highest for doctors and there have been significant increases for professors and scientists since the 1990s and for civil servants since the time series began. The biggest fall in public trust since 1983 has been for clergy or priests, but 56% of people in the 2020 survey still trusted them to tell the truth.
Age of respondent is an important factor. The biggest difference between 18 to 34 year-olds and those aged 65 and over is on trust in civil servants, where there is a 30% gap (73% and 43% respectively).
Key movers in public trust over time
Line graph of energy demand from 80 to 120 using an index where 2019 = 100 over the time period 2019 to 2030. The grey hashed line represents the pre crisis trajectory, blue line stated policies scenario and orange line delayed recovery scenario.
Sources:
- Veracity Index 2020, Trust in Professions Survey November 2020, Version 1, Public © Ipsos
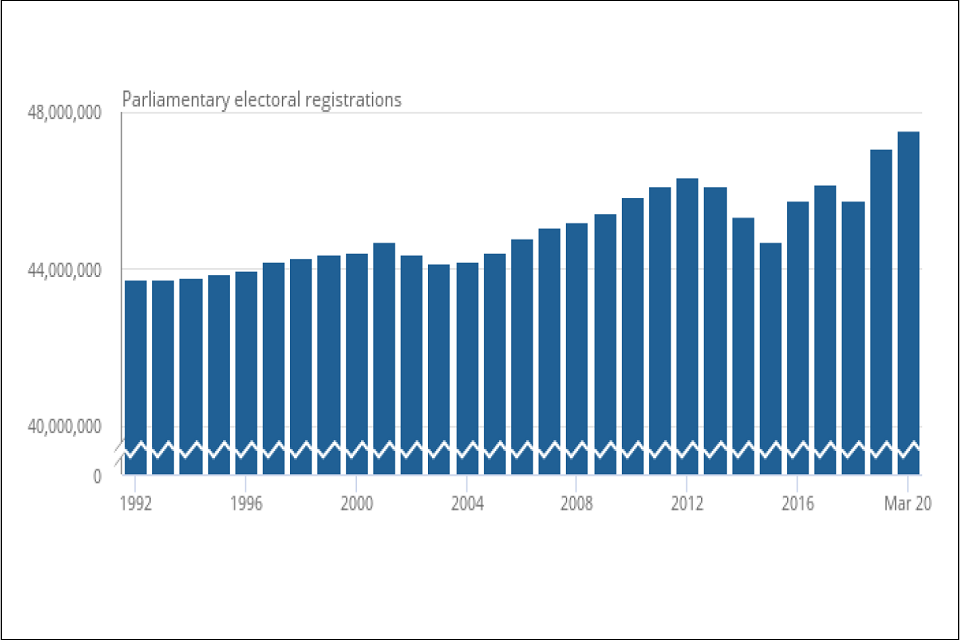
2. Increase in UK Parliamentary electoral registrations
As of 2 March 2020, there were 47.6 million Parliamentary electoral registrations in the UK, the highest number ever recorded.
The total number of UK Parliamentary electoral registrations increased by 484,000 (1%) between December 2019 and March 2020; this follows an increase of 1.3 million (2.8%) in the year to December 2019. These increases reflect the number of people eligible to vote and the impact of the 2019 general election in the UK.
Parliamentary electoral registrations, UK, 1992 to 2020
Bar graph from 0 to 48 million over the time period 1992 to March 2020.
Sources:
- Electoral statistics, UK: March 2020. Office for National Statistics, National Records of Scotland – Electoral Office for Northern Ireland, Office for National Statistics, January 2021
3. Perceptions of a large gap between social classes in the UK remain
79% of UK adults believe there is large gap between social classes in Britain, continuing a small upward trend from 2018 and 2019 (75% and 77% respectively). We are now at the same level that we were in 2017.
More people say that it’s becoming easier for the less advantaged sectors to move up in society – 23% agreed with this in 2021 compared with 18% in 2017. However, two-fifths (39%) think it’s getting harder (no change from 2019).
56% of UK adults think the coronavirus (COVID-19) pandemic has increased inequality in Britain: 33% say by ‘a lot’ and 23% by ‘a little’.
How large or small do you think the gap is between different social classes in Britain today?
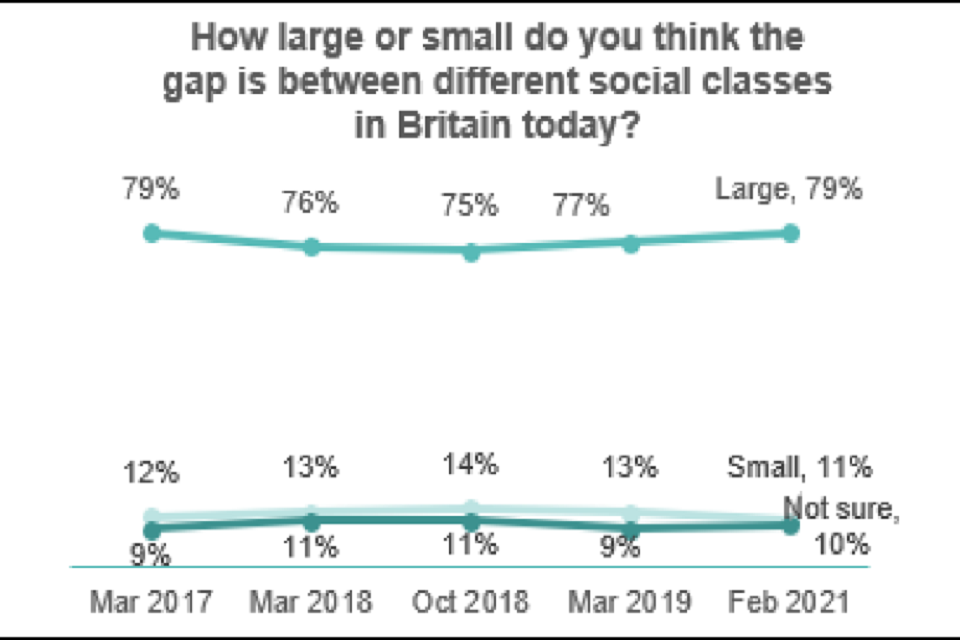
line diagram from March 2017 to February 2021 showing peoples answers to how large or small they think the gap is in social classes.
Generally speaking, do you think it becoming easier or harder for people from less advantaged backgrounds to move up in British society?
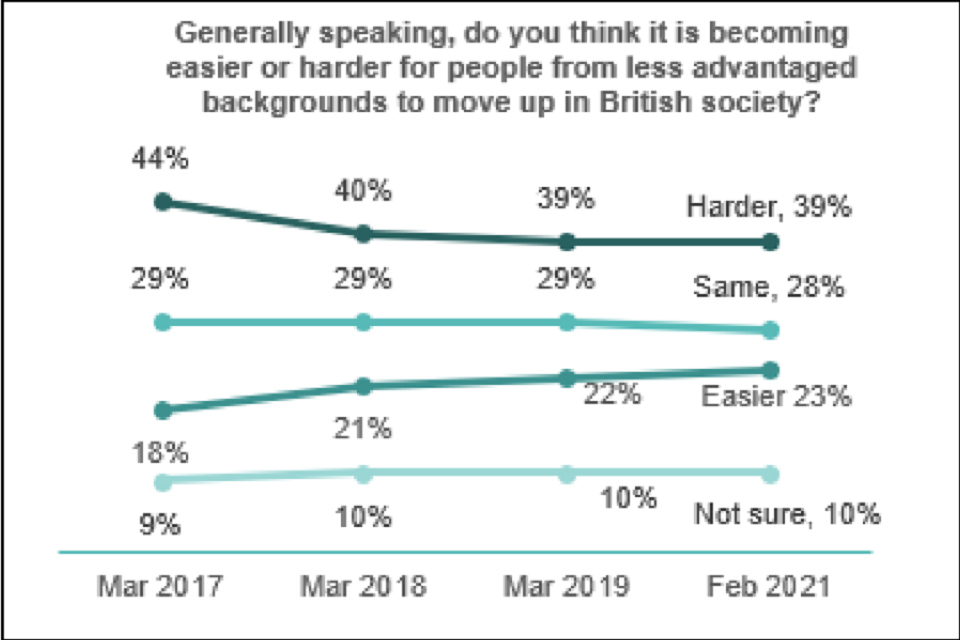
line diagram from March 2017 to February 2021 showing peoples answers to how easy or hard it is to move up in society from a less advantaged background.
Source:
- Social Mobility Barometer 2021, Social Mobility Commission, March 2021
4. More than half of the world’s population live in a democracy
Most countries in Europe and the Americas are now democracies. Some parts of Africa, especially in the West and the South, have democratised. So too have countries in Asia, with India being the world’s largest democracy. More than half the world’s population live in a democracy.
Political Regime, 2015
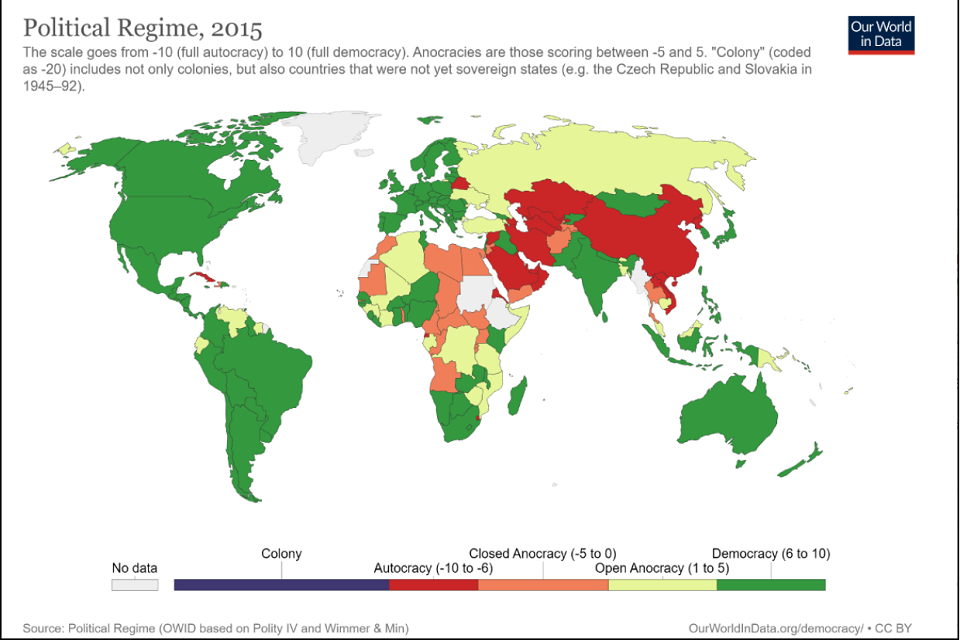
Map of the world showing countries with grey - no data, blue a colony, red an autocracy, orange a closed anocracy, yellow an open anocracy and green a democracy.
A democracy is a political system with institutions that allows citizens to express their political preferences, has constraints on the power of the executive, and provides a guarantee of civil liberties. In an autocracy, political preferences cannot be expressed, and citizens are not guaranteed civil liberties. Anocracies are regimes that fall in between - they are neither fully autocratic nor democratic.
Source:
- Max Roser (2013) - “Democracy”. Published online at OurWorldInData.org
5. Increase in armed global conflicts but with fewer reported deaths
The number of armed conflicts worldwide is on the rise, especially intra-state conflicts. At the same time, the number of lives lost due to armed conflicts has declined considerably over the past decades. More precise weapons allowing for more targeted attacks, better medical care and humanitarian aid, as well as fewer interstate conflicts (the deadliest type of conflict) have all contributed to a reduction in deaths.
Number of conflicts
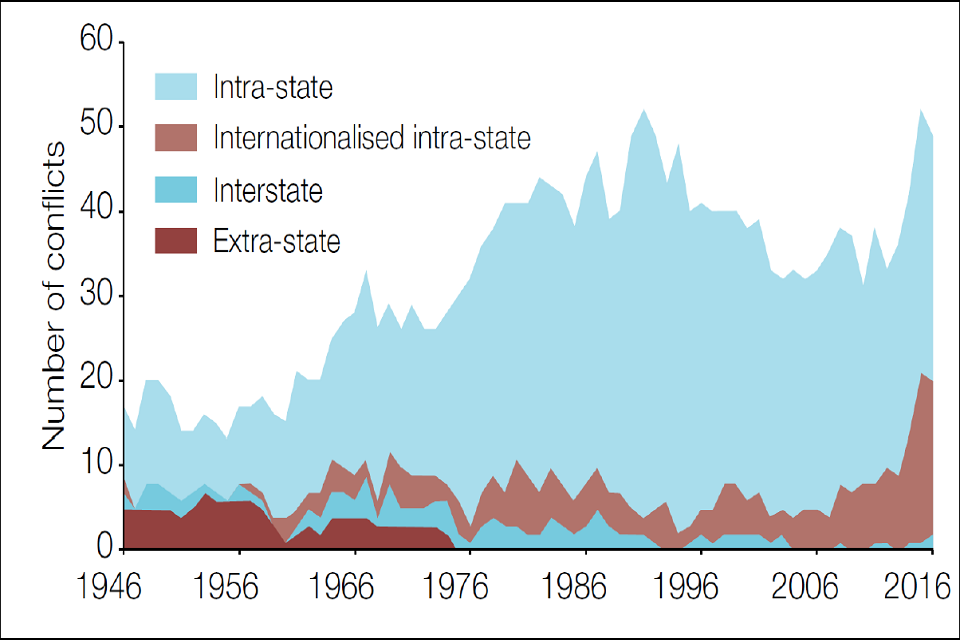
Chart of conflicts between 0 and 60 over the time period 1946 to 2016. Dark brown shows extra-state conflict, mid blue interstate, light brown internationalised intra-state and light blue intra-state.
Source: Uppsala Conflict data Program
Intra-state: between a government and non-governmental party.
Internationalised intra-state: between a government and a non-government party where one or both sides receive military support from other governments.
Interstate: between two or more governments.
Extra-state: between a state and non-state group outside its own territory.
Source:
- Global Strategic Trends - The Future Starts Today, Sixth Edition, Ministry of Defence, 2018
6. Decrease in deaths from global terrorism
In 2019 deaths from terrorism fell for the fifth consecutive year. The total number of deaths fell by 15.5% to 13,826. Conflict remains the primary driver of terrorism, with over 96% of deaths in 2019 occurring in countries already in conflict.
The fall in deaths was mirrored by a reduction in the impact of terrorism, with 103 countries recording an improvement on their Global Terrorism Index (GTI) score, compared to 35 that recorded a deterioration. The full GTI score takes into account not only deaths, but also incidents, injuries, and property damage from terrorism, over a five-year period.
The largest fall in the impact of terrorism occurred in Afghanistan, which recorded a 22.4 % decrease from the prior year. Afghanistan remains the country most impacted by terrorism, after overtaking Iraq in 2018.
Deaths from terrorism by country, 2019
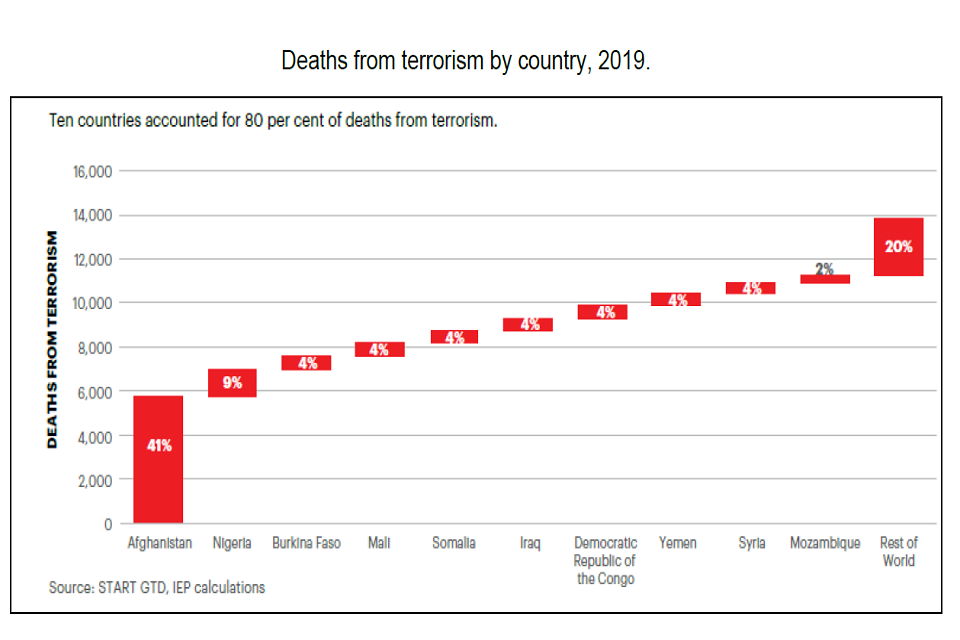
Bar graph of number of deaths from 0 to 16,000 for 10 countries and the rest of the world.
Source:
- Institute for Economics & Peace. Global Terrorism Index 2020: Measuring the Impact of Terrorism, Sydney, November 2020 accessed May 2021.
7. Decrease in number of arrests for terrorism-related activity in Great Britain
In the year ending 30 June 2020, there were 229 arrests for terrorist-related activity in Great Britain, 47 fewer than the previous 12-month period (a fall of 17%). This was the lowest number of arrests for terrorist-related activity in the last nine years and is below the annual average of 251 arrests over the time series 2002 to 2020.
Of those arrested in 2020, 76% considered themselves to be of British or British dual nationality, up seven percentage points on the previous year.
Arrests for terrorism-related activity, by legislation, in Great Britain, years ending 30 June 2002 to 30 June 2020
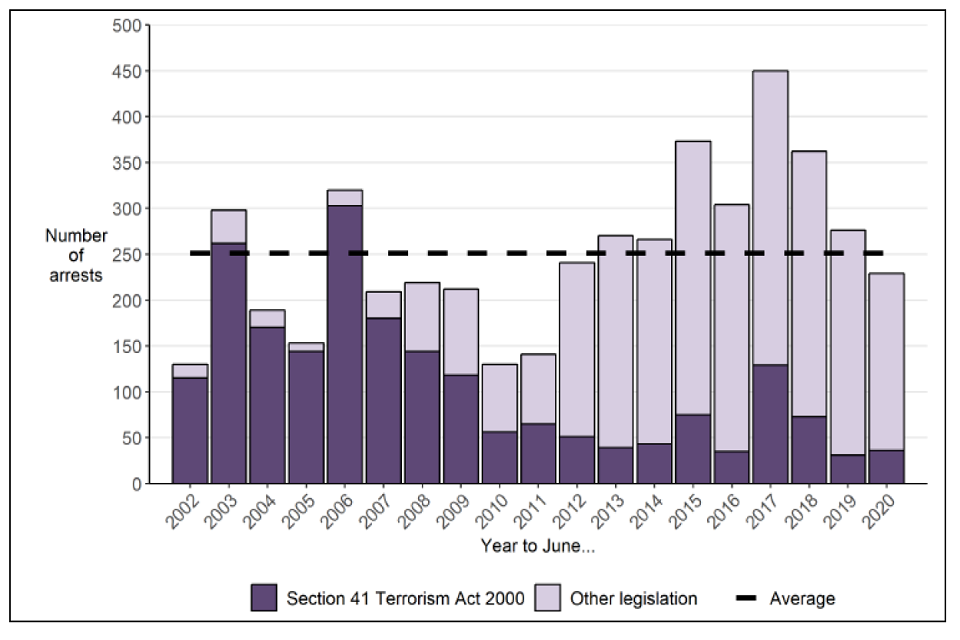
Bar graph of arrests from 0 to 500 over the time period 2002 to 2020. Purple bars are arrests under the Terrorism Act 2000, lilac bars other legislation.
Source: National Counter Terrorism Police Operations Centre
Source:
- Operation of police powers under the Terrorism Act 2000 and subsequent legislation: Arrests, outcomes, and stop and search Great Britain, year ending June 2020, Home Office.
8. Global power is moving towards the major emerging states
By 2040, the economic power of the E7 (China, India, Indonesia, Brazil, Russia, Mexico and Turkey) could be double the size of that of G7 (USA, UK, France, Germany, Japan, Canada, and Italy). The E7 was the same size as the G7 in 2015 and half the size in 1995.
By 2030 no country is likely to dominate globally in the way we have seen in the past. Enabled by communications technologies, a more fundamental shift may take place towards networks composed of state and non-state actors that will form to influence global policies.
A global power index, developed by the US National Intelligence Council, forecasts that the aggregate power of major emerging states overtakes that of developed states including the US by 2030. The share of global power held by the US, EU, Japan, and Russia decreases.
New Multi-Component Global Power Index Forecast
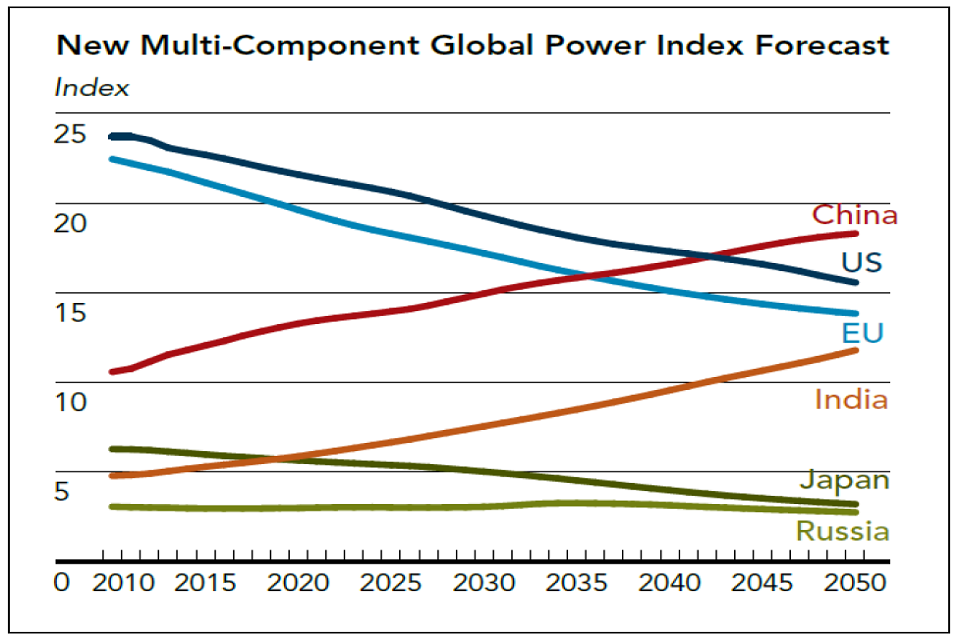
Line graph of a power index from 0 to 25 over the time period 2010 to 2050. Russia is shown as a light green line, Japan - dark green, India - orange, EU - light blue, US - dark blue and China a red line.
Source:
- Economic power shifts, European Commission
- Global Trends 2030: Alternative Worlds, National Intelligence Council, December 2012
9. Long-term falls in overall crime estimates in England and Wales
Since the mid-1990s, the Crime Survey for England and Wales has recorded long-term falls in overall crime estimates. The police recorded 5.7 million crimes in England and Wales in the 12-month period to year ending September 2020, a 6% decrease from the previous year. The annual decrease was driven by substantial falls during the April to June 2020 period. This reflects the increase in time people spent at home under national lockdown restrictions due to the coronavirus (COVID-19) pandemic.
Crime estimates by the Crime Survey for England and Wales (CSEW) December 1981 to March 2020, and Telephone Operated Crime Survey for England and Wales (TCSEW) estimates for the year ending September 2020.
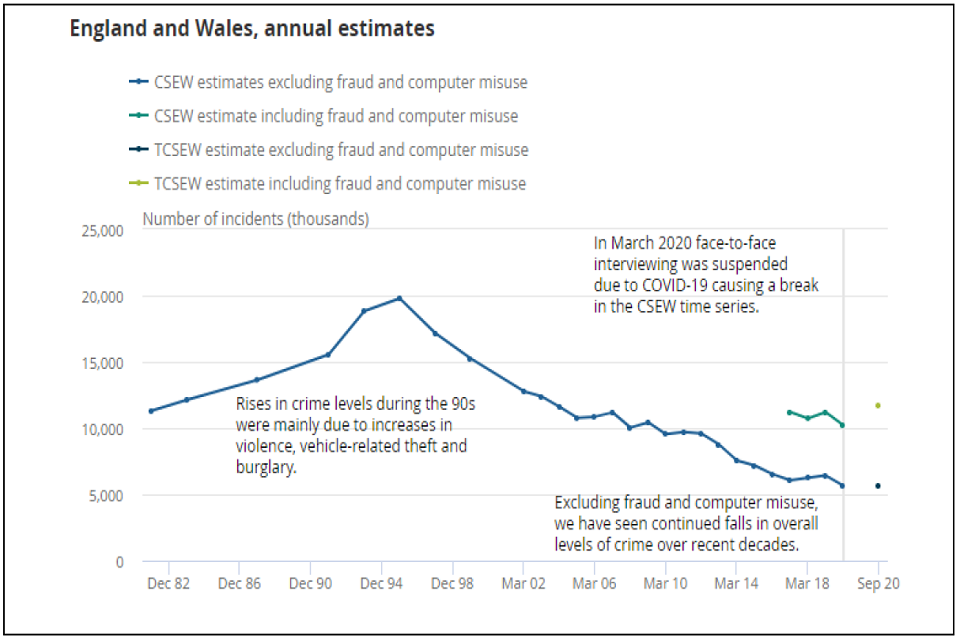
Line graph of crime estimates from 0 to 25,000 over the time period December 1982 to September 2020.
Source: Office for National Statistics - Crime Survey for England and Wales and the Telephone-operated Crime Survey for England and Wales.
Source:
- Crime in England and Wales: year ending September 2020, Office for National Statistics, February 2021
10. Increase in reported hate crime in England and Wales
There were 105,090 hate crimes recorded by the police in England and Wales in 2019 and 2020 (excluding Greater Manchester Police), an increase of 8% compared with the year ending March 2019. While increases over the last five years have been mainly driven by improvements in crime recording by the police, spikes in hate crime followed events such as the EU Referendum in 2016 and terrorist attacks in 2017.
As in previous years, the majority of hate crimes were race hate crimes, accounting for around three-quarters of offences (72%). The majority of hate crimes are public order or violence against the person offences.
Number of hate crimes recorded by police in England and Wales, 2012 to 2020
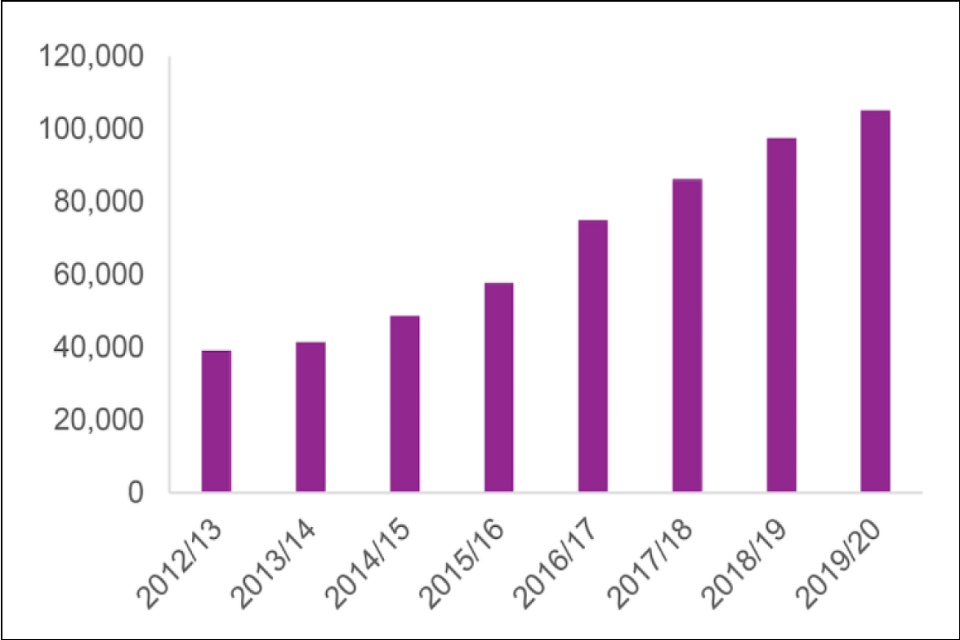
Bar graph of crimes from 0 to 120,000 over the time period 2012 to 2013 and 2019 to 2020.
Source:
- Hate crime, England and Wales, 2019 to 2020, Home Office, October 2020
11. Increasing reports of modern slavery in the UK
The true scale and cost of modern slavery is unknown. The Centre for Social Justice believes there could be at least 100,000 victims in the UK, with the actual number likely to be even greater. Since 2017, the number of suspected victims identified and referred to the National Referral Mechanism has more than doubled. There were 10,627 referrals in 2019 compared to 5,145 referrals in 2017.
The number of modern slavery crimes recorded by police forces in England and Wales in the year ending March 2017 was 2,306 compared to 5,144 modern slavery crimes recorded in the year ending March 2019 – a 123% increase.
Modern slavery recorded crimes 2016 to 2019
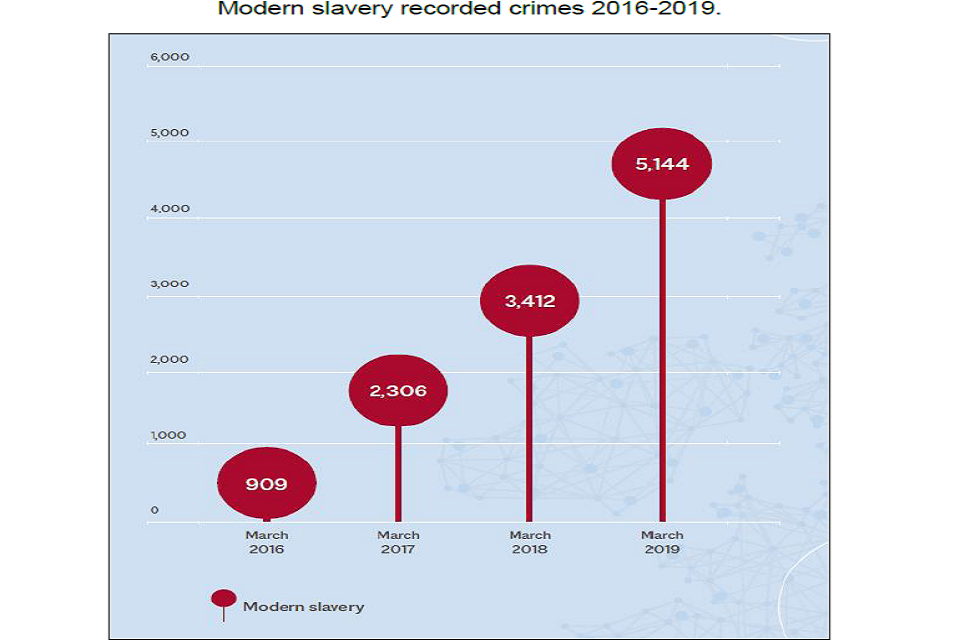
Infographic of recorded crimes from 0 to 6,000 over the time period March 2016 to March 2019.
Source:
- It still happens here: fighting UK slavery in the 2020s, Centre for Social Justice and Justice Care UK
12. Cyber attacks have evolved and become more frequent
Almost half of businesses (46%) and a quarter of charities (26%) report cyber security breaches or attacks in a 2019 to 2020 survey. Among the 46%, more are experiencing these issues at least once a week - 32% in 2020 compared to 22% in 2017. There is a similar pattern over time for charities, although the changes across years are not statistically significant. In 2020 a fifth of charities (22%) said they experienced breaches at least once a week.
The nature of cyber attacks has changed. There has been a rise in phishing attacks (from 72% to 86%) and a fall in viruses or other malware (from 33% to 16%).
Percentage that identify the following types of breaches or attacks as their most disruptive one, among the organisations that have identified breaches or attacks.
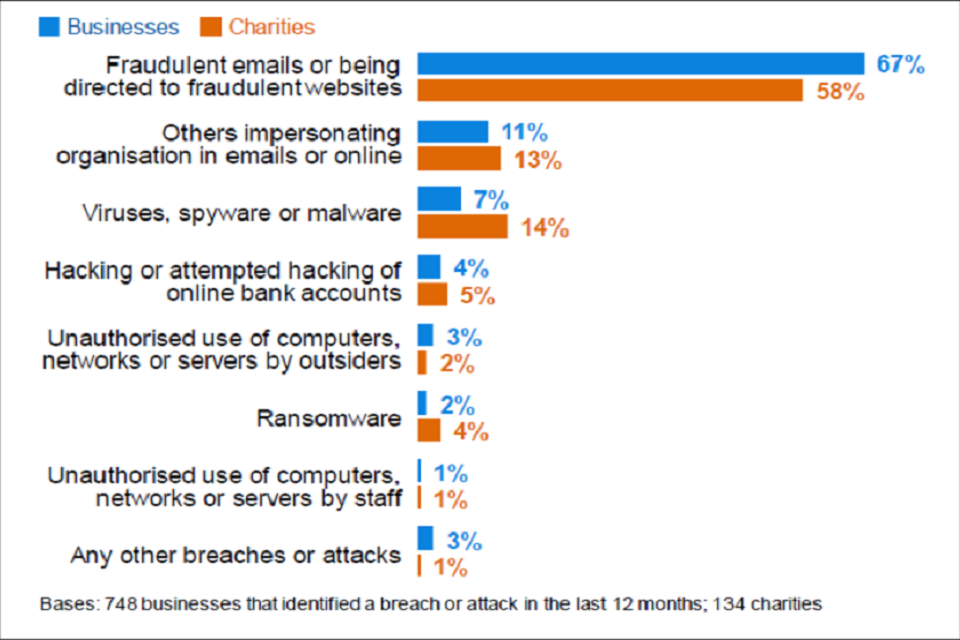
Bar chart of percentage of cyber attacks in 2019 to 2020. Blue bars represent business, orange bars charities.
Source:
- Cyber Security Breaches Survey 2020, Department for Digital, Culture, Media and Sport, March 2020
13. Prison populations are projected to increase in England and Wales
The prison population of England and Wales was 78,838 as of 20 November 2020. It is projected to increase in the short term to 83,200 by September 2021, then to keep increasing steadily to reach 98,700 offenders by September 2026.
The prison populations of adult males, females and children (age 15 to 17) are all expected to rise in the projections.
Total Prison Population Projection, September 2020 to September 2026

Line graph of prison population from 74,000 to 104,000 over the time period January 2018 to March 2026. The green line shows actual figures, the blue line projections from 2020 onwards.
Projections account for best available evidence, but there is considerable uncertainty around how the courts will recover from coronavirus (COVID-19) and the impact of additional police officers.
Source:
- Prison Population Projections 2020 to 2026, England and Wales, Ministry of Justice, November 2020