Segmentation of UK businesses: technical report
Published 14 July 2020

© Crown copyright 2020
This publication is licensed under the terms of the Open Government Licence v3.0 except where otherwise stated. To view this licence, visit nationalarchives.gov.uk/doc/open-government-licence/version/3 or write to the Information Policy Team, The National Archives, Kew, London TW9 4DU, or email: psi@nationalarchives.gov.uk.
Where we have identified any third party copyright information you will need to obtain permission from the copyright holders concerned.
This publication is available at https://www.gov.uk/government/publications/segmentation-of-uk-businesses-research/segmentation-of-uk-businesses-technical-report
1. Overview
This report outlines the process used to derive a segmentation of UK businesses, based on their current status as actual / potential exporters, their attitudes towards exporting and their capability /readiness to export.
1.1 Background
The objectives and priorities of DIT have been laid out on the HM Government Export Strategy. These include:
- Adopting a business-led approach for engaging with current and potential exporters based on characteristics and attitudes of businesses.
- Delivering value for money by applying a proportional approach to allocating export support with more dedicated support going to those with ‘high export potential’.
- Helping businesses address a range of practical barriers that are currently preventing them from reaching full export potential.
1.2 Aims of the segmentation
The overall purpose of this segmentation is to improve the efficacy of targeting, design and delivery of export promotion services to UK businesses.
It will do so through helping DIT to:
- increase the sustainable growth of UK exports through equipping and encouraging UK businesses to export
- identify what kind of support different business groups need to help them start exporting, or grow their exporting capacity
- target finite resources more effectively by prioritising business groups for whom such interventions are more likely to have a significant impact
1.3 Existing ways of grouping businesses
The existing survey data has been examined at each wave of analysis by several pre defined groupings, such as company sector and number of employees. In addition to these groupings based on company profiles, there are 4 key groups, based on current exporting behaviour which have been used throughout previous examination of the NSRB data
Rather than being identified through any complex analysis, these are defined directly from some key questions about current exporting status and product suitability.
These groupings are referred to as ‘main segments’ in this report.
The 4 main segments are as follows:
- sustain: current exporters, that is businesses which have exported goods or services in the past 12 months
- reassure: businesses which haven’t exported in the past 12 months, but which had exported previously
- promote: businesses which have never exported but which self-identify as having goods or services which could potentially be exported or developed for export
- challenge: businesses which have never exported and do not currently see their goods or services as suitable for export
In addition to these main segments some segmentation work had previously been conducted among the Promote main segment, using data from previous waves of the NSRB and a small set of variables covering attitudes towards exporting and current knowledge levels. This work had produced some useful output, in the form of 4 Promote sub-segments. This was one of the motivations suggesting potential value in proceeding with further segmentation analysis, within more of the main segments, using a wider set of variables and data from multiple waves of the NSRB to increase the sample size (see [annex A]).
2. Segmentation analysis
2.1 Sample definition
2.1.1 Data sources
All the data used for the segmentation analysis comes from existing surveys. No new data has been collected specifically for this analysis. The data is sourced from Waves 1, 2 and 3 of the National Survey of Registered Businesses (NSRB), conducted by Kantar Public.
Specifically, the surveys were as follows:
- Wave 1: 20 October to 6 November 2015
- Wave 2: 1 April to 4 May 2016
- Wave 3: 26 July to 7 September 2017
Details of the methodology used for each of these surveys can be found in the relevant technical reports. Therefore, this document does not cover these issues of data collection, sample structure, etc.. It focusses instead on how data from these surveys was selected and what processes were used to restructure and analyse it.
While the 3 individual surveys / NSRB waves are not identical, year to year, the majority of the topics relevant to this segmentation project do appear in all three waves. There are some differences in the way that certain questions have been asked. However, many of them and in particular most of the key questions, focussed on specific aspects of exporting, are the same in all 3 surveys.
Combining the data from the three waves offers the chance to compile a dataset of sufficient size to enable the examination of sub-segments within main segments. Analysing the data from one wave alone would not permit the desired level of detail for much of the analysis and would restrict the analysis to a more simplistic segmentation across the sample as a whole.
For this reason it was felt that a more useful analysis could be conducted by combining the data than could be achieved by focussing solely on the most recent wave of the NSRB. It does, however, place some restrictions on precisely what can be done.
2.1.2 Which businesses are included in the analysis
DIT focuses on supporting all business to export. However, not all business will need the same intensity and level of support. According to the ONS ‘UK business’ activity, size and location: 2017’, there are 2,668,810 registered businesses in the UK. SMEs account for over 99% of the registered business population. Of these, the clear majority are micro 0 to 9 employees (89.4% or 2,386,735 businesses), small businesses with 10 to 49 employees represent 8.7% or 231,715 businesses, and MSBs represent 1.5% – approx. 40,530 businesses. There are around 0.4% large businesses (250+ employees), approximately 9,830.
HMRC provides data on the value of goods exports. According to these figures, large businesses contribute the majority of the value of goods exports (55.8%), medium size business contribute 14.7% and micro and small businesses a combined value of 14.7%. This is consistent with the fact that as business get bigger they are increasingly able to cater for larger export contracts, owing to their larger size, resources and capabilities.
Table 1: Contribution to goods exports by business size (GB registered businesses exporting goods 2016) [footnote 1]
| Business size | Value of goods exports (£ millions) | % contribution by business size |
|---|---|---|
| Micro (0 to 9) | 18,766 | 6.2% |
| Small (10 to 49) | 25,739 | 8.5% |
| Medium (50 to 249) | 44,453 | 14.7% |
| Large (250+) | 169,038 | 55.8% |
| Unknown | 44,835 | 14.8% |
| Total | 302,832 | 100% |
DIT focuses on supporting all business. However, to increase the effectiveness in the way resources are utilised, it is vital to understand size. Turnover is a very good indicator and first segmentation key to start directing businesses to the right support and arrive at a proportional approach to service provision.
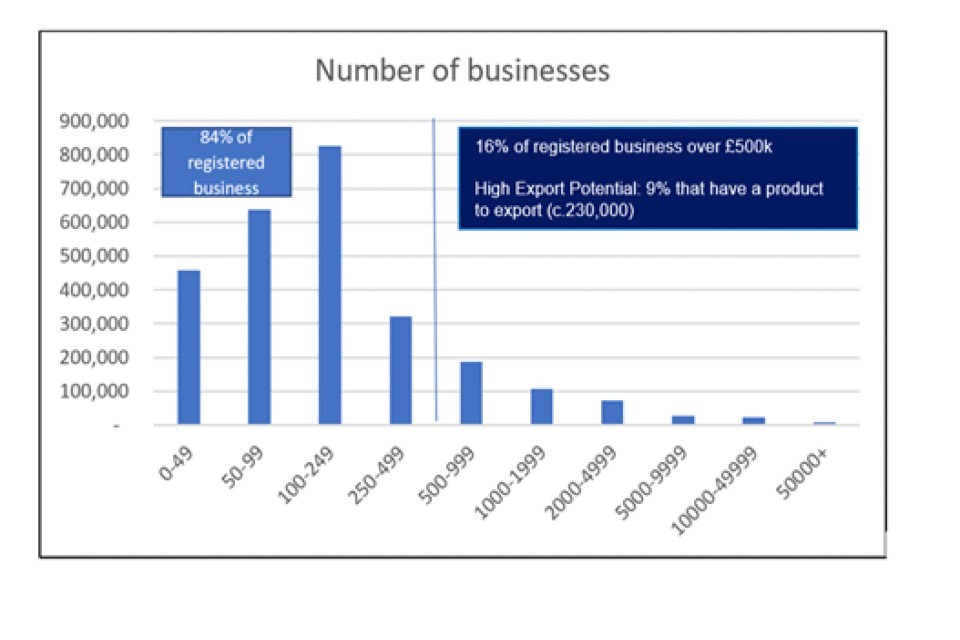
Therefore, a key focus in this report is the estimated 425,000 businesses over £500k turnover. These include micro, small, medium and large businesses representing the top layer of the business population and approximately 16% of the UK registered business population.
Having achieved £500k turnover, these businesses are of a scale where they have the potential to add significantly to the value of UK exports, but are not so large that they will always have already seriously looked into exporting.
Figure 1: The number of businesses by turnover (£’000s) threshold (histogram) [footnote 2]
The overall sample size of businesses across 3 waves is 4,514. This approach is in line with much of the work on each individual wave of the NSRB, including the previous reporting of the incidence of the main segments.
2.1.3 Combining content from different waves
The content of the questionnaire was somewhat different for each of the three waves of data collected. However, a large proportion of the variations are in the questions relating to advertising which need to be relevant to the time of the survey, and as such were not considered as potential inputs for the analysis. The majority of the key potential questions were present in all 3 waves and most were asked in a similar fashion. There are some differences and the way these are handled is considered in more detail in section 2.2.
2.1.4 Weighting the data
At the time of each individual wave of analysis and reporting, the data was weighted to balance the sample in terms of company size and turnover (to adjust, for example, for the fact that larger companies are overrepresented). While this principle has been preserved some modifications have been made when combining the data. This is to allow for 2 key aspects.
- the relative proportions of the main segments around which the analysis is based are slightly different by wave
- in the data cleaning process (in which some respondents with incomplete data have been removed), slightly disproportionate numbers have been removed from the different main segments, meaning that the final useable sample is not in the same proportions as the total sample of £500k+ businesses
This means that simply adding together the data with no adjustments results in main segments whose relative proportions are not an exact match for any previously published figures. As sizing any segments is an important step in the analysis, this difference could potentially be confusing, if the new detailed segments do not sum to the same main segment totals that were used previously.
To avoid such confusion, the data from the three waves has been reweighted such that the sizes of the main segments within the final total dataset match those reported in the most recent wave of analysis (specifically 35% Sustain, 7% Reassure, 12% Promote and 39% Challenge – with 7% unassigned to these 4 segments).[footnote 3]
Note that the sample size of wave 3 is approximately double that of waves 1 and 2. We have not rebalanced the sample in terms of the wave from which it is sourced. It was felt that the waves were relatively similar and that there was little impact on the total findings by having more respondents from wave 3, and the fact that this places additional emphasis on the more recent data in the total sample was viewed positively.
2.1.5 Which main segments are included in the analysis and final sample
The majority of questions relating to any detailed attitudes towards exporting are not asked of those in the Challenge main segment (that is those whose product is unsuitable for export). The additional segmentation work therefore concentrates on those in the other 3 main segments – Sustain, Reassure and Promote.
However, to enable accurate sizing of the segments those businesses in Challenge and those unassigned to a main segment, due to missing data, are still included within the total sample for reporting purposes.
2.1.6 Additional cleaning of the data
The majority of questions in the survey are answered by most respondents (if eligible to do so). However, a number of the key questions relating to exporting included a don’t know response, and a few respondents used this response option at a number of these key questions.
While it is possible to include a default answer for those who have chosen ‘don’t know’, it is not desirable to do this too often. If there is a lot of data missing either for a specific question, or many questions for any given respondent, including default answers too often risks degrading the quality of the final segments.
With regard to data cleaning, a set of 10 key variables was identified. These were ideal for inclusion in the segmentation, but did include don’t know response options. While the majority of respondents had answered all of these 10 key questions, there were over a third who had used at least one don’t know option. Removing all of these respondents would have a significant impact on the available sample. Further analysis of the number of such codes used by each individual suggested a noticeable difference between those who had answered most of the questions, with an occasional missing response and those who had many don’t know codes.
The decision was made to remove respondents who had replied ‘don’t know’ to more than 2 of these 10 key questions. This group accounted for about 11.5% of the original sample. This solution provided the best balance between data quality and sample size. Of those removed, over half had 8 or more out of 10 don’t know responses. As noted previously, the sample weighting was adjusted after this cleaning process, so that the removal of some respondents did not impact on the proportions of the main segments within the total dataset.
2.1.7 Summary of the final sample used
After removing businesses which do not fit the selection criteria based on their profile or the completeness of their responses, the final sample can be summarised as having the following composition:
54% have a turnover of £500k+, have complete or near complete data and have either exported or have a product suitable for export. These businesses are included in the segmentation analysis and include:
- 35% Sustain: current exporters, that is businesses which have exported goods or services in the past 12 months
- 7% Reassure: businesses which haven’t exported in the past 12 months, but which had exported previously
- 12% Promote: businesses which have never exported but which self-identify as having goods or services which could potentially be exported or developed for export
46% have a turnover of £500k+, but do not fall into one of the 3 segments above (that is have not exported or do not have suitable products). These businesses are not included in the segmentation analysis although they are included in the total sample figures reported.
They include:
- 39% Challenge: businesses which have never exported and do not currently see their goods or services as suitable for export
- 7% businesses unassigned to a main segment (due to missing response data)
2.2 Selecting the segmentation inputs
2.2.1 Identifying the variables to use
A number of topics were covered in the individual waves of the NSRB. While most of these were in some way connected with exporting, not all were ideal for inclusion in the segmentation. A number of criteria were taken into consideration when selecting which variables to include in the analysis
-
they should be relevant and genuinely connected with exporting. While most of the questions relate to exporting in some way, some are included more for the purposes of profiling exporters and understanding exporting in the light of other criteria, rather than because they are directly related to exporting. For this reason, many of the basic company profiling variables, such as size, are not included in the segmentation, whereas some of the more detailed company profiling, such as management capabilities, which can affect the ability to export are included
-
they should be answered by all respondents. If too many respondents have not answered a question then it is generally better not to include it in the segmentation. While we can include default responses for missing data, as noted previously, this should not be done too often or for too many respondents. This approach would typically suggest the exclusion of any questions which are routed, or dependent on other responses, resulting in large numbers not answering them. Additionally, consideration needs to be given to any questions which differ across the 3 waves of data and whether including these, at the expense of sample size, is acceptable
-
they should show clear differences between businesses. If variables do not allow us to identify differences between respondents, then they are of little value in the segmentation. This could happen if almost all respondents give the same answer to a question, for example. While there are one or two scales where a majority of respondents have agreed on the same answer, most show a good spread of responses. Lack of differentiation was more of an issue with regard to some of the questions that required the respondent to make a selection from a long list of answer codes. In some cases, there were many codes with very few responses, and a few codes that were selected by many respondents. These were generally felt to be unsuitable for use in their raw state, although some were recoded, so that the combined response codes were of greater value to the segmentation
Some variables which were of interest or relevance to the purpose of the segmentation, but were not ideal for inclusion in the segmentation process itself, were retained for profiling the segments once they had been created.
2.2.2 Which topics and types of variables were included
The variables can be classified into a number of different categories. Each category was considered in terms of its relevance to the purpose of the segments and the quality of data it could provide, to determine if it was suitable for inclusion.
Briefly, the categories are:
-
basic exporting behaviour / exporting status. It contains the key questions to define the main segments. As such, they are not part of the extended segmentation itself, which seeks to take the main segments a stage further, but they are an essential part of determining the starting point for the segmentation analysis
-
detailed profiling of exporting behaviour. These questions focus on the specific details of what is exported, which countries are exported to, and so on. While useful for profiling exporters, and any segments found within them, they are generally too specific and detailed to provide good material on which to segment and are not part of the final data set for the analysis
-
attitudes towards exporting. These are ideal variables for the segmentation, having been used in the previous exploratory segmentation analysis within the Promote main segment. They are asked of all respondents in the three key main segments, and use a scale which provides good differentiation between individual companies. The attitudes are a reflection of the way a company feels about exporting rather than simply being a measure of what they do. As such they provide excellent inputs to the process
-
current knowledge about exporting. These are also excellent variables for use in the segmentation and were used in the previous segmentation work within Promote. Again, they are asked of all respondents in the three key main segments and the extended scale used delivers good data to use for this process
-
requirements for exporting advice. This was a simple question which asked about the interest in receiving advice on exporting. As such, it is directly related to the aims of the segmentation. The responses show good differences between respondents and were clearly showing something different from the responses to the knowledge variables. This was therefore a valuable variable to add to the analysis
-
sources of exporting advice. This was felt to be an area that may be interesting for the segmentation, but the structure of the questions and the response codes used differed by wave. The responses were recoded into summary categories to simplify the variables, but the total responses were still quite low, and it was decided to retain these for profiling purposes only, and not to use them as an input to the segments
-
business skills and capabilities. A number of questions were included in the surveys on these themes and they were felt to be good potential inputs to the segmentation. More personal; to an individual company than its basic size and structure and more relevant to its ability to export they seem to offer scope for enhancing the analysis. Some were only asked in one wave and ultimately they were reserved for profiling the segments, but those which were present in all 3 waves were included. These variables were not ideal in their structure but were recoded to make them more suitable (details of which can be found in section 2.3.5).
-
awareness of exporting related advertising. These questions were somewhat different by wave, and while potentially interesting, were also quite specific to each wave and the advertising that had taken place. They were therefore not considered for inclusion in the segments
-
awareness of exporting related websites. Although there was a long list of websites, there were relatively few responses for all but a few codes here, with awareness very low overall. Although recoded into some basic categories to enhance this data and make it more suitable for profiling, it still lacked the depth required to be included as an input to the segments
-
general attitudes towards work, growth and innovation. These questions were asked in all three waves and seemed to offer a valuable insight into the type of company, in terms of its readiness to be an exporter and whether it had the right corporate mentality to cope with exporting. The questions included different types of scale and required some recoding, but were felt to be useful additions to the list of segmentation inputs
-
company profiling (firmographics). The standard questions of company size, turnover and industry sector provide an excellent means of profiling companies. While it was noted that there are some apparent links with exporting status, they are not that strong, and ultimately company size and type is not a good predictor of attitudes towards exporting. Company profiles, such as number of employees are an effective and simple means of segmenting companies in their own right. For example, looking at small, medium and large businesses is a well-established way to examine the business population. However, such variables do not fit well alongside other types, such as the more attitudinal variables in terms of generating more complex segments.
Given that the objective here was to identify segments which are better differentiated by their exporting behaviours and attitudes, and to go beyond the simple and somewhat limited approach of looking at businesses by basic company information, such as employees or turnover, these characteristics are therefore reserved for profiling segments generated from other, more useful variables, rather than being included as segmentation inputs themselves.
2.2.3 General conclusions on the variables to include
There are relatively few variables which are different by wave, and also strong candidates for inclusion in the segmentation process. Most of those which vary by wave are too specific or focussed on fine details to offer potential for segmenting businesses. Therefore the segmentation itself only uses variables common to all three waves. The larger sample size was considered to represent a much greater advantage than that offered by the inclusion of a few extra variables for part of the sample. Some of the variables that were excluded because they are only in one wave of data were still used for profiling purposes.
Most variables included are the same across waves. However, one key area which did not match up in all waves covered was ‘barriers to exporting’. This key area was present in all surveys, but asked in a significantly different manner in wave 3 from that used in waves 1 and 2. However, it was felt to be interesting enough to include, even though it required some recoding of the data to make the waves comparable.
Although there are variables specifically relevant to current exporters, these are also very detailed and not suitable for inclusion in a segmentation of current exporters (Sustain segment). The variables used are therefore the same for all three main segments, which allowed for the possibility of segments across these 3 combined, as well as within the 3 separately (the solution which was ultimately chosen).
2.3 Refining the segmentation inputs
2.3.1 Replacing any missing data
For those questions which included a don’t know response, a default answer was included, so that respondents with 1 or 2 don’t know responses could be included in the final segmentation. Typically, such a default value will be based on either the mean score for the total sample, or the mean score for that respondent (if for example there are a lot of questions with the same scale) or even a combination of both.
The key questions affected here all use similar responses (5 points, agree vs. disagree scale), but the mean scores are relatively different across the variables affected, ranging from 2.4 to 4.5 on the 1 to 5 scale. Using the overall average score by individual was therefore not a viable option as this could be a poor representation of the missing score. It was also observed, though, that the mean scores were also quite different by main segment for many of the variables. Using the total sample average was therefore also not ideal.
The solution used was to replace any missing scores with the average for the main segment to which that business belonged, which minimises any potential error in the process. By ensuring that we are never assigning any especially distinctive characteristics in place of missing data, we avoid falsely assigning a respondent to a segment based on that data.
2.3.2 Factor analysis – understanding the dimensions in the data
Having selected the variables which were to be considered for use in the segmentation, a factor analysis was conducted to help identify the key dimensions within the variables to be used. Factor analysis is a dimensionality reduction technique that creates a number of independent dimensions (factors) from a larger number of input variables and a typical part of many segmentation analyses. The resulting factors can then be used as inputs to the clustering technique which will separate case into segments.
The variables had been all selected because they potentially had links to exporting behaviour. Therefore, it was felt that it was likely that many of them may be strongly correlated with each other, particularly where there were multiple variables derived from the same set of questions with in the surveys.
While not necessarily a problem for the segmentation, including too many variables which focus on the same, or very similar issues, might lead to those issues being given too much prominence in the final solutions. Identifying which variables formed factors was therefore useful in determining whether this was a risk.
The total set of variables that could potentially be included was relatively lengthy. Understanding the key themes in the data was therefore also of value in suggesting ways in which the inputs to the segmentation might be simplified. This allowed for the generation of segments that were easier to understand, while ensuring that the different themes were all covered by the final set of variables selected.
Additionally, as the potential variables included different types of data, some of which were less suitable for inclusion in the segmentation than others, it was felt that it could be of value to use the factor analysis to identify ways in which some of them could be combined, not only to simplify the inputs, but also to provide data of a type which was more beneficial to the segmentation process.
The factor analysis identified a number of factors, which are summarised below. Technically, each factor includes all of the variables, each of which has a loading showing its association with that factor. However, the theme represented by each factor is determined by those variables which load onto it most strongly. In most cases, each individual variable is only associated strongly with one of the factors. For ease of understanding, we have concentrated only on these strongest associations, when describing the factors below.
The first factor grouped together a number of the key exporting attitude statements. They are all detail having a positive attitude towards exporting, with regard to the respondent’s own business. Note that one of the statements (marked with ‘-‘ is negatively correlated with the others, that is. people who tend to agree with the other statements tend to disagree with this one.
- international growth is an exciting prospect for my business
- there is a lot of opportunity for my business to grow internationally
- exporting would give my business the opportunity for higher or faster growth
- there would not be enough demand for my business overseas to make it worthwhile
- more and more businesses like mine are starting to export
- interested in information and business support services that can assist you with exporting
Although the final statement was grouped with the others in the analysis, it was slightly less strongly linked to the underlying factor than the others. It was felt that it did represent a slightly different theme. While it was understandable that those who were more positive about exporting might be more likely to want support, the two do represent somewhat different aspects of the overall attitude to exporting.
The next factor confirmed that the 3 aspects of current levels of knowledge were linked and formed a factor within the data, as below.
- knowledge of where to go for information about exporting
- knowledge of where to go for help and support with exporting
- current knowledge about how to export
Two statements relating to a general positivity towards exporting formed a third factor.
- there is a lot of demand for British products or services around world
- a lot more businesses could export than do
The business skills were divided into 2 different factors. One of these included more basic business skills and capabilities, as below, and seems to describe a business’s potential to cope with the complexities that might arise from choosing to export.
- have an owner / manager with a degree
- have a finance team
- have people with language skills
- have a written business plan
- have connections with other businesses
The second factor built around business skills, clearly represented a theme of innovation within the business, combining some of the skills with the response from a question to identify whether new products have been introduced.
- have applied for or obtained any patents, trademarks or other legal protection for any of your products or services
- have introduced new or significantly improved products or services in the past twelve months
- have UK based employees engaged in Research and Development or new product or service development activity
The sixth factor identified growth issues and included these 2 variables.
- having a positive attitude to growth (derived from a multiple choice list)
- aim to grow your business over the next 2 to 3 years
In addition to the factors which combined variables under one theme, there were also 4 factors which were driven by a single attribute, which did not combine that strongly with any of the other variables. These were:
- being a successful exporter is something to be proud of
- there are too many risks in taking a business internationally
- work life balance favours work
- there is a lot of support available to help small and medium businesses start exporting
There were also 2 factors that combined business capabilities with specific reference to exporting. One that covered more basic skills and capabilities included 3 variables:
- have enough staff capacity
- have enough managerial time
- have enough staff skills
A second factor was identified which covered more specific planning / market assessment capabilities.
- have capability to undertake market research study
- have capability to develop export business plan
- have capability to assess international competition
- have capability to assess cost of exporting
These final 2 factors were based arounds variables only present in one wave of the data. They were included in segments to test whether they enhanced the process sufficiently to justify using the smaller dataset, but were found to make relatively little difference to the segments. They were therefore excluded from the final segmentation so that the benefits of using the full dataset could be realised.
2.3.3 Deciding whether to use factors in the segmentation
As noted previously, using factors instead of all of the original variables can sometimes enhance a segmentation as it simplifies the dataset used. However, using only factors may also over simplify the variables. Additionally, here we have some factors which combine a number of key variables and others which include just a single variable, possibly one less critical in determining exporting behaviour. The risk of using these in the segmentation is that the emphasis on what is being analysed may shift too much towards those less critical issues.
A number of trial segmentation analyses were conducted, using all of the original variables and reducing them to the maximum extent by using only the underlying factors identified. While both extremes produced segments which could be used, neither offered an ideal solution. Using all of the individual variables was over complicated, and the simple binary nature of the data for some of the variables such as business skills, meant they did not add much to the more revealing scaled data of the attitudinal variables.
Using only factors tended to underplay the importance of the specific exporting related information, and was based too much on the more peripheral aspects such as business capabilities. It was felt that – while it may be a useful business segmentation – it lacked the focus on exporting that was required of this analysis. Using factors to combine some of the simpler data, though, did improve the analysis, and incorporating this benefit was felt to be important.
The final approach used a combination of individual variables and composite variables based on the factors selected. This achieved the best balance between having the most suitable data and the optimal exporting focus for the inputs. Where variables were already scaled data and evaluated key criteria (generally the attitudes towards exporting, knowledge levels, need for assistance) they were used in their original state. Where there were multiple variables of a simpler nature that represented a theme, as shown by the factors, these were combined to produce a more useable input to the segmentation process. The final list of variables used in the analysis is detailed in section 2.3.5.
2.3.4 Recoding variables for comparability
It is not essential that the variables used share the same response scale because techniques are available that can make allowance for different types of variable. Nevertheless, it is generally desirable that the data used is similar if this is at all possible. It allows the use of wider range of techniques and also makes the analysis and interpretation of the segments identified somewhat more straightforward.
A potential disadvantage of using some attributes with much wider scales than others is that they may dominate the results, since they account for much more variation in the total dataset. The majority of the key variables identified used a similar scale, with 5 response options being common to many of them (often the same 5 codes, sometimes different, but on a similarly sized scale). Where possible, those attributes which used different scales were recoded to bring them in line with the 5 point scale of the majority of variables. The exact nature of any recoding is detailed in the following section.
2.3.5 Selection of segmentation variables and recoding
Attitudes to exporting
There are 2 statements covering attitudes towards exporting in general (asked of all respondents)
- there is a lot of demand for British products or services around the world
- a lot more businesses could export than do export
And there are 8 more detailed attitudes towards exporting with relevance to their own business (asked of all respondents, except the Challenge main segment)
- international growth is an exciting prospect for my business
- more and more businesses like mine are starting to export
- there is a lot of support available to help small and medium businesses start exporting
- there is a lot of opportunity for my business to grow internationally
- being a successful exporter is something to be proud of
- there are too many risks in taking a business internationally
- there would not be enough demand for my business overseas to make it worthwhile
- exporting would give my business the opportunity for higher or faster growth
All of these 10 statements used the same 5 point scale, as shown below.
- Disagree strongly
- Disagree slightly
- Neither agree nor disagree
- Agree slightly
- Agree strongly
These statements were very important to the segmentation process, but unlike many of the other questions, did allow for don’t know responses in the original surveys. They were therefore identified as key variables when it came to deciding whether to include a respondent in the analysis. It was these variables that were used to filter out respondents with too many don’t know responses from the final analysis, as outlined previously. A maximum of 2 missing / don’t know responses were permitted across these 10 questions.
These variables have been included in their original format of the 1 to 5 scale.
Knowledge about exporting
There are 3 measures of the current level knowledge of exporting (asked of all except the Challenge segment). These ask: “On a scale of 0 to 10, where 10 means you have very good knowledge and 0 means you have no knowledge at all, how would you describe..”
- your current knowledge about how to export
- where to go for information about exporting
- where to go for help and support with exporting
The extended scale used for these 3 variables could mean that they have an undue influence on the results if included in their original format. They have therefore been recoded to use a 1 to 5 scale for compatibility with the attitude questions outlined above (the score of out 10 is simply adjusted, such that 0 maps to 1 on the 5 point scale, a maximum score of 10 to a 5, with all other scores recoded in proportion between these extremes.
Interest in support
This was represented by a single question, asking: ‘How interested would your business be in information and business support services that can assist you with exporting?’
This used a simple 3 point scale, which was recoded to a 5 point scale as below:
- Very interested (=5)
- Quite interested (=3)
- Not interested (=1)
While this recoding does reinforce any differences on this issue, it was felt to be such a key topic to include in the segmentation, and is not covered by any of the other questions, that this approach would enhance the results.
Business skillset
Respondents were asked a simple question about a number of business skills which their company may have:
Which of these does your business have?
- a written business plan
- a finance team
- UK based employees engaged in research and development or new product or service development activity
- applied for or obtained any patents, trademarks or other legal protection for any of your products or services
- people with foreign language skills
- owner / manager born overseas
- connections with other businesses
- owner / manager with a degree
- an overseas target
From this list, an overseas target was felt to be too specifically related to already being an exporter, while having a manager or owner born overseas was not felt to be an appropriate variable for segmentation, although it is a useful profiling variable.
The remaining skills were all felt to be suitable for inclusion, although the simplistic yes / no style of the data was not ideal for inclusion alongside the scaled responses of many of the other questions.
It was also observed that many companies tended to have several of these skills and that the number of skills they possessed, i.e. the size or depth of their business skillset, might be a better means of evaluating their potential ability to export than the specific details of each individual skill. This was borne out by the results of a factor analysis which suggested that there was a clear underlying factor in the data from this question, which incorporated 5 of these individual skills. Details of this factor analysis are included in section 2.3.2.
A factor which represented this business skillset was therefore created which both combined the responses from the 5 original codes, and recoded the data into a scale which was comparable with the 5 point attitude scales. The total number of skills from this reduced list below was calculated, and then converted to a 5 point scale (where 1 = 0 skills, 2 = 1 skill, 3 = 2 skills, 4 = 3 skills and 5 = 4+ skills).
- a written business plan
- a finance team
- owner / manager with a degree
- connections with other businesses
- people with foreign language skills
Note that the remaining skills from the original list are included in the next variable used in segmentation inputs.
Innovation capabilities
The level of innovation within an organisation appeared to be connected with the ability to export successfully, but this topic was covered by 2 different types of question. The factor analysis conducted on the potential segmentation inputs identified that there were 3 variables which formed a clear factor which was used as the basis of a measure of a company’s innovation capabilities.
This included 2 of the business skills, which were asked alongside those skills referenced in the previous “business skillset” variable, namely having:
- UK based employees engaged in research and development or new product or service development activity
- applied for or obtained any patents, trademarks or other legal protection for any of your products or services
The third innovation focussed variable came from a direct question:
- thinking about innovation within your business i.e. new products and processes, have you introduced new or significantly improved products or services in the past 12 months?
These questions produced 3 simple yes / no responses, which were combined to form a factor measuring innovation. This sum of the 3 variables, originally on a 0 to 3 scale was then converted to a 1 to 5 scale for comparability with the other segmentation input variables.
Growing the business
Business growth, similar to innovation, appeared to be related to the ability to export successfully, but was represented by 2 different questions. These were identified as forming a factor when included in the factor analysis.
These were a 5 point scale, asking:
Which of these best describes your thinking on growth?
- to build a substantial business we have to go for rapid growth
- we’re aiming for steady sustainable growth rather than rapid growth
- it’s about consolidating what we have rather than growing
- not interested in the business getting any bigger
- growing the business will bring more risks than benefits
And a simple direct question, asking:
Over the next 2 to 3 years, do you aim to grow your business?
These were combined into a factor by assigning a 1 to 5 score to the scaled question, where 5 was the most positive attitude about growth and 1 the least. A score of 5 was assigned to those who have aims to grow the business and 1 to those who do not, before taking an average of the two, to produce a measure of how growth focussed the business is.
Barriers to exporting
Understanding barriers to exporting was felt to be beneficial to the segmentation process. This area was covered in substantially different ways in the different waves, so it required a degree of recoding to produce useable variables.
Waves 1 and 2 of the NSRB used an extended list of issues, covering a number of areas which respondents were asked to identify as barriers. This produced a large number of simple yes / no responses, many of which though are used relatively infrequently.
Wave 3 asked respondents to assess the degree to which different areas were a barrier, using the following question.
On a scale of 0 to 10, where 0 means it is not a barrier at all and 10 means it is a very strong barrier, how much of a barrier is each of the following when it comes to exporting?
- cost
- lack of knowledge
- the capacity of your business to export and cater for international contracts, for example having the right number of people, machinery, skill levels etc.
- access to contacts, customers and the right networks
While this scale question presented a more useful variable for the segmentation than the simpler approach used in previous waves, it was not enough of a key topic to be worth sacrificing data from the other waves to include the extra detail. Both types of question were therefore recoded into simple yes / no variables.
Firstly the topics covered in waves 1 and 2 were classified (in consultation with DIT) into the 4 different areas measured in wave 3. Any mention of a topic in a given area resulted in that area being classified as a barrier for a respondent.
To classify wave 3 respondents in the same way, a cut-off point was identified on the 0 to 10 scale, such that any score over that cut-off was identified as a barrier. The point used was fixed at a level that resulted in the proportion being classified as a barrier being as close as possible to that measured in the previous waves. (In practice this meant a score of 7 or more for cost and knowledge and 8 or higher for access and capacity issues). The result was 4 simple variables as below:
- cost is barrier to exporting
- knowledge is a barrier to exporting
- capacity is a barrier to exporting
- access is a barrier to exporting
Because they have only a 2 point scale, using a 1 to 5 recode for these potentially gives them too much influence as it introduces a relatively large difference between respondents. A recode of 1 to 3 for these 4 variables was found to give better results, allowing them to have sufficient influence on the final solutions.
Work life balance
As with other aspects of the business, such as innovation, the work versus life balance seemed to have a potential link to the degree to which a company / individual was prepared to commit resources / themselves to focussing on exporting (although to a lesser degree than some of the other issues).
This issue was covered by a single question:
Which of these come closest to your own thinking?
- a good work / life balance is the priority for me
- the business is important but I don’t let it dominate my life
- I’m very driven; the business dominates my life
Although not strictly speaking a scale, it was felt that the 3 codes did represent an increasing shift towards work in the work life balance. The responses were coded in this fashion. Because this issue was not identified as being as strongly linked to exporting as others, it was recoded to have scores on a 1 to 3 scale. This way, it contributes to the final results, but does not have too much influence on them.
2.4 The segmentation process
2.4.1 Determining the best approach – who to include in the segments
A number of different options were available for creating the segments. They each offered a different balance between simplicity and precision. The options included:
Segmenting among the total sample
This option would provide a single set of segments which can be applied to all businesses, regardless of their exporting status. While it would be very simple to use, its practical uses would be very limited. It would mean using a substantially reduced list of variables in order to accommodate the Challenge main segment, who are not asked many of the export focussed questions. The Challenge segment was also felt to be so different from the others that there was little value in having a set of export-focussed segments which included them and this option was rejected.
Segmenting among the total sample, excluding the Challenge segment
This option would solve the problem of including the Challenge segment. It would still provide for a single set of segments which can be applied to all businesses, provided that they have a product suitable for export, whatever their current exporting status. The attraction of such an approach could be that one set of segments could potentially be easier to use as it is less complex for users to remember and work with. There is also the potential benefit of being able to draw easy comparisons between Sustain, Reassure and Promote main segment businesses on a common framework of sub-segments.
These potential benefits meant that this option was seriously considered and segments were created within the 3 key main segments combined into one sample. A number of options were examined and were felt to offer adequate solutions, but not one which was immediately identified as an ideal means of segmenting the data. Once compared to other, more detailed solutions treating the main segments separately, this approach was rejected in favour of one which offered better depth of the profiling of businesses and their exporting behaviour and attitudes.
Ultimately, the differences between the main segments were felt to be too important to ignore. However similar two businesses are in terms of their ability to export and their attitudes towards doing so, the fact that some are currently exporting and others are not could not be excluded without some impact on the quality of the final segments.
There clearly were, for example, some businesses within the Sustain segment, who shared the same attitudes and capabilities as some of those within the Reassure or Promote segments. These, therefore, could well be classified as being in the same exporting segment and a solution across the main segments would make sense for such cases. There were, though, also too many examples of differences in the data between the main segments for the main segment itself not to be a major determinant in which sub-segment a business falls into.
Taking one of the knowledge variables as an example, the figures below show the extent to which these are different between the main segments. The scores represent the level of knowledge on how to export, expressed as a 0 to 100 scale.
| Segments | Score on 0 to 100 scale |
|---|---|
| Sustain | 69 |
| Reassure | 48 |
| Promote | 31 |
As might be anticipated, those already exporting tend to know more about it than those who are not exporting. The average level of knowledge among the main segments is such that a current exporter with lower than average knowledge levels for a Sustain business is still likely to know more than a non-exporter with above average levels of knowledge for a Promote business. Combining the data into one overall segmentation tended to lose the detail of this reference to the typical knowledge levels within the main segments by comparing everyone to the average for the total sample.For some features such as this the total sample average was a lot less meaningful than that for the main segments.
Segmenting separately within the main segments, Sustain, Reassure and Promote
While inevitably more complex to work with, since this approach results in 3 different sets of segments, segmenting within main segment does ensure that the key differences between those segments are not lost in the efforts to produce a simple framework that fits all businesses, whether they are exporting or not.
Once compared with the results of the total sample segments, it was clear that this approach offered greater potential for identifying meaningful segments. The differences between the segments created were much clearer and more distinctive, making the average profile of any segment much more typical of those within it. It was also more practical to interpret the results when the main segment was known. Any given profile of attitudes or capabilities of a group of businesses proved to be much more powerful in describing them, as well as providing insights on what they may require, when done with the background knowledge of their exporting activity. The final segmentation approach selected was, therefore, to conduct three separate analyses within the Sustain, Reassure and Promote main segments.
2.4.2 What technique was used to create the segments
The segmentation / clustering technique used for this work was k-means clustering, using an optimized set of initial cluster centroids. The aim of this technique is to partition the respondents into clusters (segments) of respondents, while trying to maximize the heterogeneity between segments and maximize the homogeneity within segments, in terms of the input variables. A number of alternative segmentation solutions based on the input variables detailed above were created and profiled. For each of the 3 main segments, solutions ranging from two to eight sub-segments were generated.
2.4.3 Choosing the solutions
The technique allows the analyst to determine the number of clusters created, by generating a range of solutions from which an optimal number of segments can be selected. More segments will be more effective at explaining differences between businesses, by virtue of the greater differentiation possible with more splits in the total dataset. By contrast, fewer segments are generally easier to work with and will be larger and more practical to profile. The selected solution needs to strike an appropriate balance between producing segments that are clearly different from each other and a solution which is workable and will be capable of being applied to classifying businesses in the future.
The segments must capture the key variations between businesses that exist in the total population. Too few segments will mean that the solution seems quite bland and that important differences are being overlooked. Selecting too many segments, though, may not only overcomplicate the solution, but also make too much of what are in reality quite small differences between businesses. While the numbers behind the solutions are used to verify that any selection is acceptable from a pure analytical point of view, the final decision is very much a practical one: To achieve the balance between usefulness and usability.
In practice, a simple choice of 2 or 3 segments within each main segment would have produced an easily manageable number of segments overall, but it was rapidly established that two segments was clearly too few, even within the smallest of the three datasets (Reassure). This simply did not provide sufficient scope to explain some of the major differences that were apparent in the data when compared with solutions with more segments. The choice of solutions was narrowed to between 3 and 5 segments for all 3 segmentation analyses, and these were profiled further, including additional variables to add extra depth to the decision making process. The optimal solutions decided upon were to use four segments with Sustain and Reassure and three segments within Promote. With the larger sample within that main segment, 4 segments within Sustain was an easy choice. It clearly offered more than the 3 segment solution, while the advantage of moving to 5 segments was less and not enough to justify the extra complexity.
Given the smaller samples within Reassure and Promote, choosing fewer segments was given greater consideration here and would have been desirable in terms of profiling the chosen solutions. Ultimately, though, within Reassure, choosing three rather than 4 segments was hiding too much of the variation in the data and the higher number of segments was selected. Within Promote, the lower number of segments offered an acceptable level of differentiation and the benefits of fewer segments outweighed the advantage of the greater detail of more segments, so the 3-segment-solution was selected.
Details of the segments themselves, their size, key characteristics and profiling are included the main report.
3. Identifying the segments in future work
3.1 DIT: discriminant analysis - predicting the segments
Discriminant analysis is a way of classifying respondents into existing categories or groupings, as opposed to segmentation which defines or identifies what those groupings may be. Typically this is done so that new respondents can be assigned to the existing groupings using a range of variables which is simpler or requires less additional data gathering than the original segmentation procedure. The success of a discriminant analysis algorithm is typically measured in terms of the predictive accuracy (that is how many of our original respondents are classified correctly).
Analysis using the same variables that were used in the original classification or segmentation procedure is typically used to identify the most discriminating variables, and to provide a simpler means of classification than asking all of the original questions. These are often referred to as the ‘golden questions’. This can be particularly useful when the original segmentation uses a long list of variables, and usually works best when many of the original variables show similar patterns, opening up the possibility of using a subset of the whole list to achieve similar results. When the number of variables used in the analysis is reduced some loss of accuracy is inevitable. Ideally the aim is to achieve a high level of accuracy, with a sizeable reduction in the number of variables required. Table 3.1 below shows the accuracy of reclassification in each segment as the inclusion of relevant variables drops from using all the relevant original segmentation variables to just 5. The final algorithm selected and derived uses the top 5 “golden questions” with an accuracy rate of 81%. Note that the twelfth cluster (Challenge) is not derived using the algorithm itself but is based on the questions used to define the original exporting grouping (main segment), if an organisation has not exported and does not have products/services suitable for exporting they are automatically assigned to segment twelve (Challenge) as in the original analysis, hence the accuracy rate of 100%.
Table 3.1 : Reclassification rates using the golden question algorithm
| Main segment | Sub-segment | Ref | using all relevant variables | using top 10 | using top 5 |
|---|---|---|---|---|---|
| Promote | Communicate benefits | p1 | 95% | 91% | 85% |
| Nurture and grow | p2 | 97% | 97% | 91% | |
| Build export capacity | p3 | 90% | 85% | 81% | |
| Reassure | Enhance competitiveness | r1 | 86% | 83% | 75% |
| Build export capacity | r2 | 86% | 78% | 75% | |
| Communicate benefits | r3 | 94% | 78% | 76% | |
| Change the game | r4 | 97% | 95% | 87% | |
| Sustain | Nurture and grow | s1 | 92% | 87% | 83% |
| Change the game | s2 | 93% | 91% | 90% | |
| Build export capacity | s3 | 89% | 87% | 79% | |
| Communicate benefits | s4 | 92% | 89% | 70% | |
| Challenge | C | 100% | 100% | 100% | |
| Average overall (incl. Challenge) | 93% | 88% | 83% | ||
| Average overall (excl. Challenge) | 92% | 87% | 81% |
The first stage of the allocation process is to assign each organisation into one of the 4 main segments as below:
Sustain: current exporters, that is businesses which have exported goods or services in the past 12 months Reassure: businesses which haven’t exported in the past 12 months, but which had exported previously Promote: businesses which have never exported but which self-identify as having goods or services which could potentially be exported or developed for export Challenge: businesses which have never exported and do not currently see their goods or services as suitable for export
These are defined within the survey using the following questions:
Q15 : EXP : Exporting status: Single coded
Thinking now about exporting or selling your products/services overseas, would you say that…
READ OUT. SC.
1 Our products / services not suitable for export
2 We’ve never considered exporting and wouldn’t want to
3 We’ve considered / tried selling to international customers but it isn’t right for us
4 We’d be interested in exporting but wouldn’t know how to start
5 We’re actively exploring the potential for exporting to new markets
6 We’ve started to sell to international customers and are planning to increase exports
7 Exports and international business is a big and growing part of our business
8 [DON’T READ OUT] Other (write in)
ASK ONLY IF Q15 : EXP=1,2,3,4,5
Q16 : EXP_EVER_A : Whether ever exported: Single coded
Have you ever exported any products or services outside of the UK? (TEXT SUB IF IN NORTHERN IRELAND: This includes sales to the Republic of Ireland). IF YES: what would you say is the frequency of those sales?
1 Never had overseas sales
2 Overseas sales every year
3 Overseas sales every other year
4 Overseas sales less regularly than every other year
98 Don’t know
Scripter notes: Text sub if sample tagged as in NI
ASK ONLY IF Q15 : EXP=1,2,3
Q18 : EXP_POSSIBLE : Whether exporting possible: Single coded
Which of these best describes your business?
READ OUT
1 My products or services would never be suitable for export
2 It would be possible to develop my products or services for export
ASK ONLY IF Q15 : EXP = 6, 7 or Q16 : EXP_EVER_A=2,3,4,98
Q20 : EXP_SERV : Exporting services: Single coded
In the past 12 months did your business export any SERVICES outside of the UK? This could include commissions, royalties and licences (ADD IF IN NORTHERN IRELAND: This includes sales to the Republic of Ireland). This does not include exports of goods.
1 Yes
2 No
97 Don’t know
Scripter notes: Text addition if in NI.
ASK ONLY IF Q15 : EXP = 6, 7 or Q16 : EXP_EVER_A=2,3,4,98 or Q17 : EXP_EVER_B=2,3,4,98
Q23 : EXP_GOODS : Exporting goods: Single coded
In the past 12 months did your business export any GOODS outside of the UK? This could include commissions, royalties and licences (ADD IF IN NORTHERN IRELAND: This includes sales to the Republic of Ireland). This does not include exports of services.
1 Yes
2 No
97 Don’t know
Scripter notes: Text addition if in NI
For future allocation these will be simplified as follows…
Which of these best describes your business?
…have exported within the last 12 months
…have exported but not in the last 12 months
…have never exported but have a product suitable or could be developed for export
…have never exported and do not have a product suitable for export
The top 5 golden questions are as follows:
These are defined within the survey using the following questions:
Q30 : EXP_KNOW: Knowledge of exporting
On a scale of 0 to 10, where 10 means you have a very good knowledge and 0 means you have no knowledge at all, how would you descibe your knowledge of where to go for help and support with exporting
| show response as | 0 | 1 | 2 | 3 | 4 | 5 | 6 | 7 | 8 | 9 | 10 |
|---|---|---|---|---|---|---|---|---|---|---|---|
| recode response as | 1 | 1.4 | 1.8 | 2.2 | 2.6 | 3 | 3.4 | 3.8 | 4.2 | 4.6 | 5 |
| Where to go for HELP AND SUPPORT with exporting | o | o | o | o | o | o | o | o | o | o |
Q31 : EXPE_STAT : Agreement with exporting statements
I am now going to read out some statements made by people in businesses like yours and for each one we would like you to tell us to what extent you agree or disagree with the statements. Please use the following scale: agree strongly, agree slightly, neither agree nor disagree, disagree slightly, disagree strongly.
To what extent do you agree or disagree that …..
| code response as | 5 | 4 | 3 | 2 | 1 |
|---|---|---|---|---|---|
| show response as | Agree strongly | Agree slightly | Neither agree nor disagree | Disagree slightly | Disagree strongly |
| International growth is an exciting prospect for my business | o | o | o | o | o |
| There is a lot of opportunity for my business to grow internationally | o | o | o | o | o |
| There would not be enough demand for my business overseas to make it worthwhile | o | o | o | o | o |
Q37 : ADVGOVT: Interest in support
How interested would your business be in information and business support services that can assist you with exporting?
| code response as | show response as |
|---|---|
| 3 | Very interested |
| 2 | Quite interested |
| 1 | Not interested |
For future allocation these will be simplified as follows
- How would you describe your knowledge of where to go for help and support with exporting?
To what extent do you agree or disagree that…
- International growth is an exciting prospect for my business
- There is a lot of opportunity for my business to grow internationally
- There would not be enough demand for my business overseas to make it worthwhile
- How interested would your business be in information and business support services that can assist you with exporting?
3.2 Allocation algorithm
Membership was determined on a respondent by respondent basis in 5 steps:
a. Allocate to one of the 4 main segments, Sustain, Reassure, Promote or Challenge, for all except Challenge move to the ‘golden question’ stages below, for Challenge assign and finish
b. The respondent’s answer to the each of the “golden questions” was multiplied by the relevant weighting coefficient – this was done for each of the segments
c. The products for each question were summed, generating a single total score for each respondent
d. The relevant ‘constant’ was subtracted from each of the column totals
e. The respondent was allocated to the segment which they scored highest against once the constant had been subtracted
Annex A: Initial exploratory analysis of the Promote segment
The focus of this exploratory analysis was on the ‘Export Inert Group’; the Promote Cluster from Wave 1 of the National Survey of Registered Businesses. The approach was conducted with the help of Professor Kevin Money and based on the approaches outlined in by K. Money et al.[footnote 4]
Statistical approach
Segments were generated from the results of 5 key attitudinal/preference questions and a subsequent cluster analysis:
- General attitude to growth and international expansion
- Attitude to growth
- Attitude towards exporting - There is a lot of demand for British products or services around the world
- Attitude towards exporting - A lot more businesses could export than do export
- Perception that International Growth exciting and possible for own business
- International growth is an exciting prospect for my business
- More and more businesses like mine are starting to export
- There is a lot of support available to help small and medium businesses start exporting
- There is a lot of opportunity for my business to grow internationally
- Exporting would give my business the opportunity for higher or faster growth
- Feeling of Pride if exporting internationally
- Being a successful exporter is something to be proud of
- Perception of high risk of international expansion
- There are too many risks in taking a business internationally
- There would not be enough demand for my business overseas to make it worthwhile
- Level of knowledge how to export and how/where to find information and help
- Your current knowledge about HOW to export
- Where to go for INFORMATION about exporting
- Where to go for HELP AND SUPPORT with exporting
The results from the questions were standardised on a five-point scale to ensure robust results from the cluster analysis. Four clusters were initially generated using a hierarchical clustering method and were further refined using k-means clustering. Each case within a cluster was identified as were the categories that distinguished clusters from each other. Chi-square cross-tabulations were used to explore statistical differences between clusters on categorical variables and demographics. Two outlying cases were eliminated, leaving a usable sample of 169. The reliability of the method was checked by matching and comparing attitudinal and descriptive variables between the data sets of waves 1 and 2.
-
HMRC: Trade in Goods by Business Characteristics. Period covered: 2016 ↩
-
ONS ‘UK business’ activity, size and locations, 2017’ ↩
-
National Survey of UK Registered Businesses’ Exporting Behaviours, Attitudes and Needs 2017: £500k+ Small and Medium Businesses ↩
-
Money, K., Hillenbrand, C., Henseler, J. and da Camara, N. (2013) Exploring unanticipated consequences of strategy amongst stakeholder segments: the case of a European Revenue Service. Long Range Planning, 45 (5-6). pp. 395-423. Money, K., Hillenbrand, C., Hunter, I. and Money, A.G. (2012) Modelling bi-directional research: a fresh approach to stakeholder theory. Journal of Strategy and Management, 5 (1). pp. 5-24. ↩