Market Data Insights: November 2020
Updated 14 January 2021

© Crown copyright 2021
This publication is licensed under the terms of the Open Government Licence v3.0 except where otherwise stated. To view this licence, visit nationalarchives.gov.uk/doc/open-government-licence/version/3 or write to the Information Policy Team, The National Archives, Kew, London TW9 4DU, or email: psi@nationalarchives.gov.uk.
Where we have identified any third party copyright information you will need to obtain permission from the copyright holders concerned.
This publication is available at https://www.gov.uk/government/publications/market-data-insights/market-data-insights-november-2020
This month in brief
At the end of October, the UK announced a 4-week national lockdown to create a circuit breaker for the transmission of the COVID-19 which came to a close in December. The government also announced further support to help businesses and individuals through various schemes as well as the extension of the ‘Coronavirus Job Retention Scheme’.
Whilst the government has acted quickly to help support the UK economy through these difficult times, there remains significant uncertainty over both the short and long term.
The UK finds itself at a critical juncture with Brexit negotiations ongoing as the country prepares to leave the EU at the start of 2021. Depending on the outcome of those negotiations, it is expected that the UK recovery is likely to be slow as several service-based sectors will remain disrupted.
There are also fears that unemployment levels could continue to rise leaving permanent scars on the UK economy. The government is looking to address this through focus on individuals on low-income and youth workers through the Plan for Jobs and the Wider Economic Plan.
Credit Spreads as at 31 October 2020
| AAA | AA | A | BBB | ||||||
|---|---|---|---|---|---|---|---|---|---|
| 32 bps | 64 bps | 114 bps | 194 bps | ||||||
| ▼ 11.1% MoM | ▼ 4.5% MoM | ▼ 4.2% MoM | ▼ 4.0% MoM |
An asset’s ‘credit spread’ is the difference between its yield and that of a government issued bond of similar maturity. It is an indicator of the perceived riskiness of the asset. It represents how much investors want to be rewarded for investing in it instead of a lower risk government bond.
Over October, the credit spreads for investment grade credit narrowed reflecting increased confidence in the market.
Equities
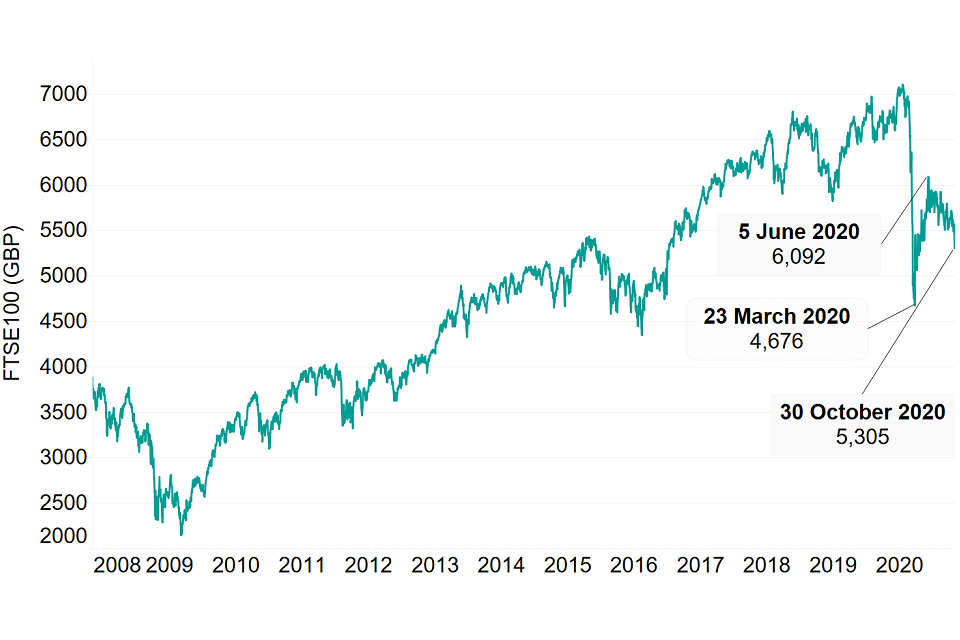
The Financial Times Stock Exchange 100 Index (al referred to as the FTSE 100) is an index composed of the 100 largest companies listed on the London Stock Exchange (LSE).
The graph below shows how the value of the FTSE 100 has fluctuated from November 2007 to October 2020. Over the past 13 years, the FTSE 100 was at its lowest value of just over 2,000 in March 2009. This was as a result of the 2008 financial crash. Over the past 10 years, the FTSE 100 has gradually grown and crossed the 7,000 barrier in January 2020.
At the start of the first national lockdown, the FTSE 100 crashed to 4,676 at 23 March 2020. This was reflected the significant uncertainty over the future coupled with massive disruptions in a wide scale of industries. Since then, there was a recovery to 6,092 at the start of June. However, over the last 5 months (June – October), the FTSE 100 has gradually fallen. The FTSE 100 reached 5,305 at the end of October. The shrinking over recent months might reflect the continued restrictions imposed throughout the country across a wide range of sectors.
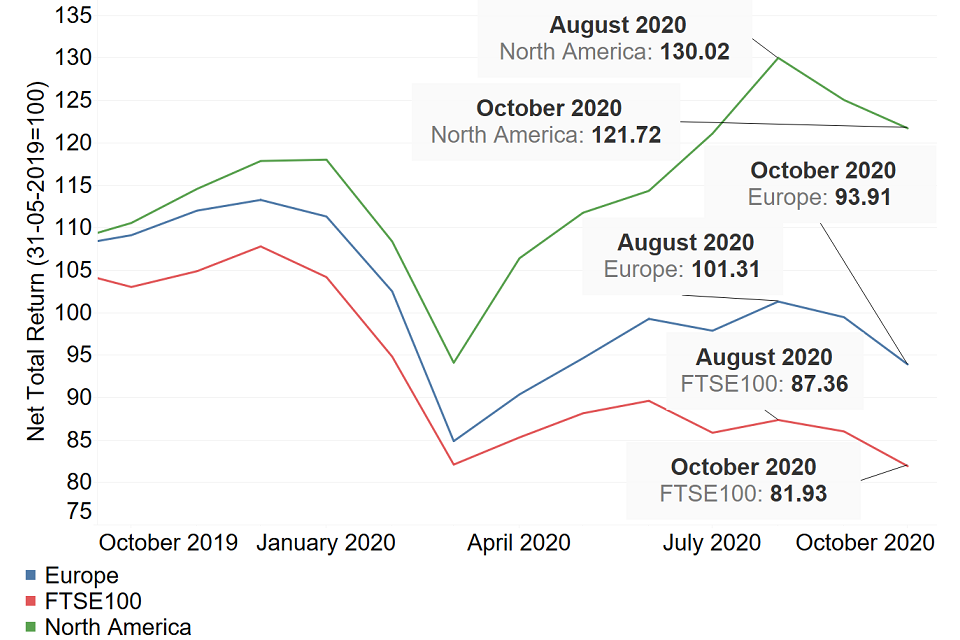
The second graph below shows how the end-of-month positions have varied for the FTSE 100 between October 2019 and October 2020. The graph also compares against the North American and European MSCI Indices which measures stock market performances in those areas. The graph is based on a base index of 100 for all three indices as at 31 May 2019.
The graph shows a similar story to the FTSE above as all three markets have seen the values shrink over the past couple of months, with nearly a 10% reduction for all three from August 2020 to October 2020. Both North America and Europe achieved yearly highs in August. This shows that movements in the UK markets follow similar patters with those seen across the other major countries / economies.
Unemployment
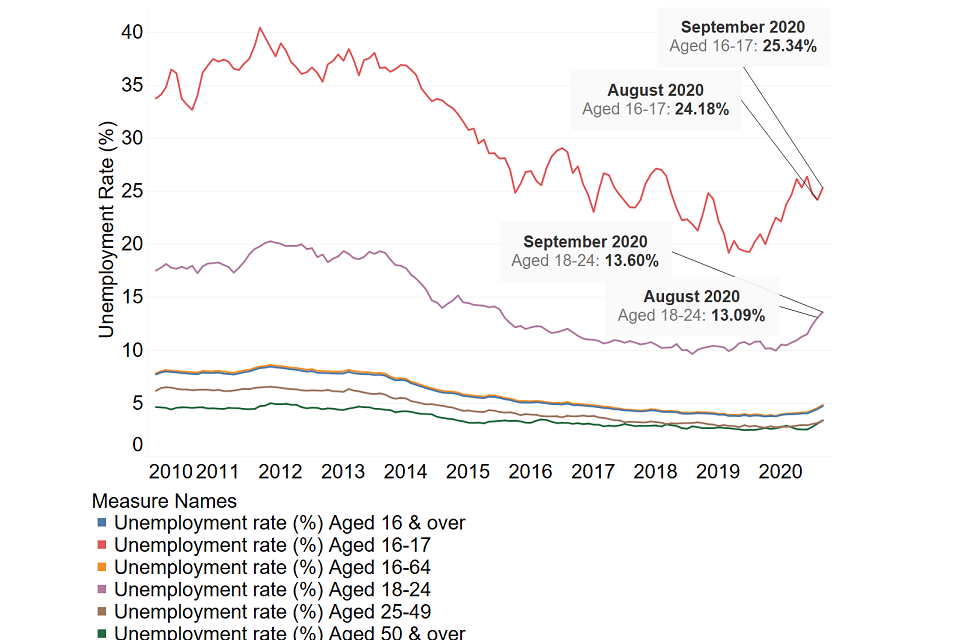
The chart below shows unemployment rates between 2010 and 2020 for different age groups of the UK population. It shows rates generally reducing up to early 2020 across all age groups, with noticeable increases in the employment rate for those aged below 25 since March 2020.
Unemployment levels for 16-17 year-olds increased to 25.34% in September 2020, reversing the reductions observed in July and August 2020. Unemployment levels for 18-24 year olds have consistently increased over the past few months, reaching 13.60% by September 2020.
Overall unemployment levels (ages 16 % over) are also gradually increasing as the impacts of COVID-19 begin to take effect on the UK economy. Unemployment levels do however remain below the levels observed in 2012/13. However, it is anticipated that unemployment levels will continue to rise in the last quarter of 2020 and at the start of 2021. This is likely to be the result of cash-strapped businesses have to make tough decisions in response to further lockdowns and restrictions across the country.
Any material or information in this document is based on sources believed to be reliable, however we cannot warrant accuracy, completeness or otherwise, or accept responsibility for any error, omission or other inaccuracy, or for any consequences arising from any reliance upon such information. The facts and data contained are not intended to be a substitute for commercial judgement or professional or legal advice, and you should not act in reliance upon any of the facts and data contained, without first obtaining professional advice relevant to your circumstances. Expressions of opinion do not necessarily represent the views of other government departments and may be subject to change without notice.
Quality Assurance Scheme
The Government Actuary’s Department is an accredited organisation of the Institute and Faculty of Actuaries’ Quality Assurance Scheme.

Institute and Faculty of Actuaries' Quality Assurance Scheme logo