Market Data Insights: January 2021
Updated 14 January 2021

© Crown copyright 2021
This publication is licensed under the terms of the Open Government Licence v3.0 except where otherwise stated. To view this licence, visit nationalarchives.gov.uk/doc/open-government-licence/version/3 or write to the Information Policy Team, The National Archives, Kew, London TW9 4DU, or email: psi@nationalarchives.gov.uk.
Where we have identified any third party copyright information you will need to obtain permission from the copyright holders concerned.
This publication is available at https://www.gov.uk/government/publications/market-data-insights/market-data-insights-january-2021
2020 in Brief
December brought the close of a calendar year where almost all facets of life were impacted in some form or another by COVID-19. Countries across the globe took various approaches to combat the virus and control the number of cases and deaths.
The UK found itself under its first national lockdown from 23 March. Since then, the UK has found itself in a cycle of lockdown and release as the government tried to balance the health and economic impacts of the virus.
The UK government borrowed nearly £300 billion over 2020 to help boost the economy and keep many businesses and individual afloat. This included a range of schemes such as the Coronavirus Job Retention Scheme, Eat Out to Help Out, and the stamp duty waiver.
There was also an ambition to capitalise on the benefits of COVID-19 as working patterns changed from busy offices to personal homes. The UK government launched a new initiative to create jobs via the ‘Kickstart Scheme’ as well as building back the country ‘better, stronger and greener’.
EU Transition
2020 was also a historic year as the Brexit transition period ended on the 31 December. After months of negotiations, the UK and EU announced the Trade and Co-operation Agreement on 24 December. This ended the great deal of uncertainty which underpinned market behaviour during the negotiations.
As the long year drew to a close, 2 vaccines were approved after they both showed promising results in reducing the risk of experiencing COVID-19 symptoms. This news provided much need public and market confidence that as we entered 2021, there would be a return to normal.
However, the number of cases and deaths grew exponentially over December and remained at high levels in January. This led to the UK entering a third national lockdown on 5 January to control the rates of COVID-19 cases and deaths and to ease the burden on the NHS. The length of this lockdown will likely be dependent on the success of the vaccination programme.
Despite the national lockdown, the stock market continued to perform well through January. This was buoyed by the continuation of the roll-out of vaccines and the start of the UK’s new journey after leaving the EU single market.
As more people are vaccinated, there is hope that restrictions will be eased over the course of 2021 and life can return to ‘normal’. However, there is likely to be significant economic scarring expected which could have longer-term implications.
Credit Spreads as at 31 December 2020
| AAA | AA | A | BBB | ||||||
|---|---|---|---|---|---|---|---|---|---|
| 27 bps | 53 bps | 91 bps | 152 bps | ||||||
| ▼ 0% MoM | ▼ 3.6% MoM | ▼ 4.2% MoM | ▼ 4.4% MoM |
An asset’s ‘credit spread’ is the difference between its yield and that of a government issued bond of similar maturity. It is an indicator of the perceived riskiness of the asset. It represents how much investors want to be rewarded for investing in it instead of a lower risk government bond.
Over the month of December, credit spreads for investment grade credit narrowed for all classes bar AAA which remained the same. This indicates increased confidence in these markets ability to not default.
Inflation
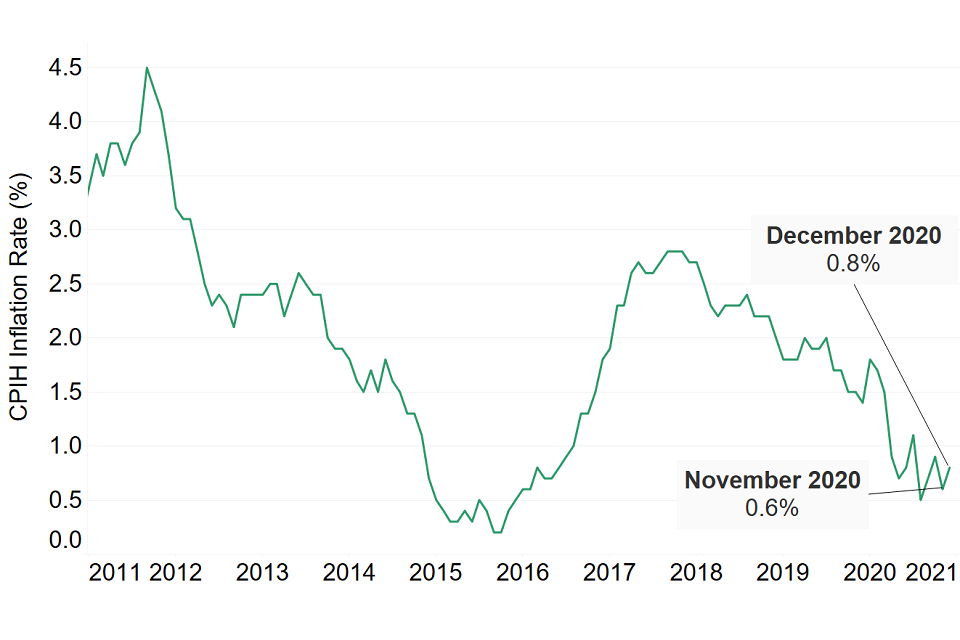
The Consumer Price Index (CPI) measures the average change in prices over time that consumers pay for a basket of goods and services. The Consumer Price Index including owner occupiers’ housing costs (CPIH) is similar to CPI, in that it also measures inflation, but it also includes a measure of owner occupiers’ housing costs.
The chart below shows the CPIH inflation rate between January 2011 and December 2020.
CPIH fluctuations continued in December as CPIH bounced back from 0.6% in November to 0.8% in December. The increase over December driven mainly by rising transport costs as well as increased prices for clothing, footwear and recreation and culture items. Although food and non-alcoholic beverage prices continue to fall, they only cause a partial offset of the increases discussed.
Foreign Exchange
The foreign exchange represents the value of one currency in the price of another. For example, if Foreign Exchange rate of the US Dollar is said to be 0.50 GBP, then it costs 50p to purchase $1. Alternatively, it would cost $2 to purchase £1. This would be referred to as the exchange rate between the US Dollar and the British Pound.
Foreign Exchange rates are an indicator for the economic health of the country. A strong currency enables buying goods and services from other countries, also referred to as imports, cheaper. It also allows the country to sell its goods and services, also referred to as exports, to other countries for more.
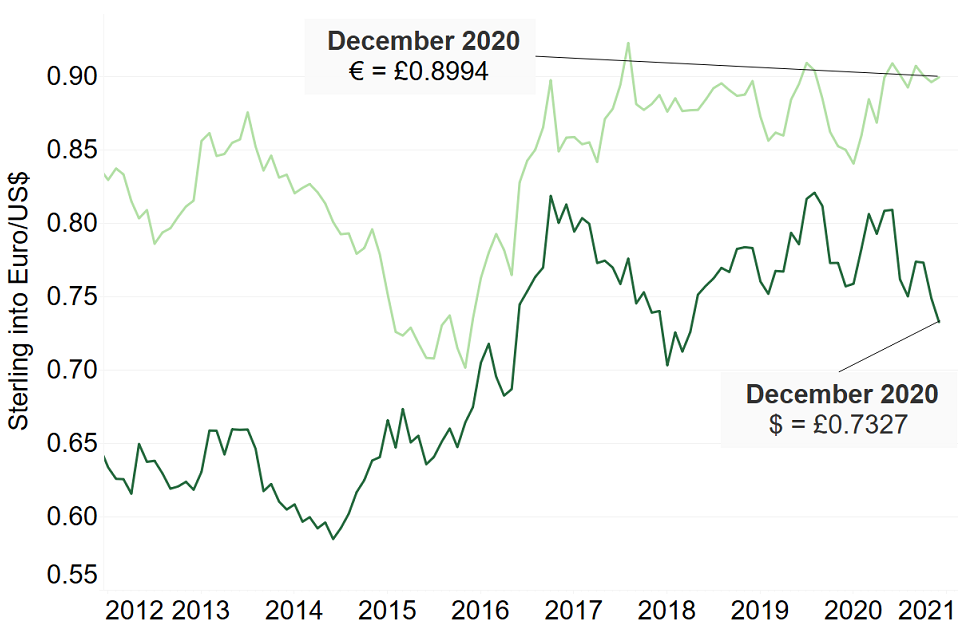
We focus on the exchange rate between the British Pound and both the Euro and the US Dollar. The chart below shows how these rates have varied between January 2012 and December 2020.
The US Dollar rate as at December 2020 is 0.7327 British Pounds, which is the lowest it has been since April 2018. The Euro as at December 2020 is 0.8994 British Pounds, which was a slight increase from 0.8961 in November 2020.
The strengthening of the British Pound against the US Dollar is in part likely to be due to the resolution and ratification of the UK Brexit plans. This coupled with the approval of the AstraZeneca COVID-19 vaccine has seen more market confidence in the British Pound.
Public Sector Borrowing
A fiscal deficit occurs when the government’s expenditure on goods, services and benefits, is greater than its income through tax receipts. To cover this shortfall in revenue, the government must borrow money. Public sector borrowing is the process of selling a range of short-term or long-term government bonds.
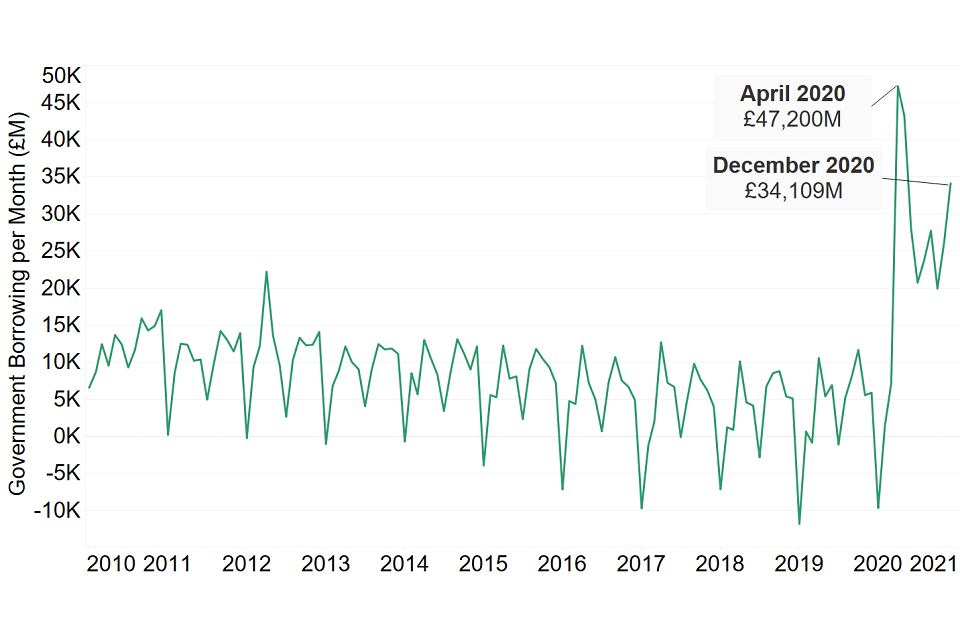
Public sector borrowing for December 2020 was £34.1 billion. This continued the increasing levels of borrowing observed in October and November 2020, which were £19.9 billion and £26.1 billion respectively.
The latest figures show that the UK borrowed a net total of £270 billion in 2020. This represents a total of £278 billion since March, being partially offset by the surplus recorded in January 2020. This is more than double the £121 billion borrowed in 2010 which was the previous record year of borrowing.
The chart below shows the level of government borrowing between January 2010 and December 2020. Government borrowing fluctuated regularly between £15 billion and minus £10 billion from 2010 to 2019. The negative borrowing occurs when there is a debt repayment, usually aligned with tax receipts. There has been a significant increase since April 2020 as the government introduced a range of measures to help protect the UK economy against the impacts of COVID-19.
Any material or information in this document is based on sources believed to be reliable, however we cannot warrant accuracy, completeness or otherwise, or accept responsibility for any error, omission or other inaccuracy, or for any consequences arising from any reliance upon such information. The facts and data contained are not intended to be a substitute for commercial judgement or professional or legal advice, and you should not act in reliance upon any of the facts and data contained, without first obtaining professional advice relevant to your circumstances. Expressions of opinion do not necessarily represent the views of other government departments and may be subject to change without notice.
Quality Assurance Scheme
The Government Actuary’s Department is an accredited organisation of the Institute and Faculty of Actuaries’ Quality Assurance Scheme.

Institute and Faculty of Actuaries' Quality Assurance Scheme logo