Market Data Insights: December 2020
Updated 14 January 2021

© Crown copyright 2021
This publication is licensed under the terms of the Open Government Licence v3.0 except where otherwise stated. To view this licence, visit nationalarchives.gov.uk/doc/open-government-licence/version/3 or write to the Information Policy Team, The National Archives, Kew, London TW9 4DU, or email: psi@nationalarchives.gov.uk.
Where we have identified any third party copyright information you will need to obtain permission from the copyright holders concerned.
This publication is available at https://www.gov.uk/government/publications/market-data-insights/market-data-insights-december-2020
This month in brief
Throughout November, the UK found itself in a 4-week national lockdown to help reduce the rate of transmission of COVID-19. Despite this, the number of cases and deaths have risen dramatically over December and continued to remain at high levels in January.
In late December, large parts of the country were put into ‘Tier 4’, the highest level of restrictions in the UK.
Reduced levels of interactions were permitted across the Christmas break that had been previously envisaged.
Despite these restrictions, the UK entered lockdown in early January to further control the rates of COVID-19 cases and deaths in the country.
The impact of these continued restrictions is likely to see a further shrinking in the UK economy over the final quarter of 2020. As a result, the UK economy is set to be in a significantly larger recession than the one observed in 2009 following the financial crisis.
However, there was hope with the announcement of progress made by Pfizer and BioNTech, and AstraZeneca and Oxford on a vaccine. Both announced promising results in reducing the risk of experiencing COVID-19 symptoms.
The news boosted confidence that recovery of the global economy could be quicker than originally anticipated. This was reflected by strong stock market performance over the course of the month.
The newly approved vaccines are due to be rolled out to the most vulnerable groups from January 2021. As a growing percentage of the population is vaccinated, social distancing restrictions imposed across the world can be eased. This is expected to provide a much-needed and significant boost to the tourism and consumer-facing industries.
Credit Spreads as at 30 November 2020
| AAA | AA | A | BBB | ||||||
|---|---|---|---|---|---|---|---|---|---|
| 27 bps | 55 bps | 95 bps | 159 bps | ||||||
| ▼ 15.6% MoM | ▼ 14.1% MoM | ▼ 16.7% MoM | ▼ 18.0% MoM |
An asset’s ‘credit spread’ is the difference between its yield and that of a government issued bond of similar maturity. It is an indicator of the perceived riskiness of the asset. It represents how much investors want to be rewarded for investing in it instead of a lower risk government bond.
Over the month, credit spreads for investment grade credit narrowed considerably. This came on the back of the news of the approved vaccines against COVID-19 which also saw considerable reaction in the investment markets.
Equities
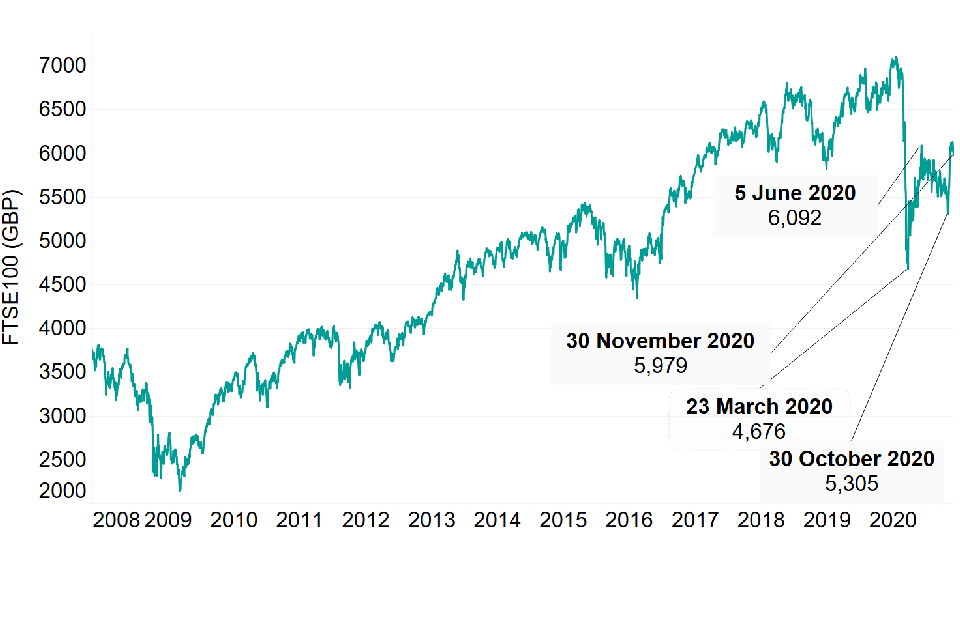
The Financial Times Stock Exchange 100 Index (also referred to as the FTSE 100) is an index composed of the 100 largest companies listed on the London Stock Exchange (LSE).
The graph below shows how the value of the FTSE 100 has fluctuated from November 2007 to November 2020. Over the past 13 years, the FTSE 100 was at its lowest value of just over 2,000 in March 2009. This was as a result of the 2008 financial crash. Over the past 10 years, the FTSE 100 has gradually grown and crossed the 7,000 barrier in January 2020.
Over the course of the COVID-19 pandemic, the FTSE 100 has fluctuated reflecting market uncertainty over future economic prospects. Over the month of November, the FTSE 100 grew by almost 13% to £5,967. This was fuelled by the news of the coronavirus vaccines which is anticipated to allow faster economic recovery than previously expected. The FTSE 100 remains slightly short of the pandemic-high observed at the start of June 2020 (£6,092).
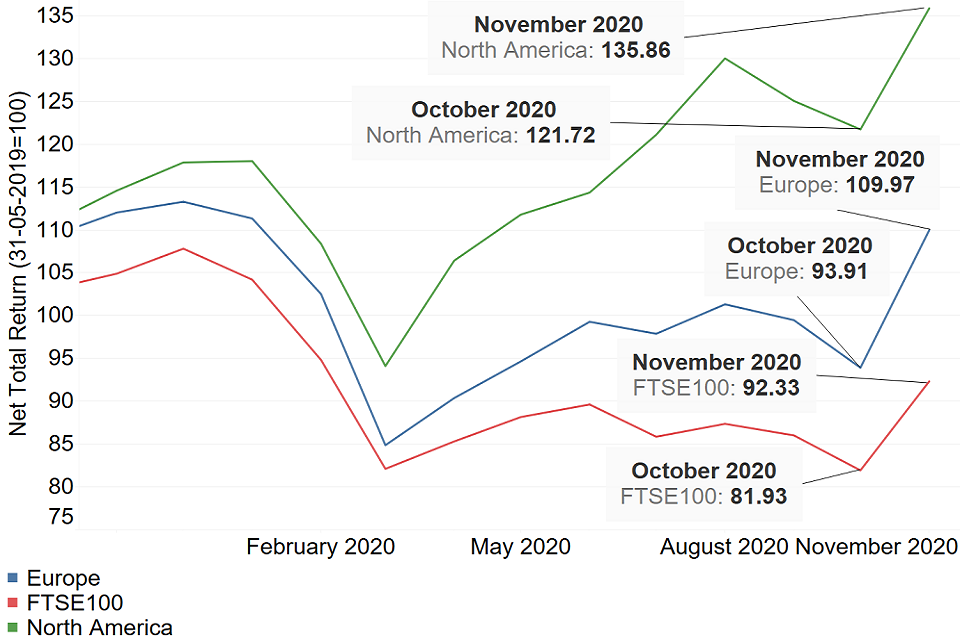
The second graph below shows how the end-of-month positions have varied for the FTSE 100 between November 2019 and November 2020. The graph also compares against the North American and European MSCI Indices which measures stock market performances in those areas. The graph is based on a base index of 100 for all three indices as at 31 May 2019.
The graph shows that all three markets have seen their values grow by more than 10% over the month of November. By the end of November, the North American markets had grown to their highest levels since the MSCI indices began. This shows that the North American markets were buoyed not only by the news of a COVID-vaccines as seen in the UK and rest of Europe, but also by the result of the General Election.
European markets ended November with a MSCI index of 109.97 following strong growth in the month. This was just short of the MSCI index of 111.33 observed at the end of January, which remains the highest value of 2020.
Inflation
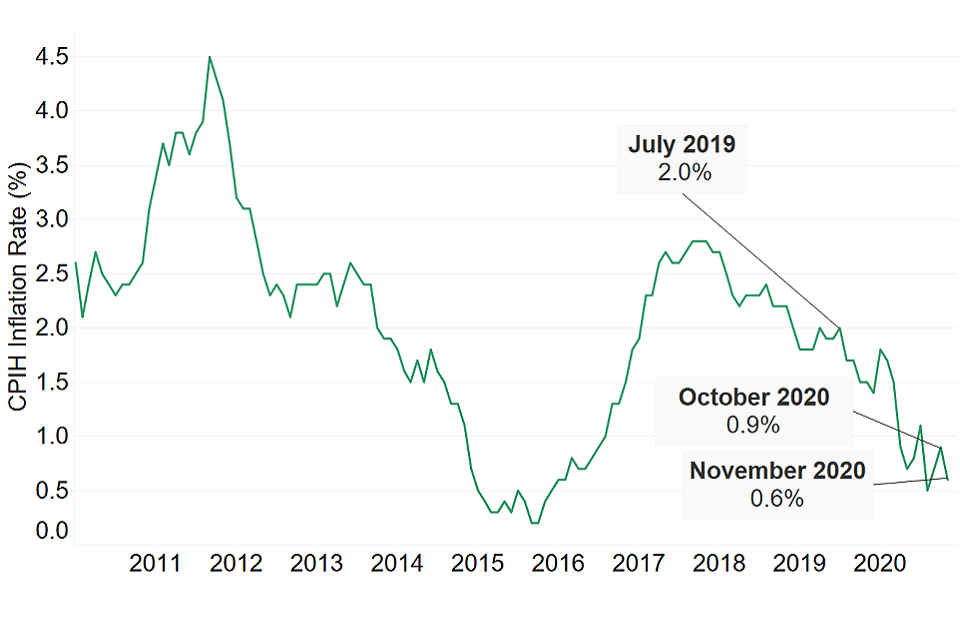
The Consumer Price Index (CPI) measures the average change in prices over time that consumers pay for a basket of goods and services. The Consumer Price Index including owner occupiers’ housing costs (CPIH) is similar to CPI, in that it also measures inflation, but it also includes a measure of owner occupiers’ housing costs.
The chart below shows the CPIH inflation rate between January 2010 and November 2020. The Bank of England’s target rate of inflation is 2.0%. The last time CPIH inflation reached this target was in July 2019.
CPIH fell from 0.9% in October 2020 to 0.6% in November as inflation continued to fluctuate in 2020. The reduction over November was largely driven by a fall in prices for clothing, footwear, food and non-alcoholic beverages. The prices fall in November have been linked to increased discounting offered across the month. There have been reports of many outlets offering Black Friday sales throughout the month rather than being restricted to one Friday.
Property
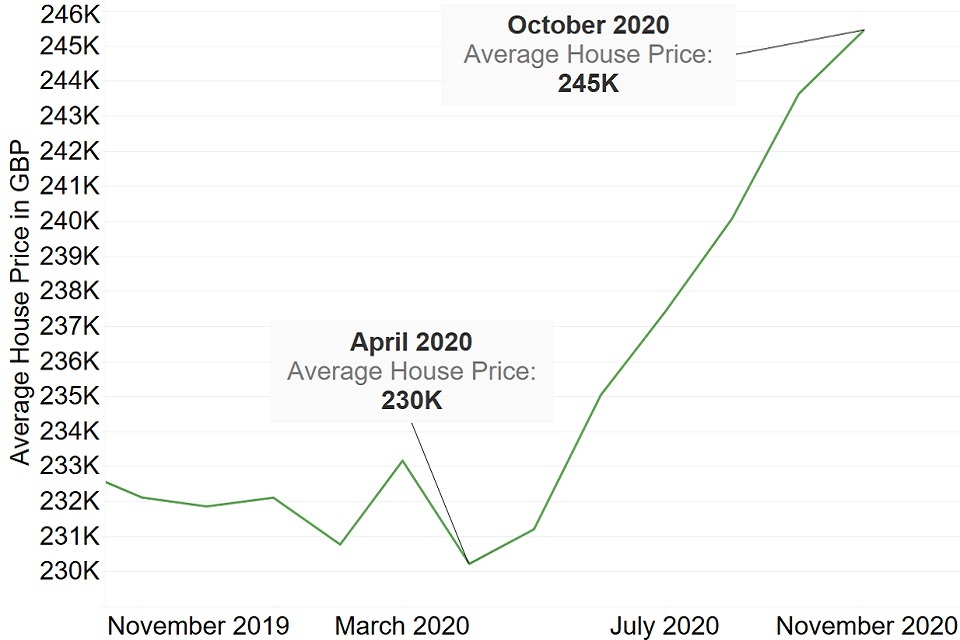
The chart below shows the average UK house prices between October 2019 and October 2020. House prices were relatively stable between October 2019 (£233,000) and April 2020 (£230,000). Since April 2020, average house prices have continued to grow over the rest of the year. This has been driven by the stamp duty holiday which has led to an increased demand in the UK housing market.
It is expected this increased demand might remain in place for the next couple of months. This is due to buyers racing against the clock to complete purchases by the end of the financial year, and therefore benefitting from the stamp duty holiday.
However, there are concerns over the housing market in the more medium term. As unemployment levels rise across the country and individuals re-evaluate their living arrangements, there could a systematic shift in the UK housing market. As individuals increase the flexibility in their working patterns, and companies look to downsize their offices, there could be knock-on impacts on the UK residential housing market.
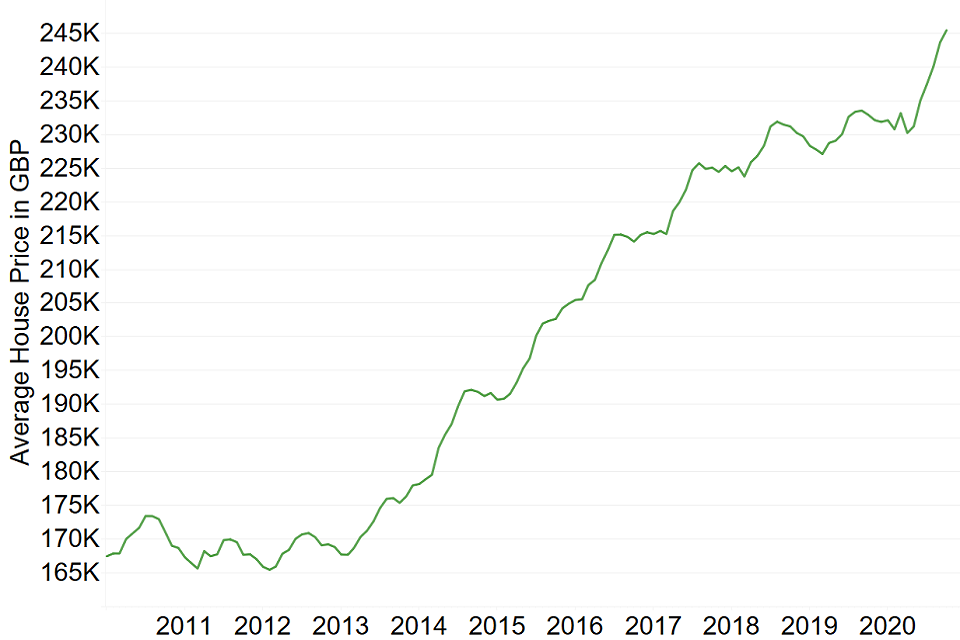
The second graph below shows how the average house prices in the UK have varied between January 2010 and November 2020. Average house prices were largely stable between 2010 to 2013.
Despite economic turmoil throughout the rest of the economy, there has been strong growth in average UK house prices in 2020. This growth has been even stronger than the growth in house prices between 2013 to 2019, as evidenced by the spike in 2020.
Any material or information in this document is based on sources believed to be reliable, however we cannot warrant accuracy, completeness or otherwise, or accept responsibility for any error, omission or other inaccuracy, or for any consequences arising from any reliance upon such information. The facts and data contained are not intended to be a substitute for commercial judgement or professional or legal advice, and you should not act in reliance upon any of the facts and data contained, without first obtaining professional advice relevant to your circumstances. Expressions of opinion do not necessarily represent the views of other government departments and may be subject to change without notice.
Quality Assurance Scheme
The Government Actuary’s Department is an accredited organisation of the Institute and Faculty of Actuaries’ Quality Assurance Scheme.

Institute and Faculty of Actuaries' Quality Assurance Scheme logo