Market Data Insights: February 2021
Published 11 March 2021

© Crown copyright 2021
This publication is licensed under the terms of the Open Government Licence v3.0 except where otherwise stated. To view this licence, visit nationalarchives.gov.uk/doc/open-government-licence/version/3 or write to the Information Policy Team, The National Archives, Kew, London TW9 4DU, or email: psi@nationalarchives.gov.uk.
Where we have identified any third party copyright information you will need to obtain permission from the copyright holders concerned.
This publication is available at https://www.gov.uk/government/publications/market-data-insights-february-2021/market-data-insights-february-2021
This Month in Brief
The new year brought new beginnings for the UK as the transition period came to an end and life on new trading terms with the European Union began. There was also more of the same as the UK entered a third national lockdown on 4 January.
However, there remains hope that over the course of 2021 that normality will resume. This was supported by the 4-stage plan to lift England out of lockdown over a period of several months. The first stage will take place from 8 March with schools reopening. The final stage is currently planned for 21 June, where all restrictions are planned to be eased.
The UK’s vaccination programme which aims to provide a first dose to all UK adults by the end of July 2021 also supports this. The UK is currently one the leading countries with its vaccination programme. Economists are predicting that the British economy could outperform other countries over the second half of the year once restrictions are lifted.
A lot of the recovery and growth of the UK economy hinges on the Chancellor’s budget on the 3 March. There is significant pressure on the government to provide further financial support to the UK economy through the current prolonged lockdown.
Credit Spreads as at 31 January 2021
| AAA | AA | A | BBB | ||||||
|---|---|---|---|---|---|---|---|---|---|
| 26 bps | 53 bps | 92 bps | 151 bps | ||||||
| ▼ 1bps MoM | no change MoM | ▲ 1bps MoM | ▼ 1bps MoM |
An asset’s ‘credit spread’ is the difference between its yield and that of a government issued bond of similar maturity. It is an indicator of the perceived riskiness of the asset. It represents how much investors want to be rewarded for investing in it instead of a lower risk government bond.
Over the month of January, credit spreads for investment grade bonds moved by no more than 1 basis point. Overall, this indicates that there was no change in the market stability for credit.
Equities as at 31 January 2021
The graph below shows how the end-of-month positions have varied for the FTSE 100 between May 2019 and January 2021. The Financial Times Stock Exchange 100 Index (also referred to as the FTSE 100) is an index composed of the 100 largest companies listed on the London Stock Exchange (LSE).
The graph also compares against the North American and European MSCI Indices which measures stock market performances in those areas. The graph is based on a base index of 100 for all three indices as at 31 May 2019.
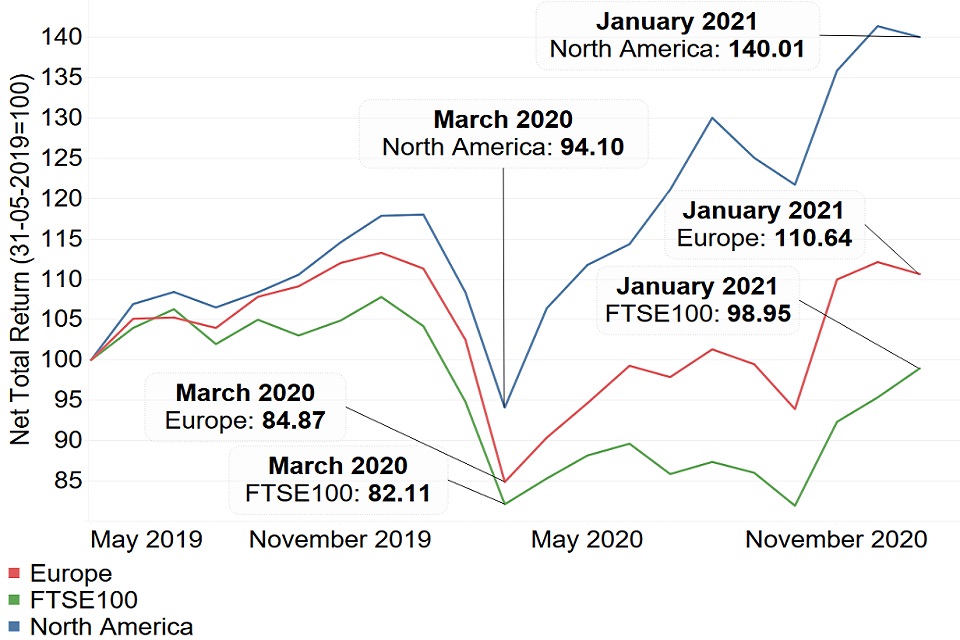
The FTSE 100 has grown for the second consecutive month in January 2021 compared to drops in the European and North American markets. This suggests that markets have been buoyed by the Brexit deal which should lead to more market predictability and stability in the immediate future.
However, the FTSE 100 has not shown the same recovery from March 2020 as the other markets. The North American Market has grown considerably over the past 10 months and currently sits at a higher level than its pre-COVID peak. Given that all these regions have been affected by the pandemic to similar degrees, this could be explained by the composition of the FTSE 100. The FTSE is largely made up of banks, retailers and airlines which have been some of the hardest hit sectors by the pandemic.
The long-term impacts of Brexit and COVID-19 still remain uncertain.
Public Sector Borrowing
Public Sector Net Borrowing, or a fiscal deficit, occurs when the UK government’s expenditure is higher than its income from taxes and other revenues. If government income is higher than government expenditure, this is referred to as Public Sector Lending or a Fiscal Surplus.
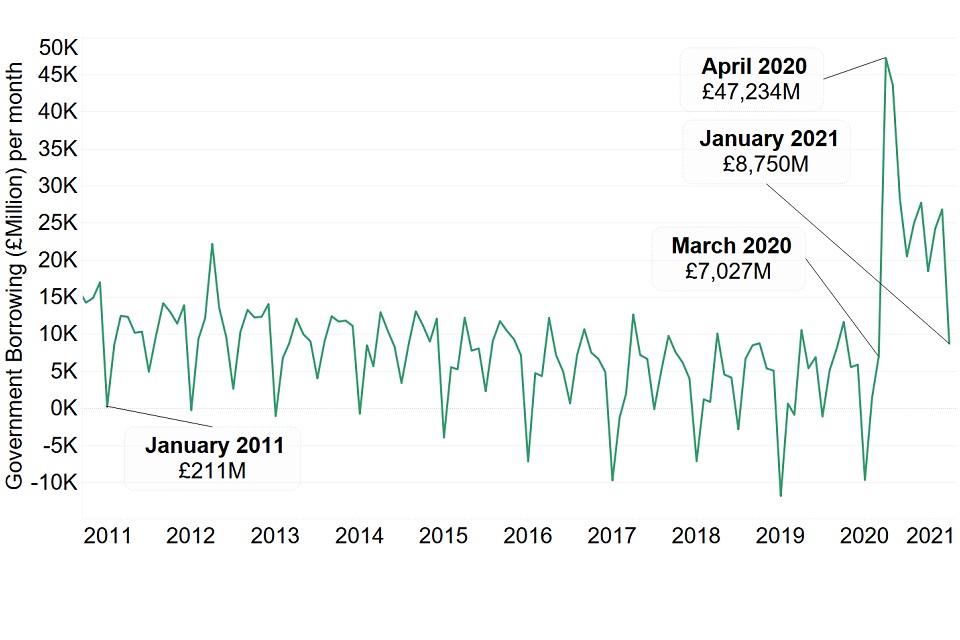
Government income typically exceeds its spending in January as this accounts for self-assessed tax receipts. However, due to the continued financial support for the economy during the coronavirus pandemic, the government borrowed nearly £9 billion in January 2021.
This resulted in the lowest level of borrowing since the start of the pandemic in March 2020. However, this was the first January borrowing in 10 years, and the highest January borrowing since records began.
Government spending has largely been driven by schemes such as the Coronavirus Job Retention Scheme (‘furlough’). The government estimates that 4.7 million people have been furloughed as at 31 January 2021. The furlough scheme has been extended until the end of September 2021.
Government income will also, as a result of the disruption caused by the pandemic, have received reduced income tax, national insurance contributions, VAT (which was reduced to 5% in the hospitality industry in July 2020) and corporation tax.
Property
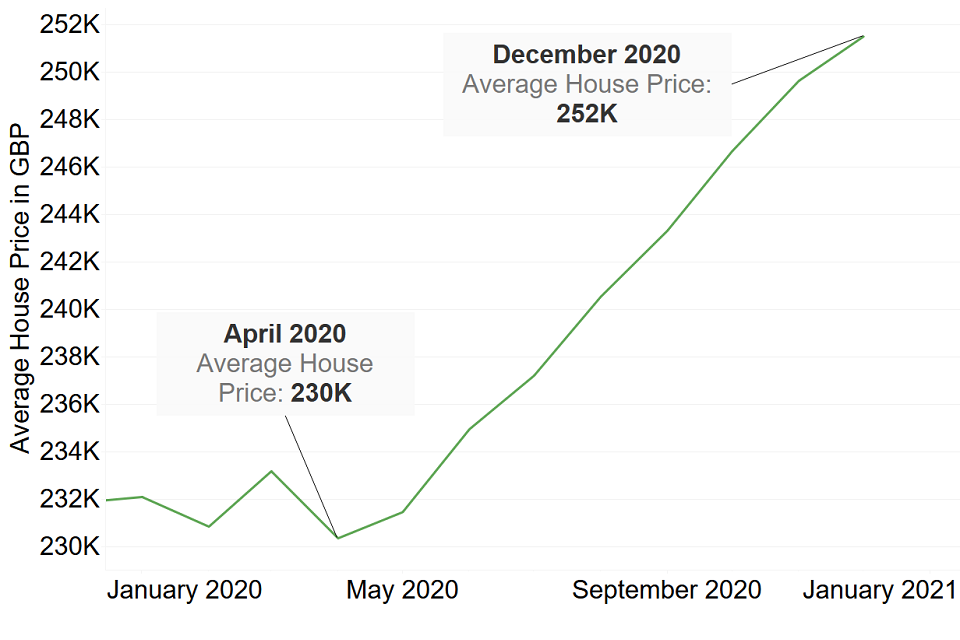
The chart below shows the average UK house prices over 2020. Since April 2020, average house prices have continued to grow over the rest of the year. House prices grew more than 9% between April and December 2020, the largest 9-month percentage growth since 2004.
This could be partially explained by the stamp duty holiday introduced in July 2020. Sellers might have been able to raise prices in order to absorb buyers’ stamp duty savings of up to £15,000.
However, attaining £15,000 in stamp duty savings is only applicable to properties over £500,000 whereas current average property prices are at the £250,000 mark. Combining this with average house prices growing over £20,000 since April 2020, we can conclude that this growth cannot be solely attributed to the stamp duty holiday.
We could also attribute this growth to: increased desire for better at-home working conditions, rushed (and therefore more expensive) buying in order to attain the stamp duty savings and being able to make extra personal savings from less social outgoings due to the lockdowns, adding extra participants to the housing market.
Any material or information in this document is based on sources believed to be reliable, however we cannot warrant accuracy, completeness or otherwise, or accept responsibility for any error, omission or other inaccuracy, or for any consequences arising from any reliance upon such information. The facts and data contained are not intended to be a substitute for commercial judgement or professional or legal advice, and you should not act in reliance upon any of the facts and data contained, without first obtaining professional advice relevant to your circumstances. Expressions of opinion do not necessarily represent the views of other government departments and may be subject to change without notice.
Quality Assurance Scheme
The Government Actuary’s Department is an accredited organisation of the Institute and Faculty of Actuaries’ Quality Assurance Scheme.