Market Data Insights: April 2021
Published 13 May 2021

© Crown copyright 2021
This publication is licensed under the terms of the Open Government Licence v3.0 except where otherwise stated. To view this licence, visit nationalarchives.gov.uk/doc/open-government-licence/version/3 or write to the Information Policy Team, The National Archives, Kew, London TW9 4DU, or email: psi@nationalarchives.gov.uk.
Where we have identified any third party copyright information you will need to obtain permission from the copyright holders concerned.
This publication is available at https://www.gov.uk/government/publications/market-data-insights-april-2021/market-data-insights-april-2021
Economic summary
April saw the UK go into step 2 of the government’s roadmap to the end of lockdown. This saw the reopening of non-essential retail and indoor leisure facilities. Hospitality venues have also been allowed to start serving customers outdoors. This coupled with the successful ongoing rollout of COVID-19 vaccines has meant UK equities have climbed to their highest level since February 2020.
GDP growth forecasts have been raised from around 4% in February to 5.4%. This is in part due to substantial government support laid out in the March 2021 budget. This bounce back would represent the greatest yearly economic expansion in over 40 years. Unemployment levels into 2021 are also expected to be better than originally forecasted due to this growth as well as the extension of the furlough scheme until autumn 2021.
Step 3 of the roadmap is set to start no earlier than the 17th of May with the opening of indoor hospitality venues and large outdoor venues. If the current vaccine schemes continue to run successfully, we can expect this to drive even better economic performance going into the summer where all social restrictions are expected to be lifted.
Credit Spreads as at 30 April 2021
| AAA | AA | A | BBB | ||||||
|---|---|---|---|---|---|---|---|---|---|
| 24 bps | 50 bps | 89 bps | 136 bps | ||||||
| ▼ 0bps MoM | ▼2 bps MoM | ▼2 bps MoM | ▼ 7 bps MoM |
An asset’s ‘credit spread’ is the difference between its yield and that of a government-issued bond of similar maturity. It is an indicator of the perceived riskiness of the asset. It represents how much investors want to be rewarded for investing in it instead of a lower risk government bond.
Over the month of April, credit spreads for investment grade bonds decreased by up to 7 basis points. The reduction in spreads was more significant for BBB rated credit, whereas better rated bonds remained relatively stable.
Equities as at 30 April 2021
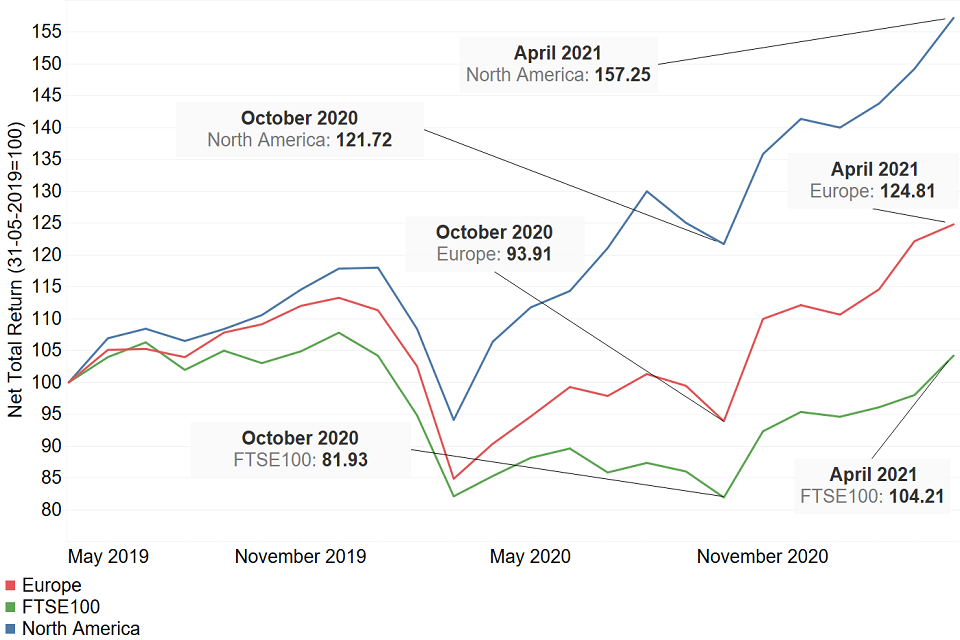
The graph below shows how the end-of-month positions have varied for the FTSE 100 between May 2019 and April 2021. The Financial Times Stock Exchange 100 Index (also referred to as the FTSE 100) is an index composed of the 100 largest companies listed on the London Stock Exchange.
The graph also compares against the North American and European MSCI indices which measures stock market performances in those areas. The graph is based on a base index of 100 for all 3 indices as at 31 May 2019.
Equities Graph
The FTSE 100 has risen in April 2021 showing an improvement for the second successive month. This continues a period of general increases in the FTSE 100 since October 2020. April shows the biggest increase in the FTSE 100 since November which could be the effects of the March 2021 budget and the easing of UK national lockdown rules.
However, the FTSE 100 has not shown the same recovery from March 2020 as the other markets. The North American Market has grown considerably over the past year and currently sits at a higher level than its pre-COVID peak. Given that all these regions have been affected by the pandemic to similar degrees, this could be explained by the composition of the FTSE 100. The FTSE is largely made up of banks, retailers and airlines; sectors which have been some of the hardest hit by the pandemic.
The long-term impact of Brexit and COVID-19 remain uncertain however there has been renewed optimism of a recovery faster than initially forecasted.
Foreign exchange
The foreign exchange rate represents the value of 1 currency in the price of another. For example, if the foreign exchange rate of the US dollar is said to be 0.50 GBP, then it costs 50p to purchase $1. Alternatively, it would cost $2 to purchase £1. This would be referred to as the exchange rate between the US dollar and the British pound.
Foreign exchange rates are an indicator for the economic health of the country. A strong currency allows the country to:
-
buy goods and services from other countries for a smaller price. The process of buying goods and services from another country is referred to as imports.
-
sell its goods and services to other countries for a higher price. The process of selling goods and services to another country is referred to as exports.
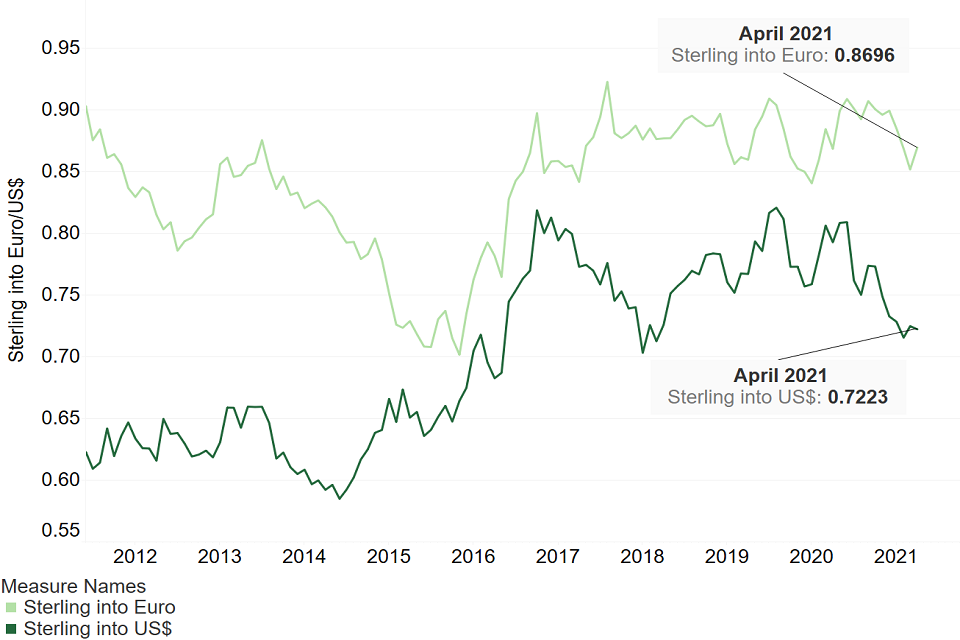
We focus on the exchange rate between the British pound and both the Euro and the US dollar. The chart below shows how these rates have varied between January 2012 and April 2021.
Foreign Exchange Graph
The US dollar rate as at April 2021 is 0.7223 British pounds, showing signs of recovery from the low of 0.7155 British pounds in February 2021. The euro as at April 2021 is 0.8696 British pounds, recovering from 0.8518 in March which was the lowest it had been since January 2020.
The slight recovery of the British pound against the dollar and the euro might reflect perceptions of optimism due to the loosening of lockdown rules and the ongoing success of the vaccine rollout.
Any material or information in this document is based on sources believed to be reliable, however we cannot warrant accuracy, completeness or otherwise, or accept responsibility for any error, omission or other inaccuracy, or for any consequences arising from any reliance upon such information. The facts and data contained are not intended to be a substitute for commercial judgement or professional or legal advice, and you should not act in reliance upon any of the facts and data contained, without first obtaining professional advice relevant to your circumstances. Expressions of opinion do not necessarily represent the views of other government departments and may be subject to change without notice.
Quality Assurance Scheme
The Government Actuary’s Department is an accredited organisation of the Institute and Faculty of Actuaries’ Quality Assurance Scheme.

QAS Logo