LFFN Interim Evaluation Schools Project
Published 17 October 2022

© Crown copyright 2022
This publication is licensed under the terms of the Open Government Licence v3.0 except where otherwise stated. To view this licence, visit nationalarchives.gov.uk/doc/open-government-licence/version/3 or write to the Information Policy Team, The National Archives, Kew, London TW9 4DU, or email: psi@nationalarchives.gov.uk.
Where we have identified any third party copyright information you will need to obtain permission from the copyright holders concerned.
This publication is available at https://www.gov.uk/government/publications/lffn-wave-1-interim-evaluation-schools-project/lffn-interim-evaluation-schools-project
For the avoidance of doubt, the principle purpose of Local Full Fibre Network (LFFN) projects are not to provide the secondary benefits laid out in this report. For Public Sector Building Upgrades (PSBU)/ Public Sector Anchor Tenancy (PSAT) and Public Sector Asset Reuse (PSAR) projects that purpose is the improvement of public sector connectivity to meet a need, generally demonstrated through a business case, either to reduce the cost of equivalent connections or to provide improved connections which will enable a concomitant improvement in productivity or the provision of public services. PSAR projects follow what is known as the Market Economy Operator Principle (MEOP), which means that they have clear projected commercial outcomes and that these outcomes have been externally validated before the projects begin. MEOP is an EU test as to whether a measure is commercial, and thus not State aid, which is a test relevant for those projects commenced prior to the end of the transition period.
The wider benefits which this report describes are secondary to these purposes; however, that does not mean that they are not of legitimate interest to government, local and central, as part of ongoing monitoring of digital connectivity.
To situate this report and the analysis within, note that it was submitted in April 2022.
1. Introduction
Ipsos MORI (with George Barrett) was commissioned by Building Digital UK (BDUK) in May 2018 to undertake an evaluation of the Wave One projects funded through the Local Full Fibre Network (LFFN). This report sets out the interim evaluation findings for the Wave One Schools projects (a Public Sector Buildings Upgrade (PSBU), which aims to provide schools with gigabit capable connections. The original aim at this stage was to provide a one year on assessment of the impacts of the PSBU projects, however the COVID-19 pandemic significantly affected delivery of connections and it was therefore decided that this point would offer a suitable time for an interim assessment. Ongoing work including a series of interviews with schools will feed into the final report due to be completed in the second half of 2022.
1.1 Evaluation aims and objectives
The key research questions for the evaluation of Wave One projects (as defined in the Invitation to Tender) are set out in the table below. These broad questions were further refined as part of an initial planning stage that was completed in May 2019, which involved the agreement of bespoke evaluation questions and an evaluation approach. This report builds on a baseline, process and early impacts assessment that was completed in July 2019 and examines the effects of the project approximately one year following the completion of physical works. This updates the work completed in the baseline report by assessing the connectivity and school level impacts using the data now available. This does not update all of the tables presented at the baseline in terms of area characteristics and instead focuses upon causal impacts on connectivity.
Owing to the limited time elapsing since the completion of the project, the primary focus of this report is on its short-term impact in terms of direct and indirect connectivity impacts as well as any direct impacts on the schools themselves. While downstream economic and social impacts are considered in this report, these types of impact will take time to arise and will be examined in more detail in the final evaluation in October 2022.
Table 1.1: BDUK Benefits Framework
| Question area | Sub-questions |
|---|---|
| What outcomes can be attributed and were they as intended? | •What is the range of local level outcomes from LFFN? •What local level changes made a difference, were there other explanations? •What, if any, were the wider benefits of LFFN? •Were there any unintended outcomes? |
| How has LFFN achieved these outcomes? | •To what extent is this affected by context or circumstance? •How can LFFN achievements be enhanced? |
| What can we learn to improve future policy designs and implementation? | •LFFN Programme • Other Government broadband infrastructure policy or programmes •Other Government future telecommunications infrastructure policy or programmes (including 5G) •Demand-led delivery approaches |
Source: BDUK Invitation to Tender
1.2 Methodology
The evidence compiled for this report comprised:
-
Review of Management Information (MI) and project documentation: Documentation on the design and the operation of the projects, such as contractual information provided by BDUK, and information about schools connected have been reviewed to aid understanding of the projects objectives and progress made.
-
Analysis of secondary data: A range of secondary sources were examined to explore short term changes in the supply and demand for FTTP in areas nearby the assets brought into use for broadband deployment with LFFN funding. This drew primarily on the Connected Nations dataset published by Ofcom which provides postcode level data on superfast and ultrafast availability and FTTP coverage. Additionally, a variety of additional official data on the evolution of the school indicators was drawn on to provide further evidence on school outcomes (though owing to lags in the production of these measures, it is not possible to draw inferences regarding the impact of the project at this stage).
-
Semi-structured qualitative interviews with project stakeholders: Consultations with stakeholders in the projects were undertaken in summer 2021 to gather views on how far the projects had delivered against their intended objectives, barriers encountered, and lessons learned. Stakeholders consulted included representatives of the lead BDUK project leads, and stakeholders from the Department for Education (DfE) involved in the delivery of projects. Interviews covered developments in the delivery and management of the project, issues encountered in delivery, and impacts of the LFFN project on organisations and local area. The interviews also highlighted key areas that may warrant further investigation in the final year of research (2022).
-
Econometric analysis: The most recent longitudinal Connected Nations dataset available at the time of research was for 2021. This data was used to explore the connectivity impacts of the projects to date in terms of FTTP availability in the area. A matching exercise was completed, matching areas around LFFN schools to similar areas located around Rural Gigabit Connectivity (RGC) schools which were expected to be delivered to in 2021, using Propensity Score Matching (PSM). The matching sought to find areas matching in characteristics including the details of the telecommunications infrastructure of the postcodes (eg distance from the serving exchange) as well as the availability of superfast and ultrafast in previous years. These RGC schools were hypothesised to share similar characteristics to those targeted by LFFN and therefore offer a more appropriate sample for matching than the general school population that would more likely be located in urban areas.
-
Interviews with representatives of some of the connected schools: A series of interviews were requested and conducted with some of the schools connected through the programme. At the time of writing 17 were completed with fieldwork ongoing, due to end in March 2022. Some of the early findings from these relevant to the discussion presented here are presented below. These will be reported on in more detail in the final stage of the evaluation.
1.3 Limitations to the findings
1.3.1 Ofcom Connected Nations data
The results make extensive use of the Ofcom Connected Nations datasets. The methodology used to compile this data has evolved and there are inconsistencies between years. For the years 2018 and 2019, there are notable decreases in some postcodes in terms of superfast, ultrafast and FTTP availability. The research team undertook analysis to compare the datasets in the two years, and presented the findings from the analysis to Ofcom. As a result of further communication between the research team and Ofcom, a change in the methodology used by Ofcom in the two years was identified. This change related to the method used to identify deliverable premises, with the addition of more premises in areas diluting coverage in some places. This means that we are unable to clearly separate the impact of changes in the data to those impacts on coverage driven by LFFN. Ipsos MORI initially conducted analysis on LFFN areas (approx. 10,000 postcodes max) which was then extended to all postcodes in the 2018 and 2019 cross sections. A fuller breakdown of the analysis conducted is available in the Annex to this report.
Additionally, for the years 2020 & 2021, the Connected Nations dataset did not include a variable for FTTP coverage. This has been replaced by a variable for gigabit connectivity, which includes FTTP but also some other connections (such as DOCSIS connections which provide speeds over 1,000 Mbps). This means that there is a large increase in the indicator in all areas between 2019 and 2020, and large increases in this variable should be viewed alongside a comparator area for context. The data also covers existing networks, and not planned future roll out, meaning that the analysis cannot control for future network provider plans.
Finally, the publicly available Connected Nations Dataset does not include a variable which provides the number of connections taken-up in each postcode. As such, it has not been possible to assess the demand-side impact of the LFFN Schools project.
1.3.2 Department for Education Schools dataset
The DfE produce annual school level statistics, covering pupil characteristics, pupil attainment and school finances, among other variables. This data is made available annually for the previous school year. However, due to disruptions caused by the COVID-19 pandemic, the most recent data (which would have been for the academic year 2019/20) has not been made available yet. The DfE expect this to be made available in the future. This means that it has not been possible to assess the impact of the LFFN Schools programme on school level indicators in the secondary data set. Therefore, the report presents variables of interest up to the most recent data available.[footnote 1]
Given the range of potential factors influencing these variables, identification of causal effects is complicated, and it may not be possible to definitively determine the impact of the connections on some of these outcomes within the confines of the data available.
1.3.3 Impact of COVID-19
It should be noted that the outbreak of COVID-19 may produce a substantial change in the wider context for the project. Social distancing arrangements have created a need for businesses and public sector organisations to find new ways of working organised around remote working where feasible. As such, improvements in connectivity induced by the programme may have longer-term and more significant benefits for the areas concerned than will be visible in this report. Improved local broadband infrastructure has the potential to increase the resilience of areas to economic disruption – and it is likely this type of effect can only be partly captured in this evaluation.
2. Schools project
This section presents the interim evaluation of the LFFN Schools PSBU project. It begins with an overview of the project, before discussing the progress made to May 2021 and the connectivity outcomes achieved since.
Key findings:
The installation of the fibre was completed by April 2021, and all 151 schools were connected, (almost all were connected by 2020). A larger number of schools were connected later than was originally anticipated, as the cost of connecting some schools was lower than anticipated meaning the programme could be extended to more schools.
However, connections to some schools were slightly delayed, resulting from the COVID-19 pandemic, which has hindered the assessment of impacts** given the data available . Therefore, it is still too early to fully assess the outcomes and impacts the project could achieve.
Early evidence from interviews that improved connections are being used to support administrative functions and teaching within schools. Teachers appear better able to access digital resources and get hands on with pupils more often with fewer issues relating to technology. There were also some anecdotal reports of satisfaction from pupils using digital resources including online learning materials.
Evidence available for 2021 does not identify any significant spill over connectivity impacts in terms of FTTP or ultrafast coverage resulting from LFFN connections delivered to schools. More time may be required for these to materialise[footnote 2]. Interviews with schools also suggest some issues resulting from a lack of available connections in surrounding villages. Schools with connections were better able to support remote learning through the COVID-19 pandemic but parents sometimes lacked suitable connections.
Resource remained a significant barrier particularly with testing capacity required to ensure that the work had been completed to specification. Remedial works were also required and undertaken where build did not meet the required specification after installation. There were issues with fibre laid at 65 sites and this contributed to the delay in completing the work prior to COVID-19 becoming a further issue, impacting resource and the ability for testing teams to access infrastructure. COVID-19 further impacted delivery with further delays to the fibre supply.
ThinkBroadband data allows for an examination of the number and type of suppliers operating in the areas surrounding schools and brief analysis did not suggest significant change in the number and type of suppliers operating around LFFN schools in 2020.
2.1 Project overview
This section outlines the LFFN Schools PSBU project and the anticipated process by which it was expected to deliver anticipated impacts on FTTP coverage, impacts on the schools and wider economic and social impacts. [footnote 3] This framework was agreed with BDUK during the planning phase of the evaluation in 2019 following a series of consultations with BDUK and key stakeholders, review of project documentation, literature review and review of secondary data.
2.1.1 Description of the project and objectives
The LFFN Schools PSBU project involves the delivery of gigabit capable connections to 151 primary schools in England. Initially, the project aimed to provide upgrades to 104 primary schools. However, as the upgrades were less expensive than originally planned, the project expanded the number of schools receiving upgrades to 151 schools. This forms the first example of a PSBU project delivered through the LFFN programme.
The improved connectivity at the schools is expected to provide positive outcomes for the schools and indirectly for the local area. Within schools it is anticipated that the improved connectivity will allow teachers to access a wider variety of teaching materials, pupils to access online resources in the classroom and provide efficiency gains for support staff within the school. The upgrades were mainly delivered by OpenReach, who laid the fibre to connect existing networks to the schools, whilst a small number of upgrades were delivered by Wessex Internet. Schools may not necessarily be purchasing services through BT or Wessex Internet – other Internet Service Providers (ISPs) can provide services to the schools using the upgraded network
Figure 2.1: Location of schools included in the Schools PSBU project
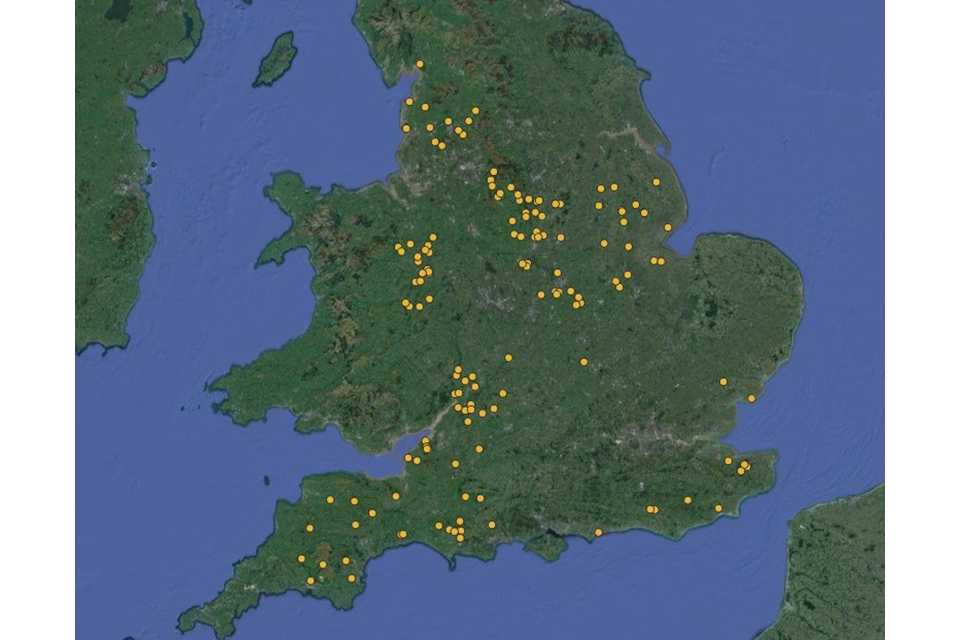
Location of schools map
Source: BDUK Project Management Information
2.1.2 Expected outcomes and impacts
The project was expected to lead to several medium and longer term outcomes and impacts that can be summarised into the following categories:[footnote 4]
-
School level outcomes: The provision of faster internet connection was expected to have a beneficial effect on schools, through cost savings (including reducing licence costs, moving to online communication systems and enabling the ability to move to cloud based solutions to reduce financial costs and reduce energy costs), improve efficiencies and provide more online learning materials to support teaching and improve pupil attainment.
-
Connectivity outcomes: the network delivered to the schools was expected to reduce the marginal cost of further fibre investment, meaning new areas will likely become commercially viable for suppliers. These additional investments were expected to encourage suppliers to make additional investments in fibre connectivity, increasing the size of the network in the medium and long term.
-
Linked to the above, end users would expect to experience improved speed and reliability in their connectivity service. More extensive FTTP deployments can be expected to produce a range of network benefits in terms of increased speeds, latency, and resilience. FTTP also has potential to reduce maintenance costs.
-
On the demand side, direct take-up effects are expected to arise as public sector organisations connected to the network take-up FTTP connections whilst businesses and residents would likely benefit should spill over build occur. For businesses and public sector organisations in West Sussex, this benefit could be due to better data storage and processing power through access to the cloud and faster transmission of files and records, leading to productivity gains, or by supporting more employees to telework.
-
-
Downstream economic impacts: Wider access to FTTP connections was expected to lead to increases in firm productivity (increase firms’ consumption of telecoms services, or increase the efficiency of telecoms use, potentially raising average labour productivity). In the medium term, adoption of FTTP may raise productivity in other ways – for example if firms have access to higher quality labour inputs, or if they can develop more efficient business models.
-
Market entry: By providing easier access to FTTP connections, new firms may be able to start up close to the upgraded schools (for example digital businesses which require reliable and fast internet connections).
-
Business relocations: The availability of a full fibre network close to upgraded schools is also expected to lead to a range of firm relocation effects. The increased desirability of areas with a full fibre network is expected to attract businesses to these areas and in particular young start-ups dependent on full fibre connectivity or similar technologies.
-
Firm expansions and market entries: As a result of the provision of FTTP, connections could, in turn, create jobs (specifically in digital industries). This could in turn also reduce unemployment in these areas.
-
-
Social and environmental: Specific social and/or environmental effects were not expected. However, as the project has the potential to lead to spill over FTTP build, general social and environmental impacts could potentially be anticipated. This may include reduced commuting enabled by remote working, increases in leisure time or reducing the digital divide in the community through, for example, digital education programmes. The latter stages of the evaluation will explore the extent to which the project led to these types of impact.
A summary of the initiative’s pathways to impact, outlining how the inputs and activities are expected to translate into immediate outputs, short and medium-term outcomes and longer-term impacts, is set out in Figure 2.2.
Figure 2.2:Schools PSBU project logic model
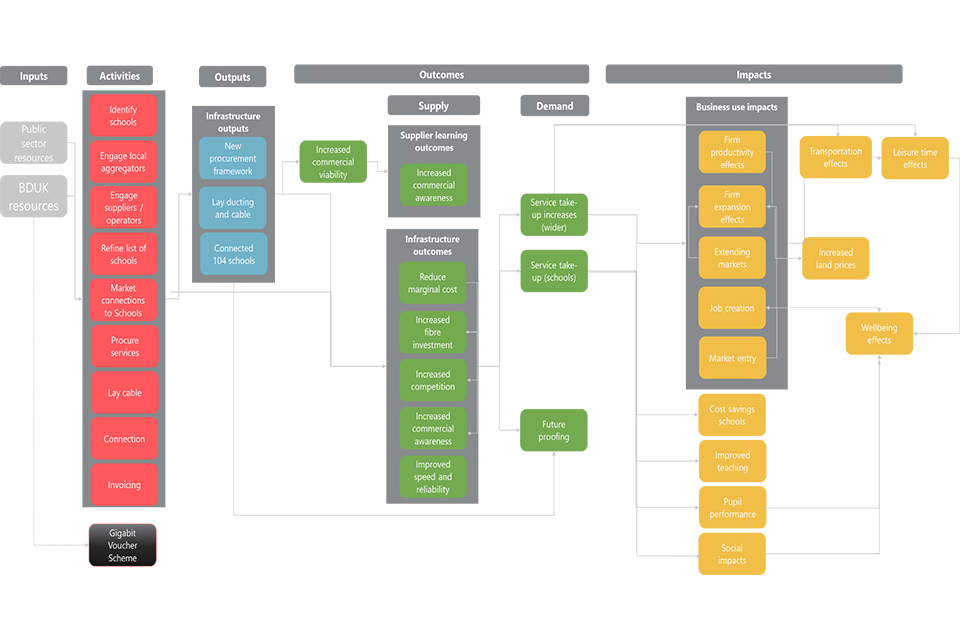
Schools project logic model
2.2 Progress to date
This section provides an update on the Schools PSBU project as of March 2022. It draws upon background data and documentation and consultation evidence with BDUK and DfE stakeholders, to provide an overview of emerging outcomes and lessons learned.
2.2.1 Activities and outputs
Completion of the connections to schools
The fibre cable was laid to schools in the period between Autumn 2018 and the end of 2020. The data provided indicates a total of 151 schools have been connected to fibre networks. The initial target for the project was to connect 104 schools, but as cost of the connections to many of the schools was lower than anticipated, the project was able to connect more schools. The majority of schools were connected in 2019 (131 schools connected in 2019, one school connected in 2018 and 14 connected in 2020).
The key characteristics of the schools connected through the LFFN programme are presented here. This shows that a variety of schools have been connected through the programme:
-
Type of school: The majority of schools connected through the LFFN Schools project were local authority maintained schools (105 out of 146 schools that could be matched to DfE data), although a significant number of schools were Academies (40 out of 146). There was a single special school included in the LFFN Schools project.
-
Size of school: there was a variety in the size of schools supported. Around 40 percent of the schools connected through the LFFN programme were small schools with fewer than 100 pupils (with 10 percent having fewer than 50 pupils), and a further 30 percent had between 100 and 199 pupils. However, 27 percent of schools had more than 200 pupils.
-
Rural Urban indicator: Only a small number of LFFN schools were located in major or minor conurbations (three schools), and a further 47 schools were located in cities and towns, meaning one third of schools were located in urban areas. Two thirds of the total number of schools were located in rural areas, with over half of total schools (79 of 151) located in villages or hamlets, and 15 percent located in town fringes.
The schools connected were located across England, in 20 different local authority areas. The table below presents the number of schools connected by local authority area.
Table 2.1: Public sector building locations connected by area
| Local Authority | Schools connected | Local Authority | Schools connected |
|---|---|---|---|
| Derbyshire | 26 | Kent | 4 |
| Shropshire | 22 | Wiltshire | 2 |
| Gloucestershire | 18 | Peterborough | 1 |
| Lincolnshire | 16 | Nottinghamshire | 1 |
| Dorset | 12 | Somerset | 1 |
| Lancashire | 12 | Bath and North East Somerset | 1 |
| Leicestershire | 11 | Nottingham | 1 |
| Devon | 11 | Cumbria | 1 |
| North Somerset | 6 | Northamptonshire | 1 |
| East Sussex | 4 |
Source: BDUK MI
The provision of fibre connections to 151 schools demonstrates that the project output of connecting schools has been fully achieved.
Funding
Data for the total cost of the funding awarded to schools has been provided by BDUK, although this does not include any administration costs associated with managing and delivering the project. The table below presents the total amount of funding awarded and the average size of the grant provided. Whilst LFFN school connections come with high costs, whether urban or rural schools, there were no noticeable patterns between the size of the grant awarded and whether the school was in a rural or urban area, or the size of the school. This could be expected given that the amount of grant was linked to the cost of the connection which would be linked most closely to the distance from established network. Rural areas in general present higher costs because of the distance from the network, therefore this may be evidence that the rural schools being connected through LFFN were potentially easier to reach given the potentially similar distances to the network.
Table 2.2: Funding of the Schools PSBU project
| Value (£’000) | |
|---|---|
| Total cost of funding awarded to schools | £2,900 |
| Average value of funding awarded to schools | £19 |
| Average grant awarded to maintained schools | £19 |
| Average grant awarded to academy schools | £20 |
| Smallest grant | £0.8 |
| Largest grant | £54 |
Source: BDUK MI
Local bodies, such as the East Midlands PSN and local authorities contributed significantly to the programme. This was primarily in terms of staff time, which involves some regional management of the project and negotiating with schools to utilise the PSBU grant offer to obtain fibre connectivity.
Additionally, the DfE contributed staff time to the project, in the form of identifying potential schools to be included in the project, negotiating with the schools and suppliers and managing the project. BDUK transferred the grant funding to DfE, who then transferred the grant funding value to the schools once the contractor raised an invoice. There was no capital investment from the DfE. These costs are not included in the funding estimates presented in the table above.
The provision of funding to the schools to pay for the connections demonstrates that the project output of the DfE passing funding to schools has been achieved.
2.3 Connectivity outcomes
This section provides an update of the connectivity outcomes achieved to December 2021, drawing on secondary data analysis using Ofcom Connected Nations data. It should be noted that as the primary fibre network connections to schools were only provided in 2019, it may still be too early for wider connectivity outcomes to have been achieved in the local area.
2.3.1 FTTP and ultrafast coverage
It was anticipated that the marginal cost of investment for future investment by network providers was expected to fall following the completion of the fibre connections to schools. In turn, this was expected to make it commercially viable to deploy FTTP networks in the vicinity.
The figure below shows the development of FTTP coverage and ultrafast availability amongst premises within 1km of the LFFN schools, based on the Ofcom Connected Nations dataset.[footnote 5] This presents the evolution of FTTP and ultrafast coverage in postcodes close to LFFN schools prior to the completion of the LFFN funded project and in most cases one year post completion. FTTP coverage has risen slowly from between one and two percent in 2017 (when LFFN funding was awarded and the first year for which FTTP data is available) to around 16 percent in 2020. However, this remains below the national average as of 2020 which was around 27 percent. The availability of ultrafast connectivity has also risen over this period from one percent in 2015 to 36 percent in 2020 which is below the national average of 59 percent.
The figure also shows the evolution of FTTP and ultrafast coverage in postcodes within 1km of RGC schools to be upgraded in 2021. This shows that the coverage of FTTP has increased at a slower rate than for LFFN schools (from between one and two percent in 2017 to seven percent in 2020) and ultrafast has increased from one percent in 2015 to ten percent in 2020. This is much lower than in the areas around the LFFN schools, although the large increase in ultrafast coverage in LFFN schools areas seems to have occurred between 2016 and 2018, prior to the LFFN connections being provided.
Schools consulted in the research were also generally not aware of widespread indirect connectivity outcomes in their local areas. In a small number of cases, it was reported that some parents had taken up faster broadband connections, however it was not possible to ascertain the nature of the connection eg technology.
Figure 2.3: FTTP and Ultrafast Coverage on postcodes within 1km of LFFN schools and 1km of RGC schools not yet upgraded postcodes
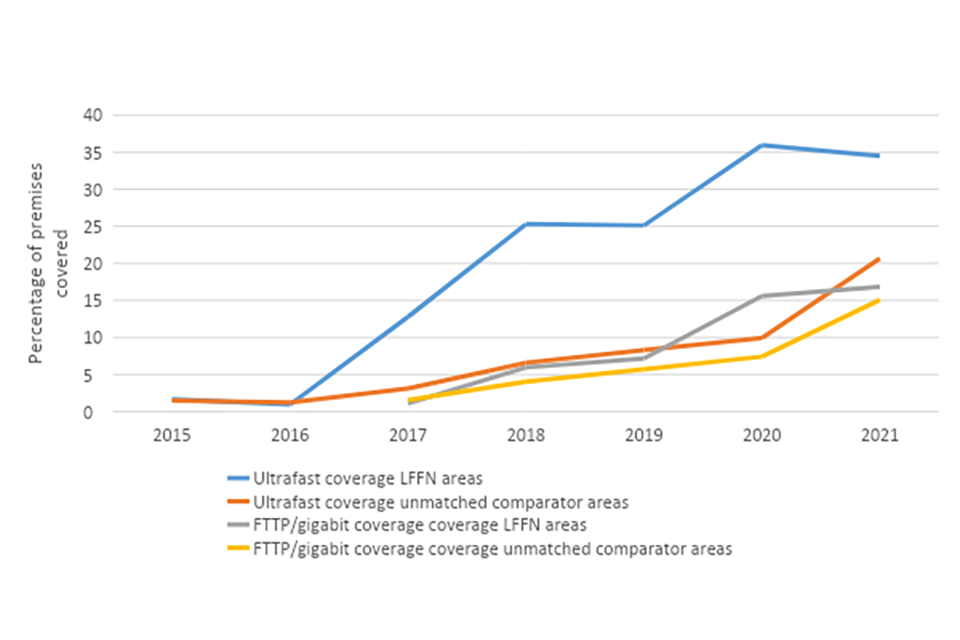
Ultrafast coverage on postcodes
Source: Connected Nations, Ofcom
Impact of the LFFN on fibre coverage
To provide an assessment of the extent to which the changes observed in FTTP and Ultrafast coverage could be attributed to LFFN at this stage, an econometric exercise was undertaken comparing the areas within 1km of the LFFN schools to similar areas surrounding schools that expected to be upgraded in 2021 as part of the RGC programme. The details of the matching exercise are provided in the Annex. There were differences between the profile of postcodes surrounding LFFN schools and the RGC schools, most notably the proportion of LFFN schools which were in urban areas (in the ONS classification) and fell within the footprint of Virgin Media. The Propensity Score Matching (PSM) approach used attempted to account for these differences.
The trends in the matched postcodes for FTTP and ultrafast coverage are presented in the figures below. This shows that in terms of ultrafast coverage, there was a large increase in coverage in LFFN schools areas between 2017 and 2018 which was not observed in the matched postcodes around RGC schools, but from 2018 to 2021 the evolution in coverage is broadly comparable. For FTTP/gigabit coverage, the evolution in coverage in postcodes around LFFN school areas and RGC school areas is comparable.
These figures would suggest that there has been limited impact on ultrafast and FTTP coverage in local areas as a result of the LFFN schools programme by 2021. At this stage, and without consultations with network providers and builders, it is not clear why this is the case.[footnote 6] It could be due to a number of factors that will be explored in the next stage of the evaluation. For instance, the areas surrounding LFFN schools may still not be desirable for network providers or a lack of awareness of availability may be restricting spill over coverage.
Figure 2.4: Change in ultrafast coverage in areas within 1km of the LFFN schools and in matched areas within 1km of RGC schools
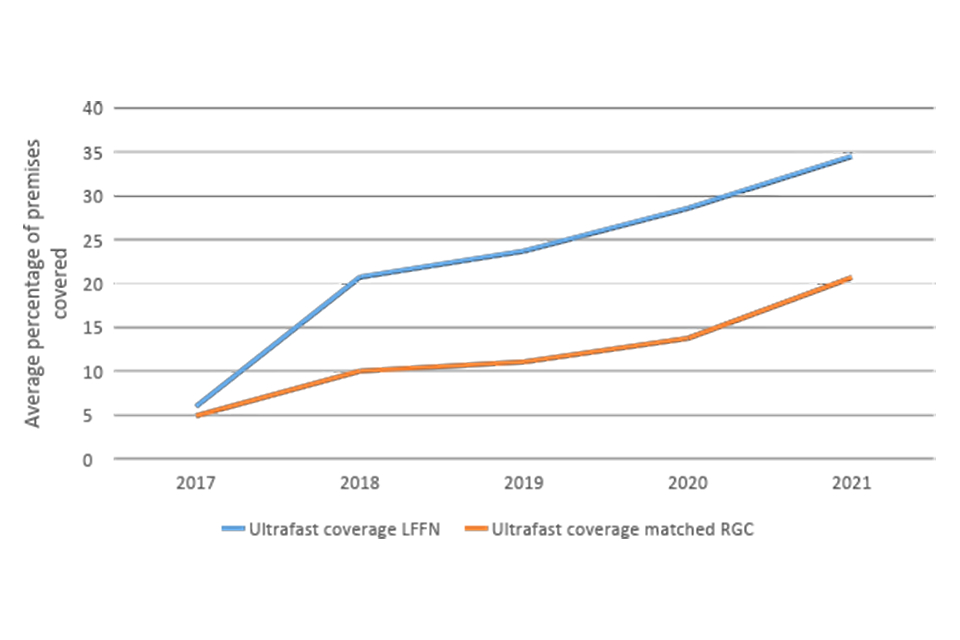
Change in ultrafast coverage
Source: Ofcom Connected Nations
Figure 2.5: Change in FTTP coverage in areas within 1km of the LFFN schools and in matched areas within 1km of RGC schools
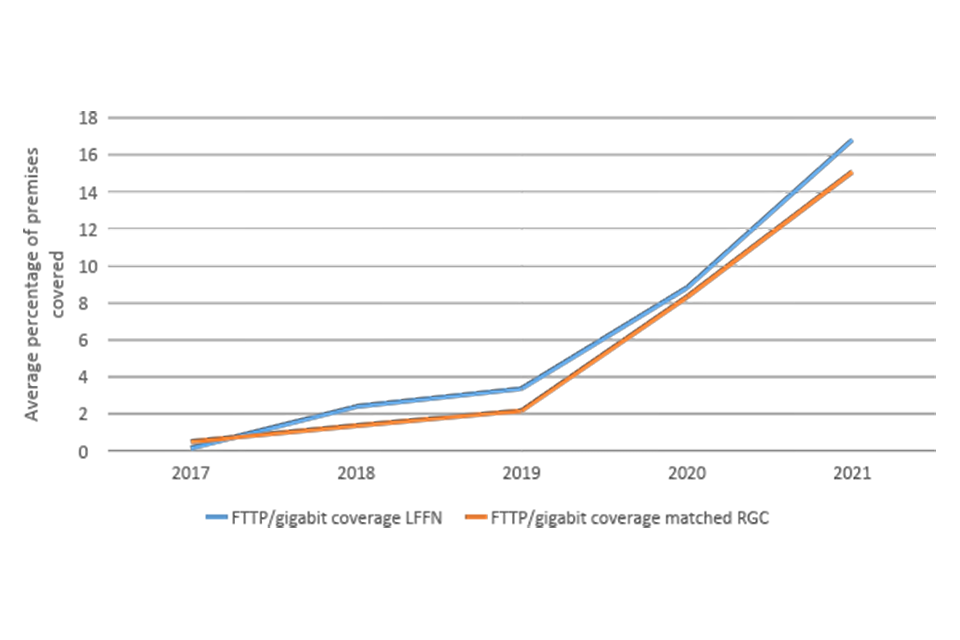
Change in coverage within 1 kilometre of the schools
Source: Ofcom Connected Nations
To explore the impact of the LFFN Wave One Schools project on FTTP and ultrafast coverage further, an econometric analysis was also undertaken using a fixed effects analytical framework. For more details on the approach used and detailed results please see the Annex.
This econometric modelling also did not find any significant impacts of the LFFN programme on ultrafast or FTTP coverage by 2021. However, the approach is not considered reliable when analysing FTTP given the change in the definition of this variable for 2020 and 2021 Connected Nations data upon which the analysis is based.
2.4 Baseline school outcomes
It has been possible to consult with some of the schools which benefited from the LFFN Schools programme. At the time of reporting these interviews were ongoing and therefore early findings have been incorporated where possible on the direct effects the enhanced connectivity has had on schools.
However, the primary focus of this section is on analysis of the available secondary data which provides information about several of the school level outcomes highlighted in the theory of change. The findings from this analysis are presented below, with a comparison of outcomes for LFFN schools and for RGC schools which were scheduled to be upgraded in 2021 (selected as a comparator group).
It should be noted that because of the COVID-19 pandemic, the most recent school level data available is for the school year 2018/19. This precedes the installation of most of the Fibre network connections to schools. Therefore, this should not be seen as any evidence of outcomes being achieved – rather the trend on the outcome variables up until the installation of the fibre networks.
The school level outcomes will be explored in more detail in the final evaluation in 2022 which will make use of more recent data where available.
Use of improved connections
Early interviews with representatives of some of the schools connected through LFFN identified some of the uses for the connections. Respondents reported that connections had primarily been useful in supporting administrative functions by making related tasks quicker to complete.
Teaching had also been affected in a number of cases with more stable connections enabling the use of online learning tools to support teachers in classes. Early evidence suggests that pupils were enjoying the variation in teaching methods but that it was not yet clear the extent to which this would have knock on impacts on factors such as attainment and absence.
Self-generated income
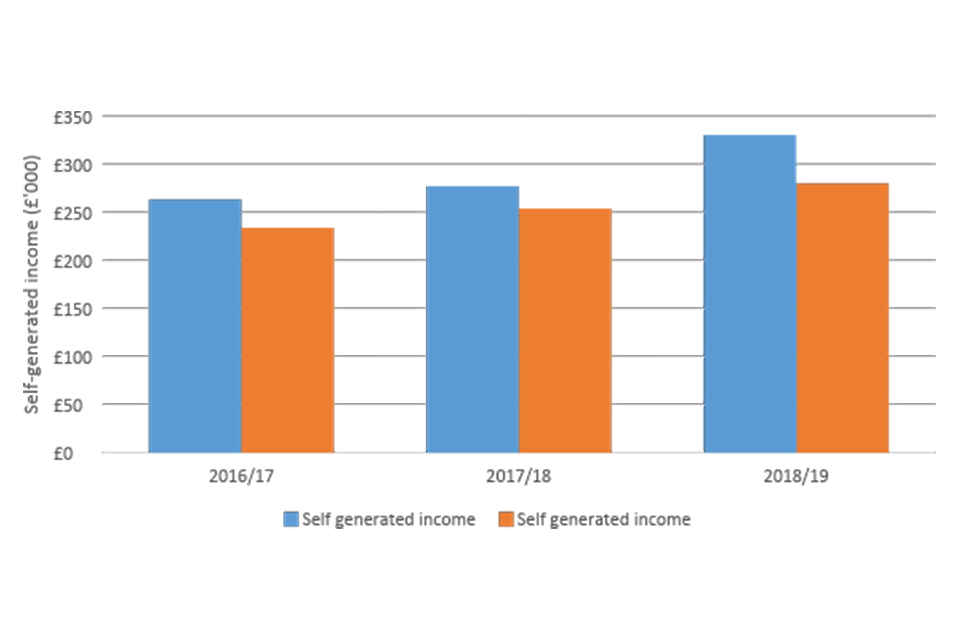
The provision of fibre internet connections to schools could help support them in generating new streams of income, for example through providing more services to the local community. The DfE statistics provide data on the value of self-generated income for schools. The figure below shows that between 2016/17 and 2018/19, on average LFFN schools had increased their self-generated income from £263,000 to £330,000. There was also a slight increase in the self-generated income for RGC schools which were expecting to receive their connection in 2021, from £233,000 to £280,000. Evidence from the school interviews completed to date did not identify income as something that was significantly impacted by improved connections and requires further exploration.
Figure 2.6: Self-generated income at LFFN schools and RGC schools to be upgraded in 2021, from 2016/17 to 2018/19
Self-generated income
Source: DfE schools statistics, matched to BDUK MI
Expenditure
The provision of faster internet connections was expected to have an impact on school expenditure. Findings from previous research suggested that schools could change the ways in which they communicated with parents and carers, and that they could combine their phone and internet connections (running their phone system through their internet connection) to save money. It was also suggested that there could be efficiency savings in administration and teaching preparation tasks. These outcomes could have an effect on the amount each school is spending on different expenditure items. This is explored in the Schools expenditure data from the DfE. This does not cover the period where the connections had been provided to LFFN schools.
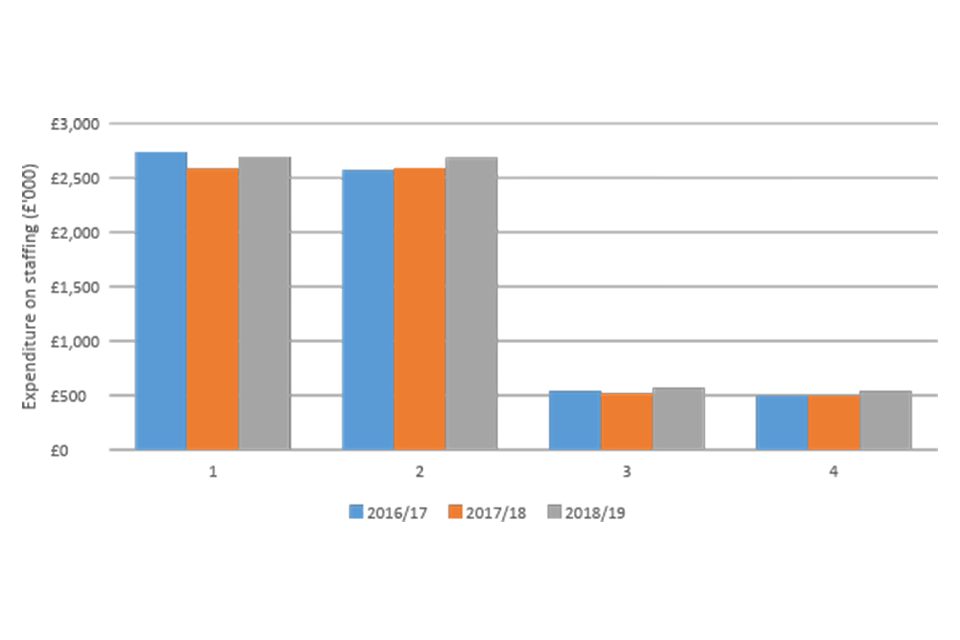
The figure below shows that the expenditure on teaching staff at both LFFN schools and RGC schools to be upgraded in 2021 remained relatively stable at an average of a little over £2.5 million. Similarly, the expenditure on backroom staffing had remained fairly consistent for both groups at around £500,000.
The level of expenditure on a selection of other categories was also explored, and showed that in the period 2016/17 to 2018/19, there had been a similar level of expenditure on ICT equipment in LFFN and RGC schools (an average of between £70,000 and £80,000), and both sets of schools had seen a slight increase in expenditure on energy and learning resources.
In early interviews with school representatives, it was suggested that on the whole costs would not be expected to decrease immediately but were more likely to fall in the medium term as they shift to alternative methods and practices. Things appear to be complicated by the lack of digital infrastructure in some of the very rural areas where parents still lack the means to access connectivity quickly and reliably.
Figure 2.7: Expenditure on staffing at LFFN schools and RGC schools to be upgraded in 2021, from 2016/17 to 2018/19
Expenditure on staffing
Source: DfE schools statistics, matched to BDUK MI
Figure 2.8: Expenditure on ICT, Energy and learning resources at LFFN schools and RGC schools to be upgraded in 2021, from 2016/17 to 2018/19
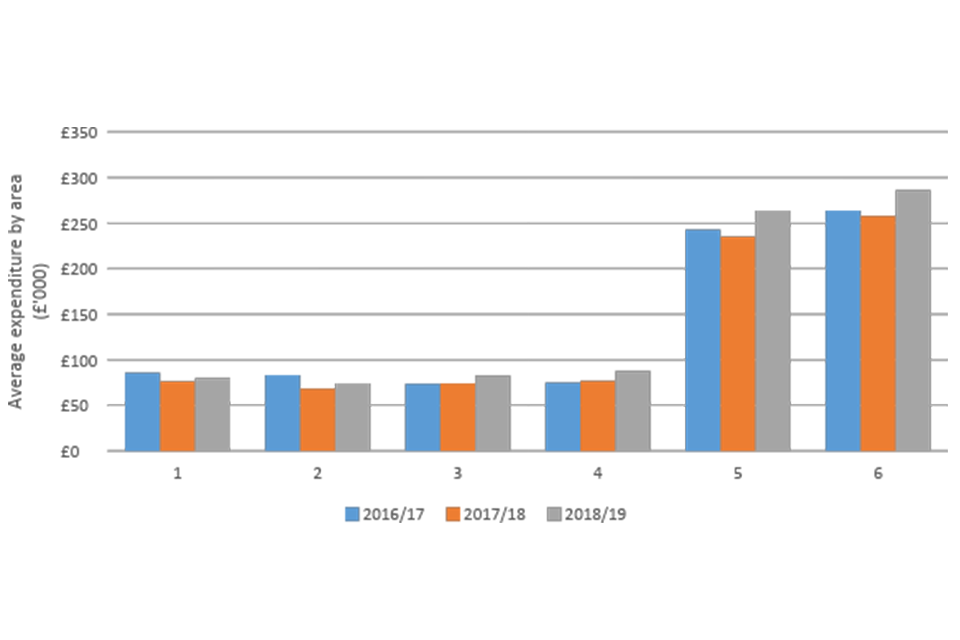
Expenditure on information technology, energy and learning resources
Source: DfE schools statistics, matched to BDUK MI
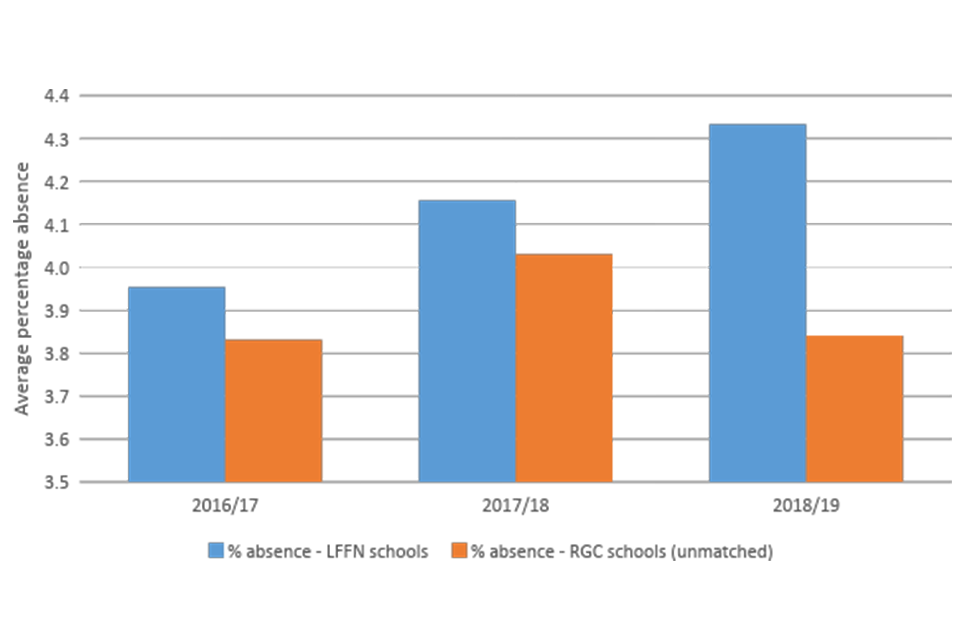
Absence
The level of absence within schools has been explored using DfE data. The chart below presents the rate of absence in schools which have received LFFN funding and those schools that were expecting to receive RGC funding in 2021. This shows that in the period from 2016/17 to 2018/19 (prior to most schools receiving their enhanced connection), there was a slight increase in the rate of absence at LFFN schools (from around 3.9 percent to over 4.3 percent). This increase was not observed in RGC schools, where despite a slight increase to 2017/18 the absence rate declined again to 2018/19.
Impacts on absences were not considered to be likely at this stage by schools. The general view across those consulted was that access to digital resources was only a marginal factor on the absence rate and that things such as home living conditions and socio-economic factors would be the dominant causes for increased rates.
Figure 2.9: Absence rate at LFFN schools and RGC schools to be upgraded in 2021, from 2016/17 to 2018/19
Absence rate at LFFN schools
Source: DfE schools statistics, matched to BDUK MI
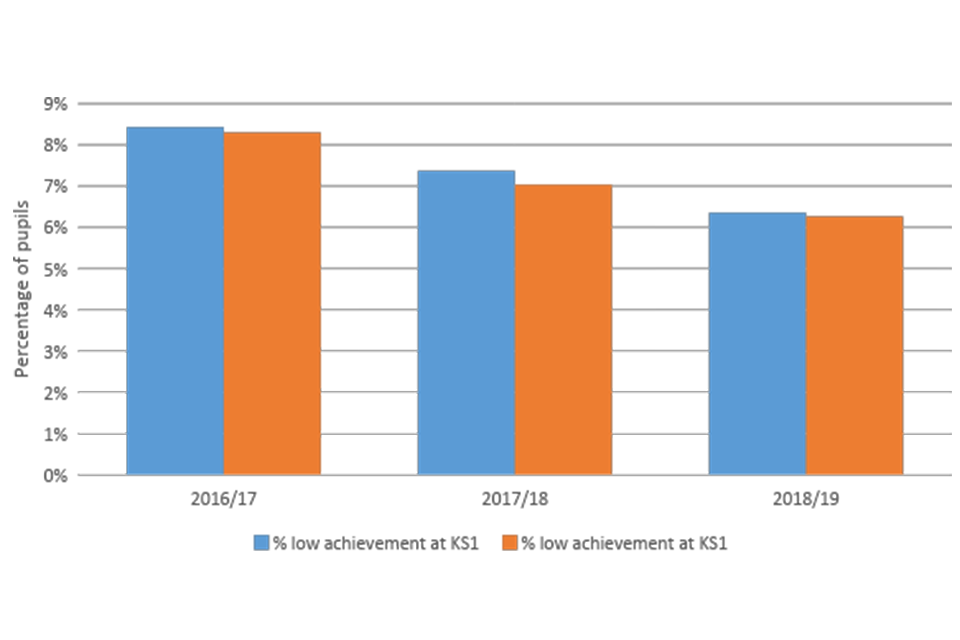
Attainment
In the longer term, it is anticipated that the provision of faster internet connections will improve attainment at schools through the introduction of new learning materials and improved attendance and engagement among pupils. The figures below present two attainment indicators included in the DfE statistics, the percentage of Key Stage 1 pupils with low achievement and the percentage of Key Stage 2 pupils reaching expectations. This shows that prior to most of the connections being made, the proportion of pupils with low achievement at Key Stage 1 was decreasing at both the LFFN schools and the RGC schools expecting an enhanced connection in 2021, from over eight percent to just over six percent. At Key Stage 2, the proportion of pupils reaching expectations has remained fairly consistent at between 62 and 67 percent at both LFFN schools and RGC schools expecting to be upgraded in 2021.
Schools consulted in the research so far suggested that there is likely to be a benefit in terms of attainment, but it was not clear the extent to which they could be identified. There was a consistent view that these outcomes were far more long term and would bump the average attainment of schools up marginally over the course of a few years as the schools adapt their practices.
These outcomes will be explored in more detail in the final evaluation in 2022.
Figure 2.10: Percentage of Key Stage 1 pupils with low achievement at LFFN schools and RGC schools to be upgraded in 2021, from 2016/17 to 2018/19
Percentage of Key Stage 1 pupils with low achievement
Source: DfE schools statistics, matched to BDUK MI
Figure 2.11: Percentage of Key Stage 2 pupils reaching expectations at LFFN schools and RGC schools to be upgraded in 2021, from 2016/17 to 2018/19
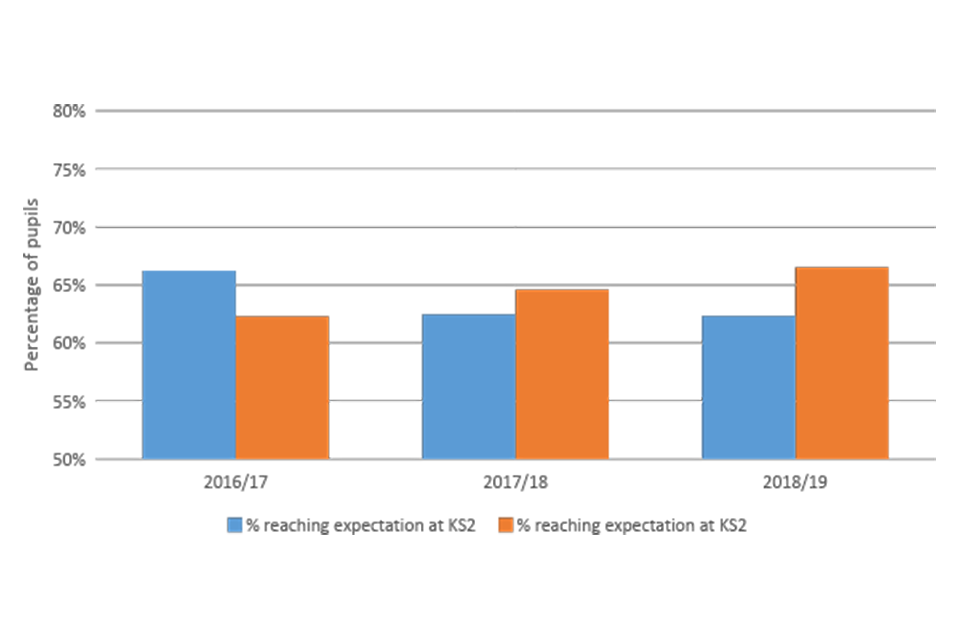
Percentage of Key Stage 2 pupils with low achievement
Source: DfE schools statistics, matched to BDUK MI
2.5 Emerging market outcomes
The DfE used the LFFN programme to negotiate with Openreach about the product they were offering as part of the LFFN programme. Under the existing suite of products Openreach offered, there were no suitable products for the DfE. The closest was “Fibre on Demand”, which would provide FTTP connections (including capital build). However, these contracts were delivered over a longer period of time than DfE wanted (usually longer than a year), and the number of connections Openreach were allowed to deliver for this product was 20 per month (an Openreach limit). This product would not work for the project (too many schools, too long delivery time, as the LFFN project needed to be completed in a shorter timescale to generate learning for other programmes). Due to the scale of the project (nearly £3 million) and the large number of connections they wanted, the DfE were able to encourage Openreach to offer a new product.
Therefore, Openreach developed a new product specifically for this project called ‘Full Fibre Infrastructure Build’. The product connected buildings to existing Openreach fibre spines. The new product was based on organisations (in this case the DfE) asking for a high volume of connections. The components of the product ensured a faster turnaround of the connection. These components included:
-
Desk based assessment of the requirements of the connection and cost (rather than a site survey
-
Price cap if the estimated cost of the connection was higher than the desk based estimate, if the cost was lower the school paid the lower price
-
Shorter build time. The targeted build time was 13 weeks. This was achieved by introducing a new working practice that if a problem was discovered the build activity did not stop until the problem was rectified and then start again – the build continued on the other side of the problem and then complete the connection once the problem was fixed. This was possible as there were designated contractor teams to deliver this product – they were not being drawn in to other Openreach projects (Figure 2.12 below illustrates the new delivery model).
-
Designated project managers for the product at Openreach to ensure delivery
Figure 2.12: New delivery model for FFIB
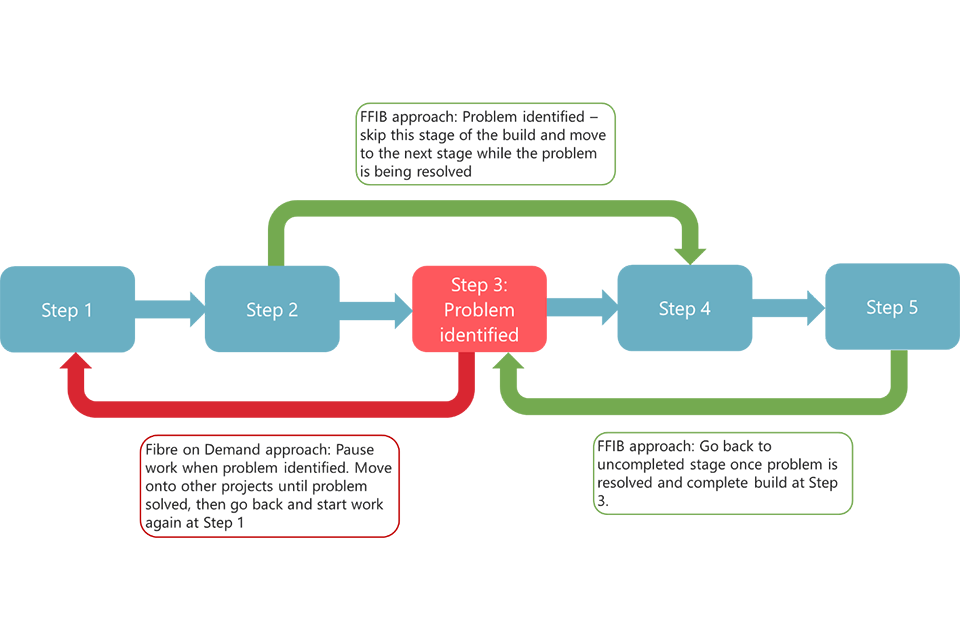
New delivery model
Source: Ipsos MORI visualisation of qualitative interview findings
This approach had the benefit to the DfE of having a known maximum cost and a shorter delivery time. This allowed them to plan with more certainty how many schools they could upgrade. It benefitted Openreach as it allowed a high volume of contracts from schools (there was a risk that they could lose money on individual contracts with schools, but they looked across the whole portfolio of the product to inform whether it offered value for money).The evidence gathered identifies the development of the FFIB model as a positive outcome from the LFFN programme with the potential for use in future projects. [footnote 7]
The development of the FFIB product was successful in reducing delivery time at a known maximum cost. In turn this allowed for better planning and the delivery of a higher volume of contracts.
2.6 Public sector learning
The delivery of the LFFN schools project has led to several learning opportunities for the public sector. In addition to the development of the market product described above, there has also been significant learnings from the LFFN project in terms of how to deliver similar projects in schools. These include:
-
Communication with schools: The project initially made contact with schools directly from BDUK, however they found that engagement with schools was low using this approach. Therefore, the project adapted and utilised the DfE and local aggregators to support the engagement with schools in later stages, and this approach worked well in securing engagement with schools.
-
Invoicing: The project arranged for the invoice for the network connection to be provided to the schools after the work had been completed by Openreach, rather than before the work commenced. Additionally, because the price was agreed in advance, the DfE transferred money with the value of the invoice to schools in advance of Openreach issuing the invoice. This approach provided schools with reassurance that they could pay the invoice, as the schools would not have had sufficient capital to pay the invoice and wait for reimbursement from DfE / BDUK. Due to this lack of capital, stakeholders felt it was unlikely that schools would have upgraded their internet connection in the absence of the programme.
-
School infrastructure: Following the connection of schools to the faster internet connection, stakeholders reported that some schools were not able to fully utilise the new internet connection. This was because the internal infrastructure at the schools (routers, network wiring, computers and laptops) were not equipped to use the faster internet speeds. Therefore, schools needed internal upgrades to generate the benefits of the LFFN programme. The DfE has responded to this by launching the Connecting Classrooms Programme, which provides funding to the LFFN schools (and those receiving upgrades through the RGC programme) to upgrade their internal infrastructure. This programme would not have been introduced in the absence of the LFFN (and RGC) programmes.
3. Annex
Ofcom Connected Nations data changes
Ipsos MORI have compared the 2019 Ofcom Connected Nations data to that of 2018 (re-downloaded latest copies of each set to ensure these are up to date). Having now completed further analysis on the LFFN areas, there are definite differences in terms of ultrafast availability with these evident on the small areas Ipsos MORI has conducted analysis on (approx. 10,000 postcodes max).
In summary, the number of postcodes across both datasets were very similar. There were just 57,568 postcodes included in the 2019 which were not in the 2018 dataset. A further 6,141 were in 2018 but not 2019 and 1,619,056 were in both.
However, when comparing the key availability figures there were decreases in superfast, ultrafast and FTTP. Ipsos MORI are not completely certain as to what effect this will have yet but it does not look to impact superfast availability enough for this analysis. In the case of LFFN where ultrafast is of more interest there seems to be significant changes.
The tables below show the proportion with increasing, decreasing and stationary availability:
Table A.1: Change 2018 to 2019 data
| Superfast | Ultrafast | FTTP | |
|---|---|---|---|
| Down | 5.2% | 12.2% | 1.4% |
| Same | 85.4% | 74.9% | 88.8% |
| Up | 9.4% | 12.9% | 9.8% |
Source: Ofcom Connected Nations
Table A.2: Summary statistics for change variables
| Variable | Observations | Mean | Stf. Dev. | Min | Max |
|---|---|---|---|---|---|
| Change in Superfast availability (%) | 1,615,668 | 1.102826 | 14.59872 | -100 | 100.1 |
| Change in Ultrafast availability (%) | 1,615,668 | 2.705448 | 28.1401 | -100 | 100 |
| Change in FTTP availability (%) | 1,615,668 | 3.724803 | 19.47962 | -100 | 100 |
| Change in Ultrafast connections (#) | 1,171,617 | 0.062637 | 2.653258 | -2600 | 79 |
| Change in Superfast connections (#) | 1,171,617 | 1.653238 | 4.126515 | -2588 | 74 |
Source: Ofcom Connected Nations
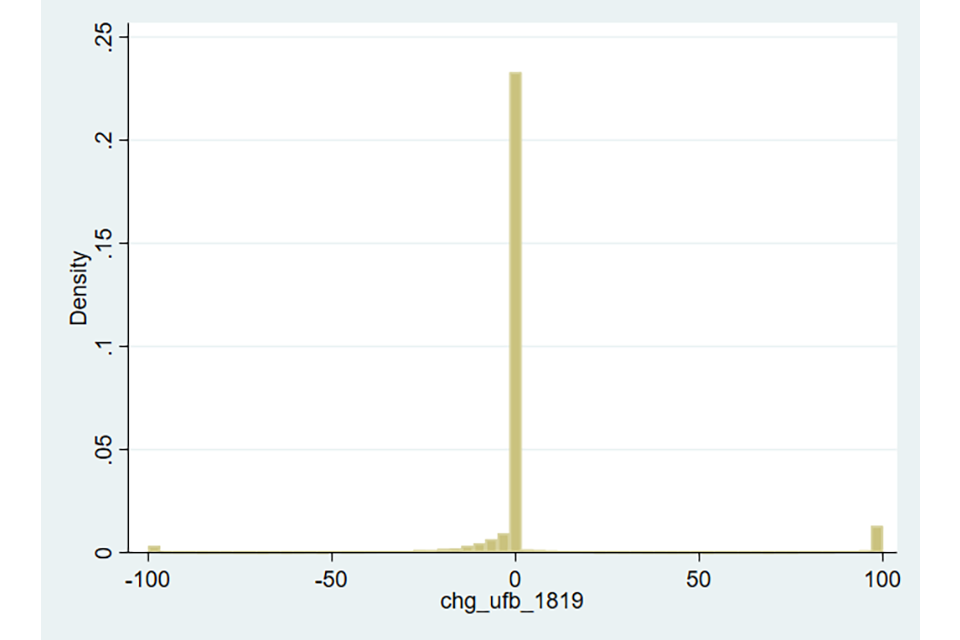
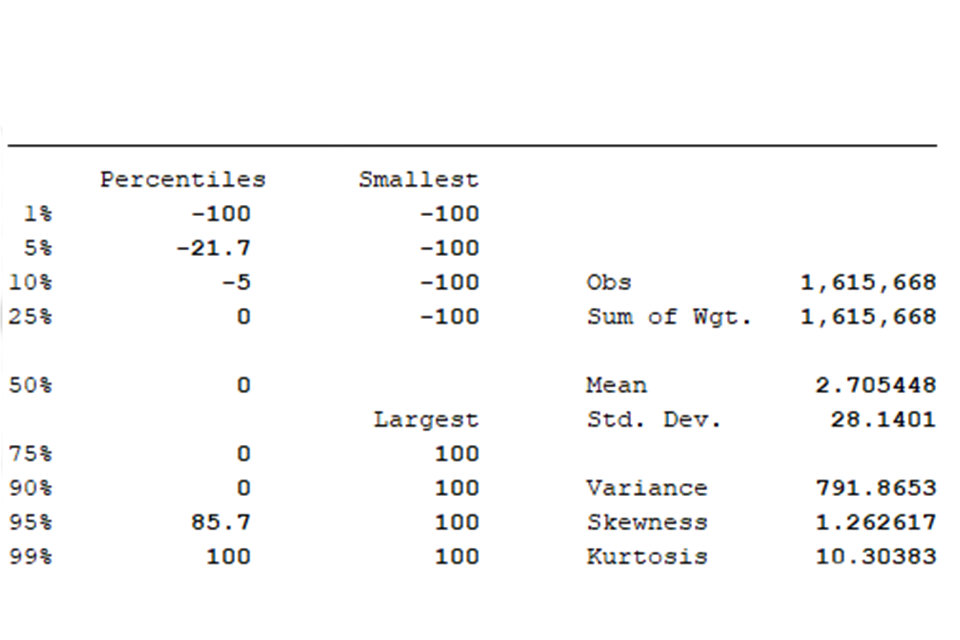
Ultrafast seems to be most affected by decreases in availability but superfast is too to some extent. The above shows how extreme some of the differences are with regards to the min values but histograms of ultrafast and superfast availability highlight a spread of negative values (see figure below). The percentiles for ultrafast availability are below for example:
Figure A.1: Distribution of change in ultrafast coverage between 2018 and 2019

Distribution of change in ultrafast coverage between 2018 and 2019
Source: Ofcom Connected Nations
Figure A.2: Distribution of change in ultrafast coverage between 2018 and 2019
Distribution of change in ultrafast coverage between 2018 and 2019
Source: Ofcom Connected Nations
Figure A.3: Change in the percentage of premises on postcode with Ultrafast available
Distribution of change in ultrafast coverage between 2018 and 2019
Source: Ofcom Connected Nations (2018 and 2018 restated)
The 2019 Methodology report (see historic changes on page 10) cites a change in approach which may be the cause of decreases observed. The comparisons Ofcom ran using the new approach on the 2018 data showed that the 2018 coverage figures on aggregate would be lower with this new approach (reflected in some changes in 2018 figures in this report compared with the Baseline report submitted last year).
From what Ipsos MORI understands, the new approach (Service Delivery Address or SDA) creates a premise base using addresses that more accurately constitute those that a service could be delivered to. The result is a larger overall premise base than the Delivery Point Address approach they used previously. In short, Ofcom have identified further eligible addresses, and if these are without availability but within a postcode in Connected Nations for 2018 then it is feasible for availability to drop. At the root, this seems to stem from the use of premise data by Ofcom but the lowest level of aggregation available publicly being at postcode level.
Econometric analysis methods in detail
A detailed description of the approach taken to the econometric analysis is presented below.
Matching approach
The analysis began with the selection of an appropriate comparator group. Initial discussions were held with BDUK where the research team presented potential comparator areas (based on connectivity and socio-economic indicators). BDUK provided the research team with feedback about which areas were appropriate to use as a comparator area, based on their knowledge of network provider roll out and government funding. The research team then identified a list of schools which were included in the RGC programme, but which were not expected to be connected to their enhanced network until 2021, a full year after the last LFFN schools had been connected. Following the identification of a suitable comparator area, a propensity score matching (PSM) matching approach was used to enhance the comparability between the treatment and comparator groups.
Matching model
Propensity scores were generated by applying a probit model that sought to explain the likelihood a given postcode was included in the LFFN Schools project. The results of the probit models associated with the matching models are set out in the table below.
Table A.3: Propensity Score Matching variable results for LFFN and RGC schools
| Variable | Mean | % bias | Reduction in bias | t-test | p>|t| | |||
|---|---|---|---|---|---|---|---|---|
| Treatment | Comparator | |||||||
| Superfast Broadband coverage 2018 | Unmatched Matched |
93.2 93.0 |
84.7 91.5 |
30.6 5.5 |
82.0 |
17.37 3.31 |
0 0.001 |
|
| Ultrafast Broadband coverage 2018 | Unmatched Matched |
26.7 20.7 |
4.1 23.2 |
67.7 -7.4 |
89.1 |
35.67 -3.15 |
0 0.002 |
|
| FTTP coverage 2018 | Unmatched Matched |
6.6 2.4 |
1.2 2.5 |
29.6 -0.4 |
98.6 |
15.58 -0.3 |
0 0.77 |
|
| Median download speed 2018 | Unmatched Matched |
31.8 31.7 |
30.7 29.7 |
5.9 10.6 |
-79.3 |
3.25 5.24 |
0.0001 0 |
|
| Median upload speed 2018 | Unmatched Matched |
5.2 5.5 |
6.4 4.8 |
-26.6 14.5 |
45.6 |
-14.85 8.3 |
0 0 |
|
| Average download speed 2018 | Unmatched Matched |
36.6 36.1 |
31.7 35.3 |
28.5 4.6 |
83.8 |
15.45 2.07 |
0 0.04 |
|
| Average data usage 2018 | Unmatched Matched |
229.5 225 |
186.2 219.2 |
28.8 3.8 |
86.7 |
15.96 2.16 |
0 0.03 |
|
| Residential delivery points | Unmatched Matched |
19.8 19.5 |
16.2 22.8 |
27.6 -25.2 |
8.6 |
15.12 -11.14 |
0 0 |
|
| Non-residential delivery points | Unmatched Matched |
1.0 0.7 |
0.5 0.6 |
20.5 4.3 |
78.9 |
10.9 2.6 |
0 0.009 |
|
| Distance from exchange | Unmatched Matched |
1323.2 1389.4 |
2163.4 1473.9 |
-69.9 -7.0 |
89.9 |
-39.98 -5.01 |
0 0 |
|
| Distance from cabinet | Unmatched Matched |
227.4 247.7 |
404.8 291.4 |
-29.0 -7.2 |
75.3 |
-17.01 -6.26 |
0 0 |
|
| Distance between cabinet and exchange | Unmatched Matched |
1267.2 1331.0 |
2010.9 1403.3 |
-64.3 -6.3 |
90.3 |
-36.7 -4.34 |
0 0 |
|
| Line length | Unmatched Matched |
2032.9 2142.5 |
3307.8 2286.4 |
-73.8 -8.3 |
88.7 |
-42.17 -5.67 |
0 0 |
|
| Exchange delivery points | Unmatched Matched |
17862.0 15308.0 |
4879.1 13916.0 |
151.6 16.2 |
89.3 |
81.25 9.23 |
0 0 |
|
| Cabinet delivery points | Unmatched Matched |
374.8 384.9 |
291.4 407.6 |
48.2 -13.1 |
72.8 |
26.44 -6.49 |
0 0 |
|
| Exchange only lines | Unmatched Matched |
1.3 1.1 |
1.7 0.8 |
-6.6 6.0 |
8.8 |
-3.64 3.89 |
0 0 |
|
| Virgin media coverage | Unmatched Matched |
0.2 0.1 |
0.0 0.2 |
55.9 -15.1 |
73.0 |
29.2 -6.05 |
0 0 |
|
| Population density | Unmatched Matched |
3399.3 2880.3 |
582.1 3262.4 |
137.1 -18.6 |
86.4 |
71.86 -8.6 |
0 0 |
|
| Premise density | Unmatched Matched |
2069.4 1707.9 |
329.9 2000.3 |
137.9 -23.2 |
83.2 |
72.25 -10 |
0 0 |
|
| Rural urban indicator | Unmatched Matched |
0.1 0.1 |
0.9 0.1 |
-257.3 -0.2 |
99.9 |
-142.25 -0.11 |
0 0.91 |
|
| Weekly wages | Unmatched Matched |
501.7 505.4 |
516.6 486.8 |
-30.1 37.5 |
-24.5 |
-17.01 23.69 |
0 0 |
Fixed effects modelling approach
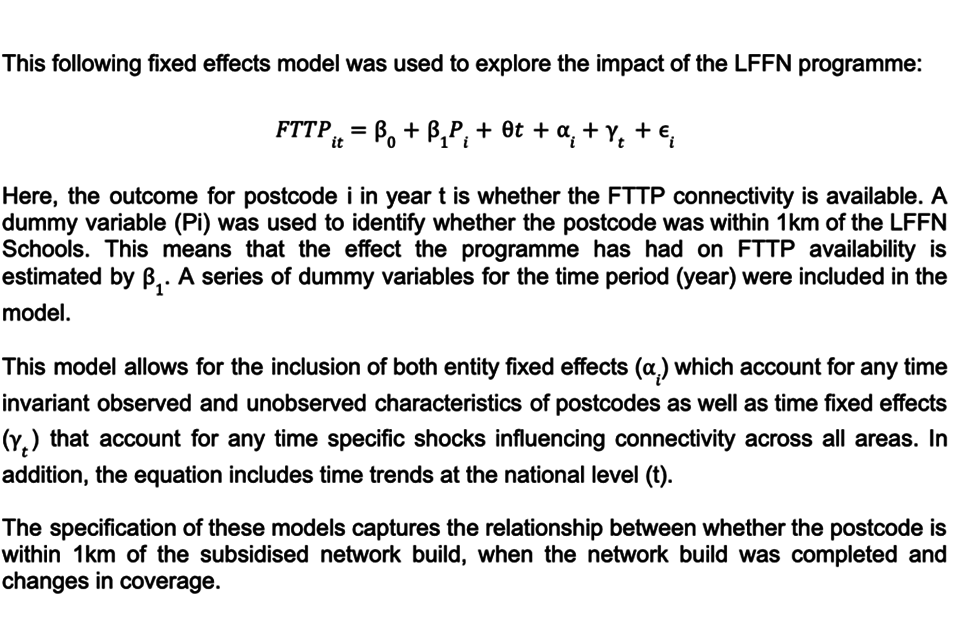
The fixed effects model in the image above explores the relationship between whether the postcode is within 1km of the subsidised network build, when the network build was completed and changes in coverage. Specifically, the model looks at whether FTTP availability is explained by the postcode being within 1km of the subsidised network build. To do this robustly, the model also controls for entity fixed effects which accounts for any time invariant observed, unobserved postcodes, time effects that account for any time specific shocks influencing connectivity across areas and time trends at a national level.
Model results
The table below presents the results from the econometric analysis described above. As presented in the main report, there are no significant results from the modelling exercise.
Table A.4: Results from the econometric analysis of connectivity outcomes for the LFFN Schools project
| Variable | Model 1: FTTP coverage | Model 2: Ultrafast coverage | Model 3: Median speed | |
|---|---|---|---|---|
| LFFN impact | -1.24 | 1.56 | -0.90 | |
| 2013 | - | - | 1.96*** | |
| 2014 | - | - | 5.04*** | |
| 2015 | - | - | 7.41*** | |
| 2016 | - | -0.41*** | 11.76*** | |
| 2017 | - | 10.29*** | 17.69*** | |
| 2018 | 2.31*** | 21.49*** | 21.81*** | |
| 2019 | 3.36*** | 23.78*** | 32.46*** | |
| 2020 | 12.12*** | 26.23*** | 40.22*** | |
| 2021 | 17.46*** | 30.79*** | 45.02*** | |
| Constant | 0.13 | 0.45 | 8.90*** | |
| Observations | 26,460 | 46,304 | 61,886 | |
| R squared | 0.10 | 0.23 | 0.62 | |
| Number of postcodes | 6,615 | 6,615 | 6,615 |
-
Should updated data for the latest school year be made available in time, the final report in October 2022 will incorporate findings from analysis using that data as well. ↩
-
There are some issues that require resolution with the data, as described in the preceding chapter. ↩
-
For further detail on the West Sussex Gigabit project Theory of Change and anticipated outcomes and impacts, see LFFN Wave 1 Evaluation Plan (May 2019). ↩
-
The expected outcomes and impacts were agreed with BDUK during the planning phase of the evaluation in 2019 following a series of consultations with BDUK and key stakeholders, review of project documentation, literature review and review of secondary data. ↩
-
In 2018 and 2019 this data is collected as a snapshot as of September of that year. ↩
-
The next stage of the evaluation will include interviews with network providers that will cover this point amongst others. ↩
-
The FFIB product is still available, but it was not clear the extent to which it had been used for other projects similar to LFFN. This will be explored in the next stage of the evaluation. ↩