Local authority performance update: Food Standards Agency September 2026 board meeting
Updated 15 September 2026
Applies to England, Northern Ireland and Wales

© Crown copyright 2026
This publication is licensed under the terms of the Open Government Licence v3.0 except where otherwise stated. To view this licence, visit nationalarchives.gov.uk/doc/open-government-licence/version/3 or write to the Information Policy Team, The National Archives, Kew, London TW9 4DU, or email: psi@nationalarchives.gov.uk.
Where we have identified any third party copyright information you will need to obtain permission from the copyright holders concerned.
This publication is available at https://www.gov.uk/government/publications/food-standards-agency-september-2026-board-meeting/local-authority-performance-update-food-standards-agency-september-2026-board-meeting
Report by Nathan Barnhouse
1. Summary
1.1 The paper updates the board on local authority (LA) performance in enforcing food law for the financial year 2025/26 and complements the regular reporting to the Business Committee. It also provides information and statistics on the delivery of animal Feed Official Controls, alongside rollout information regarding the Food Standards Delivery Model (FSDM) in England and Northern Ireland and the associated data collection and validation.
1.2 The Board is asked to consider and comment on:
- LA performance in the delivery of official food and feed controls in the past year
- LA resourcing levels alongside the FSA’s creation of resourcing tools and a new apprenticeship
- The rollout of the FSDM and the progress of the Local Authority Data Project
2. Introduction
2.1 LAs enforce compliance with food safety and standards legislation for most food businesses and must do so in accordance with the Food Law Codes of Practice (the Code). The same is true for animal feed safety and standards in England and Wales. The FSA has statutory duties to monitor and report on their performance.
2.2 At a national level, the statistics on delivery of interventions are generally improving, particularly in relation to lower-risk Food Hygiene premises. This evidences the hard work of LAs in re-aligning food services with the Code since the end of the COVID-19 recovery plan three years ago. However, large backlogs remain which require a significant investment and increase of LA officer time to clear.
3. Update on LA performance
Food hygiene intervention data
3.1 The pattern of delivery by LAs changes throughout the year. Similar to previous years, the percentage of interventions carried out at establishments fell from April 2025 into October, but all levels subsequently improved in April 2026.
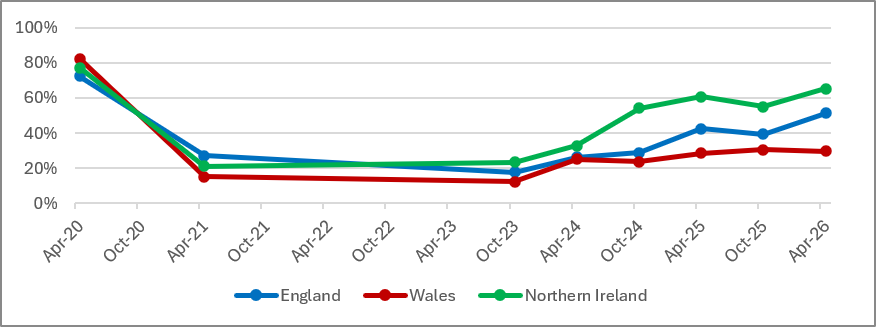
From April to April the most notable improvement continues to be seen in lower risk establishments (rated D & E) as LAs work to catch up on backlogs: annex 1. These figures have been reported in more detail to the FSA Business Committee.
3.2 The overall percentage of hygiene interventions carried out at establishments rated A to E has continued to increase across all three countries, from approximately 62% in April 2025 to 69% in April 2026. As expected, the largest improvements have been recorded in D and E-rated establishments, increasing nationally by 6 and 8 percentage points (ppts) respectively.
3.3 LAs continue to face pressure as a result of increasing levels of new business registrations which continue to rise year on year. Volumes of new registrations rose by 6.3% from 2023/24 to 2024/25 and have increased by a further 8.7% in 2025/26 to approximately 104,000.
This increase is most notable across England and Wales, whose volumes of new registrations increased by 9.0% and 9.2% respectively from 2024/25 to present, though Northern Ireland saw a 4.2% decrease across this same timeframe. This growth nationally is driven by both new business openings and frequent re-registrations resulting from changes in ownership.
3.4 Concurrently, volumes of unrated establishments have continued to decrease since their peak of 77,000 in April 2021, with the current volume being 36,000 unrated premises out of a total of 590,000 food establishments. This represents an approximate increase of 5,000 unrated premises compared to pre-Covid levels.
The overall number of food businesses has remained relatively static by comparison, generally seeing movement of no more than 1.3% year on year. While the current reduction in unrated establishments suggests progress in addressing inspection backlogs primarily in England and Wales, the remaining national volume still represents a significant level of unknown public health risk.
3.5 FHRS data trends show no evidence of a drop in establishment compliance charts 9 and 10. Though percentages vary across the three nations, namely 96.8% in England, 97.5% in Wales and 98.9% in Northern Ireland, national data indicates a steady level of establishments achieving a rating of ‘3 – generally satisfactory’ or better, which has remained at 97% for the last five years.
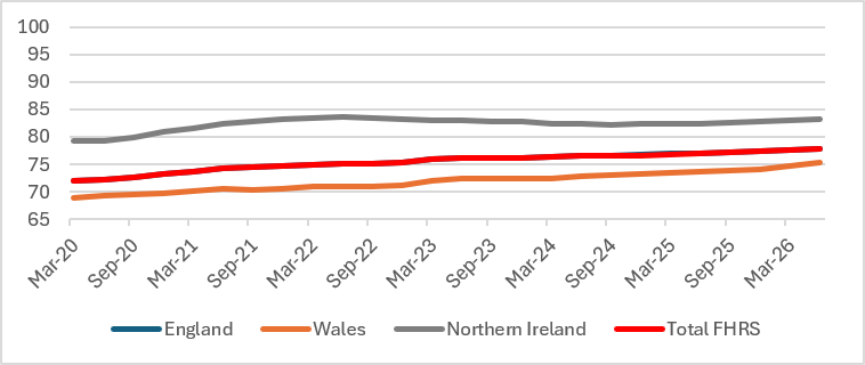
The overall proportion of rated establishments with the top rating of ‘5 – very good’ has increased consistently at a national level from 72% in March 2020 to 78%. Currently levels are 77.8% in England, 75.2% in Wales and 83.3% in Northern Ireland.
Food standards intervention data
3.6 This is the first year that local authorities are reporting their activities against the new food standards model, using a new reporting system in England and NI. Unfortunately, the FSA has encountered significant challenges in validating and amalgamating the different data sets from 151 LAs, and we are not yet in a position to provide performance data to the Board with any degree of confidence.
We will report this data later in the year to the business committee when we have sufficient confidence in the data we publish. As explained further in section 4, only data from Wales will be covered in this section.
3.7 The overall percentage of A-C interventions achieved across all establishment in Wales rose by 4ppts, from 39% in 2024/25 to 43% in 2025/26. Progress remains high in A-rated establishments (97%), indicating the risk-based approach LAs have adopted to delivery official controls. There was a minor decrease in interventions achieved in C-rated establishments, from 35% in 2024/25 to 34% in 2025/26.
3.8 New food standards business registrations in Wales, though fluctuating, increased to its highest volume in three years in 2025/26 (5,149), further increasing pressure on LAs to tackle backlogs. Though improvement was seen in relation to the proportion of businesses still unrated at the end of the financial year (decreasing by 0.4ppts to 10.6% from 2024/25 to 2025/26) this improvement is marginal and suggests LAs may continue to report high levels of unrated premises for the foreseeable future.
Resources
3.9 All three countries reported an increase in their occupied full time equivalent (FTE) resource for food hygiene from 2024/25 to present, increasing by 5.7% nationally. Allocated resources saw a similar 4.2% increase nationally, though Northern Ireland saw a minor drop of 2.6% (equating to 1 FTE). The variations in each country can be seen in tables 4 and 5.
3.10 Wales recorded increases in both allocated and occupied FTE resource for food standards, though both representing less than 1 FTE. Despite the increase remaining minor, the improvements to interventions achieved across A-C risk rated establishments may suggest that even small increases can cause notable improvements, or reflect increased staff competence and experience.
3.11 Resources data collected for England and Northern Ireland during the April 2026 period may be subject to change in future as further data accuracy checks are carried out.
LAs in Northern Ireland report a decrease in both their occupied and allocated resources of 4 and 2 FTE respectively since April 2025. England, however, have reported increases of 62 and 69 FTE respectively (representing increases of 26 and 25%). It is currently unclear whether these increases are due to, possibly in combination, data accuracy concerns, arising from the adoption of the new reporting process, improved recording of Standards resources or legitimate increases.
Early investigations suggest many of these increases are genuine but further interrogation of the data is required before the next reporting period.
3.12 The board has previously asked us to develop tools to help local authorities forecast the resource they need to deliver their food official controls.
Those tools have now been delivered for food hygiene, food standards and combined food hygiene and standards services. The final combined hygiene and standards tool was published on FSA Link in June 2026, completing the suite of tools available to LAs in England, Wales and Northern Ireland.
Use of the tool is voluntary but gives LAs a consistent way to estimate the staff they need to deliver their services in line with the Code. They can support service planning, local business cases and wider discussions about workforce capacity.
3.13 Feedback from local authorities has been positive. There is early evidence that the tools are already helping some authorities make the case for additional staff and apprentices. Development and delivery of the tools has involved close collaboration across RCD, Wales, Northern Ireland, SERD and LA partners.
3.14 The FSA recently introduced new flexibilities in England and Wales through the Food Law Code of Practice for food hygiene checks, making changes to who can conduct inspections at lower-risk businesses. The main advantage of the new flexibilities is that they allow local authorities to focus their most highly qualified officers on the businesses that pose the greatest risk to public health, while still maintaining oversight of lower-risk businesses. The changes were designed to support a more risk-based and sustainable delivery model, particularly given ongoing workforce and capacity pressures.
3.15 We have now formally recognised the new CTSI Professional Competency in Food qualification in England and Wales. We are working closely with the CIEH, training providers and LAs to develop a new food hygiene Level 4 apprenticeship – Regulatory Compliance Officer in food. This is an entry level apprenticeship that will be an ideal step for those entering the food profession. We hope the apprenticeship will be launched later this year.
The qualifications aim to provide more routes into the profession and help LAs recruit the workforces needed to deliver their services. This follows on from May 2023 when the FSA recognised the level 6 trading standards professional apprenticeship as a new entry route for officers to carry out food standards and feed work.
The apprenticeship was later listed in the 2025 Food Law Codes of Practice as a suitable qualification for official food controls. The apprenticeship has proved popular with over 126 apprentices signing up for the food and feed modules.
Feed delivery and data
3.16 In England and Wales, feed official controls are delivered by LAs. This is funded directly by the FSA in England and through a ring-fenced budget in Wales. Delivery is co-ordinated by National Trading Standards in England and by the FSA in Wales through the Feed Governance Group in Wales. Feed controls in Northern Ireland are delivered by the Department of Agriculture, Environment and Rural Affairs (DAERA).
3.17 Table 6 in annex 3 provides the number of establishments with planned and completed official controls in England and Wales over the last three years. The planned programme takes account of the formal arrangements for earned recognition allowed for in the Feed Law Code of Practice.
3.18 In 2025-26, English and Welsh LAs fully delivered 96.1% of planned interventions. In addition to this, LAs took 613 feed samples for analysis and checked 469 consignments of imported feed.
Complaints data, enforcement actions and sampling on food hygiene
3.19 LAs reported a 5.0% increase in the number of complaints received about food and the hygiene of premises from 2024/25 to 2025/26, with the current national total of over 64,000 representing the highest yearly volume since 2021/22.
Similarly, the number of formal enforcement actions reported for food hygiene has also continued to rise, representing a 1.6% increase on 2024/25 and the highest yearly volume in over ten years. Anecdotal evidence from LAs suggests increases in enforcement activity have been recently driven in many cases by poor compliance, illegal imported foods and pest infestations, with resource pressures remaining a major factor leading to more frequent diverting of officers from routine inspection programmes.
3.20 Sampling is an integral part of the food safety system and utilised effectively, reduces risk to consumers. Despite food hygiene sampling seeing a notable national drop of 14% from 2023/24 to 2024/25, and remaining below pre-pandemic levels, volumes have since recovered by 1.9% in the current financial year.
Multiple LAs have confirmed the decrease in sampling is the result of both a lack of resources and conflicting priorities. The most recent LA food hygiene data return recorded 47 LAs taking 0 samples, all in England (compared to 65 in April 2025). In relation to food standards 3 Welsh authorities reported taking 0 samples, one more than the previous April. Notably, NI continues to demonstrate consistently high sampling rates concerning zoonoses/zoonotic agents and chemical sampling as part of the requirements for a chemical control plan.
3.21 In 2025/26 54 LAs in England and 10 LAs in Wales were funded by the FSA to participate in the directed sampling programme. This focusses on compliance of food products linked to the national food standards priorities. Other FSA funded sampling programmes have been undertaken to support LAs.(Footnote 1)
3.22 The FSA will shortly be writing to the LAs in England to remind them of the need to include funding to support appropriate sampling in future service planning activities. LA engagement in Wales is already in place through existing sampling networks. The FSA are looking at how we might adjust our performance management approach to increase focus on sampling in the future when more detailed sampling data becomes available. .
4. Food Standards Delivery Model implementation
4.1 The new FSDM enables local authorities to make risk-based and intelligence-driven decisions on where resources are needed most, prioritising controls on non-compliant businesses that present the greatest risk to consumers. The most recent set of data on food standards delivery is the first to comprehensively reflect LA activities in line with the new model. This indicates that of the 154 LAs across England and NI responsible for food standards, 88% have been able to submit a return demonstrating that they are carrying out their food standards interventions in line with the new approach.
This includes all 11 District Councils (DC) in NI. The remaining 12% of LAs have either been unable to provide the appropriate performance return, or provided a return based upon the previous model. Our Performance Management team are in engaged in discussions with these LAs to understand the barriers to transition, and those who are yet to provide suitable levels of assurance are being escalated through our performance framework.
4.2 In Wales, transition to the new model commenced in October 2025. Currently 10 LAs have moved across to the new model with 12 expected to have transitioned by the end of September. We are working with the MIS providers to support all 22 LAs being onboarded by the end of the transition period in October 2026. Reporting will commence for those already transitioned in April 2027.
5. Local authority data project
5.1 The FSA has a statutory responsibility to monitor and report on the performance of enforcement authorities in delivering official controls. The FSA historically collected establishment-level data from local authorities once a year to do this.
During the pandemic, we moved to high level biannual surveys which were less resource intensive for local authorities but provided much less granular data. Over the past few years, with the support of the Board, we have been trying to develop a new approach to data collection which provides more granular data in a timely way while minimising the reporting burden on local authorities.
5.2 The Local Authority Data Project (LADP) introduces this new approach. The first phase of this project focusses on food standards data as LAs migrate to the new FSDM. The new data collection method focusses on capturing more detailed establishment level data, which will provide assurance that official controls are being delivered in a timely manner and enable us to evaluate the effectiveness of the new FSDM.
The success of the data project relies on LAs providing the FSA with high-quality data that has passed our quality assurance checks. As with any new system, there will be some initial work for both FSA and LAs as they navigate the system, but in the longer term it should be a more efficient process for both than the FSA legacy systems.
5.3 With this being the first year that local authorities are reporting the activities against the new model through the new reporting system, the FSA has encountered significant challenges in implementing its validation process.
There has been a combination of problems. 38% of LAs were unable to submit an establishment level return and have had to continue providing an aggregate survey submission, either because they have not migrated fully to the new FSDM, because they are still experiencing difficulties with their MIS systems or because they have identified problems with the quality of their own data.
62%, including 10 of the 11 LAs in NI, did submit an establishment-level return to us, but almost all of those failed our initial automated validation process. Problems include file formats which are not supported by our online submission portal, missing fields, incorrect dates for last inspections (such as automatically set to the date of migration to the new model) and many others. We are now working with individual LAs to address these data issues.
5.4 The scale of the problems, which are significantly greater than we anticipated, have made it impossible for us to provide the Board with accurate data on overall local authority performance in this report.
We apologise to the Board for this situation. Although the problems with data quality are not of our making, we are reflecting on whether there is more we could have done to anticipate these problems and been more proactive in our approach to working with LA to address these quality issues. Sufficed to say we need to have a programme of work in place to try to resolve them for the future.
We will work intensively with LAs and MIS providers to address these data problems and will do as much as we can to ensure that all LAs fully transition to the new FSDM and have all required MIS updates applied as soon as possible.
6. Update on performance monitoring of local authorities
6.1 Following each biannual data return, LA performance is assessed against the delivery of Official Controls and the management of new business registrations. Authorities giving rise to significant concern are allocated to Performance Management officers for further review and, where necessary, formal engagement.
6.2 There are currently 101 live Performance Management (PM) cases across local authorities in England: 83 relating to Food Hygiene (FH) and 18 relating to Food Standards (FS). Of these, 15 authorities are subject to formal escalation, comprising 12 FH cases and 3 FS cases.
Following the April 2026 data return, 24 new FH cases were opened. Since then, 10 have been closed, either because the authority has returned to full delivery of Official Controls or because it has implemented robust recovery plans, providing confidence that compliance will be restored. No LAs are under performance management in Wales or Northern Ireland.
6.3 Although the full Food Standards dataset is not yet available, the local authorities currently under Performance Management rose due to concerns regarding their transition to the FSDM. This number is expected to increase as further data becomes available.
7. Conclusions
7.1 Food hygiene data shows that LAs continue to make progress in returning to the requirements of the Code, with rates of interventions achieved at A to C-rated establishments increasing to or approaching pre-Covid levels, alongside vast improvements in D and E-rated establishments.
However, there is still a notable difference between pre-Covid and current performance in these lower-rated establishments, particularly in England and Wales.
7.2 Similarly to hygiene, Wales saw increases in their A and B-rated achieved intervention rates which in the case of A-rated premises now exceed pre-Covid levels. However, interventions achieved at C-rated premises did decrease slightly. This coincides with increased rates of business registrations which continue to put pressure on services.
7.3 Despite rates of achieved interventions at lower-risk establishment remaining below pre-Covid levels, FHRS data which is used as an indication of business compliance remains consistently high. Rates of ‘3 – generally satisfactory’ scores have remained at 97% for the last five years whilst ratings of ‘5’, the highest rating, have increased to their highest rates to date.
7.4 Gradual increases in occupied FH resources are beginning to translate into improved performance, as occupied FTE resource improves alongside achieved intervention figures. Though it will take time before the full benefits are reflected in intervention backlog improvements and service resilience, the increases in resource appear to be a key contributing factor.
The rate at which LAs return to pre-Covid performance levels is likely contributed to by increased volumes of new registrations, which continue to put pressure on services and delay existing intervention programmes. Considering this, the hard work of LAs should be commended as volumes of unrated businesses have reached their lowest levels since pre-Covid. In relation to FS resources, early indications suggest notable increases, but further interrogation of submitted data is required.
7.5 The implementation of the FSDM is progressing well with a vast majority of LAs having transitioned successfully. This indicates strong LA engagement with the reforms and suggests that the majority of authorities are moving towards a more intelligence-led and risk-based approach to food standards regulation.
Whilst adoption rates are high, full implementation has not yet been achieved across all authorities in England. Ongoing engagement by the FSA will be necessary to support the remaining authorities and to help ensure consistent application of the new model nationally.
7.6 The move from aggregate survey returns to establishment-level data should substantially improve the quality and granularity of regulatory intelligence available to the FSA. We have operational challenges to overcome with this data reporting, and the FSA will continue to work with LAs and MIS providers to ensure successful implementation of the FSDM can be reported on.
7.7 The level of sampling carried out in some LAs remains a concern, and we need to do more to communicate clear expectations to LAs around sampling policies, programmes, and service planning. At this stage, we recommend keeping performance management focused on the delivery of interventions, but we will consider how performance management could support a greater focus on sampling in the future.
Once enhanced sampling data becomes available through the Local Authority Data Project, the FSA will be better placed to assess performance and consider whether further action is justified.
7.8 The board is asked to:
- consider LA performance in the delivery of official food and feed controls in the past year.
- consider LA resourcing levels alongside the FSA’s creation of resourcing tools and a new apprenticeship
- note the update on the rollout of the FSDM and the progress of the Local Authority Data Project
Annex 1
Charts 1 to 5: food hygiene
Chart 1: percentage of food hygiene A-rated interventions carried out April 2020 to April 2026
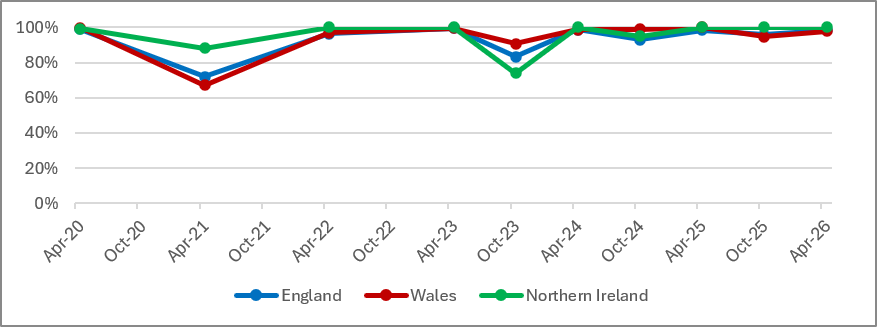
Chart 2: percentage of food hygiene B-rated interventions carried out April 2020 to April 2026
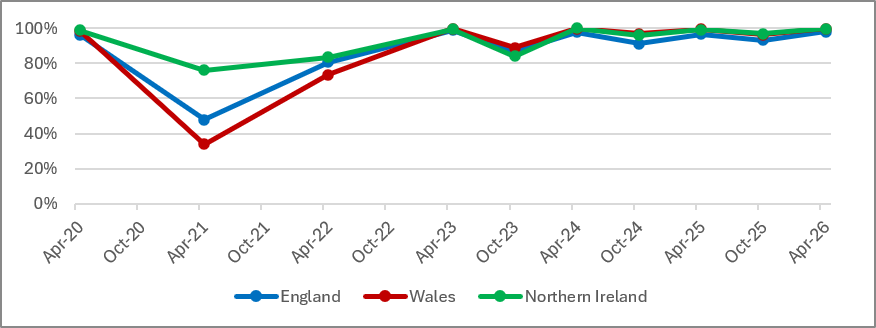
Chart 3: percentage of food hygiene C-rated interventions carried out April 2020 to April 2026
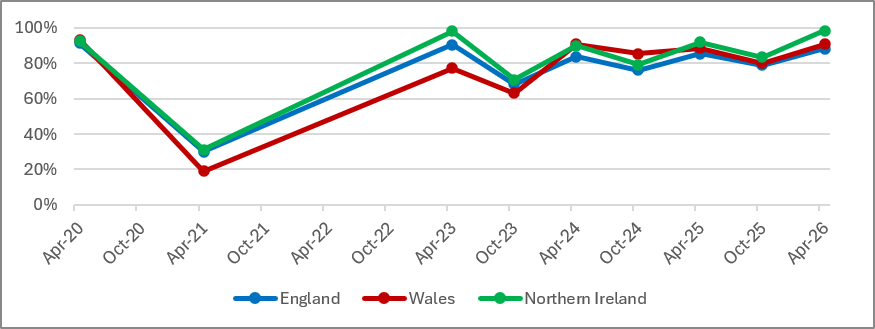
Chart 4: percentage of food hygiene D-rated interventions carried out April 2020 to April 2026
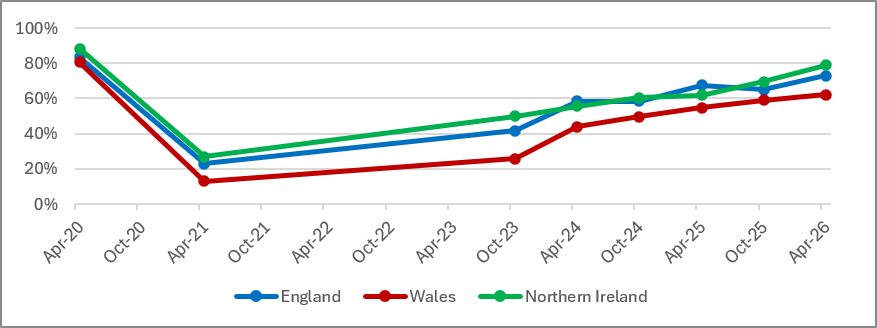
Chart 5: percentage of food hygiene E-rated interventions carried out April 2020 to April 2026
Charts 6 to 8: food standards*
- Local Authorities in England and Northern Ireland were exempt from submitting A-C risk rated premises interventions for food standards from October 2025 as they transitioned to the new FSDM
Chart 6: Percentage of food standards A-rated interventions carried out April 2020 to April 2026
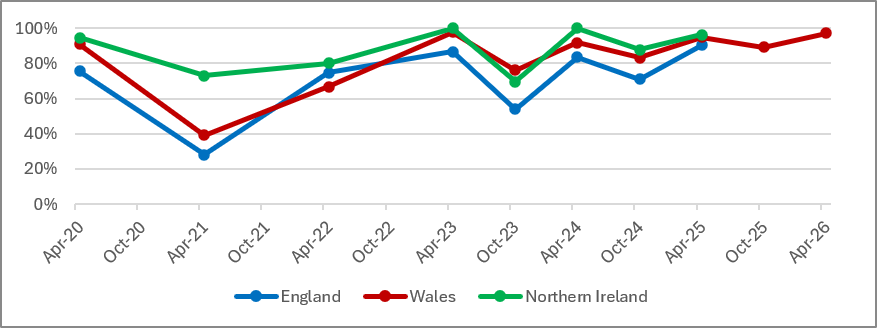
Chart 7: Percentage of food standards B-rated interventions carried out April 2020 to April 2026
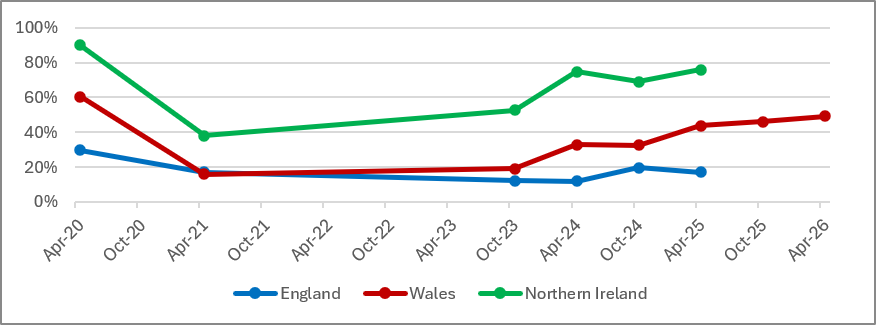
Chart 8: Percentage of food standards C-rated interventions carried out April 2020 to April 2026
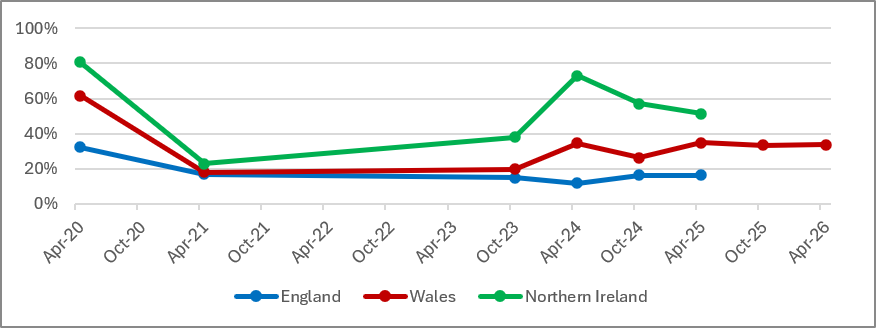
Table 1: Proportion of outstanding interventions and volume of outstanding interventions at the end of the reporting period*
Percentage of outstanding interventions (and volume of outstanding interventions)
| April 2020 | A | B | C | D | E | Total |
|---|---|---|---|---|---|---|
| England | 1.1% (62) | 3.7% (1,075) | 8.7% (6,463) | 16.5% (17,055) | 27.6% (17,581) | 15.3% (42,236) |
| Wales | 0.3% (2) | 1.5% (41) | 6.8% (804) | 19.5% (764) | 17.8% (728) | 10.1% (2,339) |
| NI | 0.8% (1) | 1.3% (17) | 7.5% (373) | 11.9% (685) | 22.9% (730) | 11.8% (1,806) |
| Total | 1% (65) | 3.4% (1,133) | 8.4% (7,640) | 16.4% (18,504) | 26.8% (19,039) | 14.7% (46,381) |
| Total A to C | 1% (65) | 3.4% (1,133) | 8.4% (7,640) | 6.8% (8,838) | ||
| April 2023 | A | B | C | D* | E* | Total |
| England | 0.6% (17) | 1.1% (191) | 9.4% (5,523) | |||
| Wales | 0.4% (1) | 0.2% (3) | 22.9% (2,254) | |||
| NI | 0% (0) | 0.5% (6) | 2% (74) | |||
| Total A to C | 0.5% (18) | 1% (200) | 10.9% (7,851) | 8.4% (8,069) | ||
| April 2024 | A | B | C | D | E | Total |
| England | 1.3% (15) | 2.3% (212) | 16.2% (4,723) | 41.6% (31,210) | 73.8% (54,635) | 48.1% (90,795) |
| Wales | 1.3% (1) | 0.4% (3) | 9.2% (343) | 56.1% (1,720) | 74.9% (4,929) | 49.5% (6,996) |
| NI | 0% (0) | 0% (0) | 10% (127) | 44.4% (997) | 67.4% (1,969) | 45.6% (3,093) |
| Total | 1.3% (16) | 2.1% (215) | 15.2% (5,193) | 42.3% (33,927) | 73.6% (61,533) | 48.1% (100,884) |
| Total A to C | 1.3% (16) | 2.1% (215) | 15.2% (5,193) | 11.9% (5,424) | ||
| April 2025 | A | B | C | D | E | Total |
| England | 1.5% (17) | 3.5% (323) | 14.5% (4,504) | 32.6% (20,609) | 57.6% (40,310) | 37.7% (65,763) |
| Wales | 0% (0) | 0.7% (5) | 11.5% (467) | 45.4% (1,085) | 71.4% (3,870) | 43% (5,427) |
| NI | 0% (0) | 0.9% (3) | 8.1% (82) | 38.1% (863) | 39.4% (919) | 31.3% (1,867) |
| Total | 1.4% (17) | 3.2% (331) | 14% (5,053) | 33.2% (22,557) | 58% (45,099) | 37.8% (73,057) |
| Total A to C | 1.4% (17) | 3.2% (331) | 14% (5,053) | 11.3% (5,401) | ||
| April 2026 | A | B | C | D | E | Total |
| England | 1.8% (22) | 2% (183) | 11.8% (3,525) | 27.2% (17,274) | 48.8% (28,912) | 30.6% (49,916) |
| Wales | 2.1% (1) | 0.3% (2) | 9.2% (401) | 37.9% (854) | 70.4% (3,682) | 39.2% (4,940) |
| NI | 0% (0) | 0.3% (1) | 1.7% (20) | 21.2% (436) | 34.8% (707) | 20.8% (1,164) |
| Total | 1.8% (23) | 1.8% (186) | 11.2% (3,946) | 27.3% (18,564) | 50.1% (33,301) | 30.9% (56,020) |
| Total A to C | 1.8% (23) | 1.8% (186) | 11.2% (3,946) | 8.9% (4,155) |
*There was no expectation for interventions to be carried out at all D and E-rated establishments in the COVID Recovery Plan. Data was not collected.
Table 2: Due food standards interventions outstanding at the end of the reporting period*
- Local Authorities in England and Northern Ireland were exempt from submitting A-C risk rated premises interventions for food standards from October 2025 as they transitioned to the new FSDM
Percentage of outstanding interventions (and volume of outstanding interventions)
| April 2020 | A | B | C | Total |
|---|---|---|---|---|
| England | 24.3% (911) | 29.7% (68,976) | 32.4% (62,814) | 30.9% (132,701) |
| Wales | 9.2% (35) | 60.3% (2,265) | 61.5% (2,055) | 59.2% (4,355) |
| NI | 5.3% (13) | 89.9% (203) | 80.6% (1,435) | 80.6% (1,651) |
| Total | 21.9% (959) | 32.5% (71,444) | 37.3% (66,304) | 34.6% (138,707) |
| Total A | 21.9% (959) | 21.9% (959) | ||
| April 2023 | A | B* | C* | Total |
| England | 13.6% (542) | 13.6% (542) | ||
| Wales | 2.4% (6) | 2.4% (6) | ||
| NI | 0% (0) | 0% (0) | ||
| Total A | 12.3% (548) | 12.3% (548) | ||
| April 2024 | A | B* | C* | Total |
| England | 16.6% (288) | 88.2% (59,121) | 88.3% (71,398) | 87.4% (130,807) |
| Wales | 8.2% (11) | 67.3% (2,986) | 65.4% (3,791) | 65.5% (6,788) |
| NI | 0% (0) | 25.3% (139) | 27% (1,040) | 26.5% (1,179) |
| Total | 15.6% (299) | 86.4% (62,246) | 84.2% (76,229) | 84.4% (138,774) |
| Total A | 15.6% (299) | 15.6% (299) | ||
| April 2025 | A | B | C | Total |
| England | 9.8% (127) | 82.9% (56,776) | 83.8% (65,506) | 82.7% (122,409) |
| Wales | 5.3% (7) | 56.1% (2,065) | 65.3% (3,492) | 60.7% (5,564) |
| NI | 3.8% (3) | 24.1% (149) | 48.5% (833) | 40.8% (985) |
| Total | 9% (137) | 81% (58,990) | 81.9% (69,831) | 80.8% (128,958) |
| Total A | 9% (137) | 9% (137) | ||
| April 2026 | A | B | C | Total |
| Wales | 2.8% (4) | 50.7% (1,673) | 66.4% (2,021) | 57% (3,698) |
*There was no expectation for interventions to be carried out at all B and C-rated establishments in the COVID Recovery Plan. Data was not collected.
Table 3: The number of unrated registrations in each country (food hygiene data)
| England | Wales | NI | Total | |
|---|---|---|---|---|
| Apr-20 | 29,021 | 1,388 | 559 | 30,968 |
| Apr-21 | 70,635 | 5,102 | 1,299 | 77,036 |
| Apr-22 | 47,068 | 3,308 | 737 | 51,113 |
| Jul-22 | 45,406 | 2,902 | 549 | 48,857 |
| Oct-22 | 40,344 | 2,602 | 459 | 43,405 |
| Jan-23 | 36,732 | 2,295 | 505 | 39,532 |
| Apr-23 | 36,595 | 2,352 | 510 | 39,454 |
| Oct-23 | 39,070 | 2,263 | 679 | 42,012 |
| Apr-24 | 39,007 | 1,746 | 430 | 41,183 |
| Oct-24 | 40,162 | 1,880 | 412 | 42,454 |
| Apr-25 | 36,712 | 1,765 | 297 | 38,774 |
| Oct-25 | 37,427 | 1,856 | 354 | 39,637 |
| Oct-25 | 37,427 | 1,856 | 354 | 39,637 |
| Apr-26 | 34,117 | 1,803 | 137 | 36,057 |
Chart 9: percentage of FHRS ratings 3 or above for each country from March 2020 to now
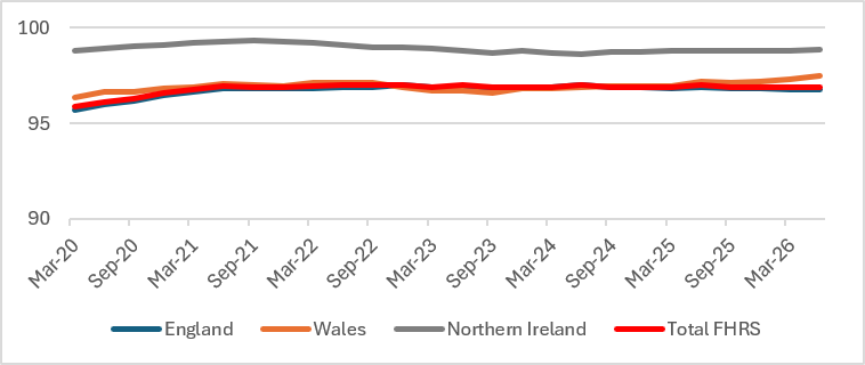
Chart 10: percentage of FHRS rating 5 for each country from March 2020 to now
Annex 2
Chart 11: food hygiene FTE professional posts occupied and available to undertake official food controls April 2020 to April 2026
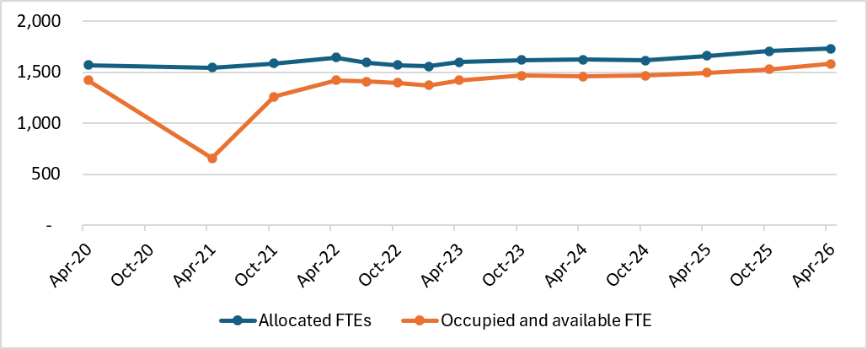
Chart 12: food standards FTE professional posts occupied and available to undertake official food controls April 2020 to April 2026*
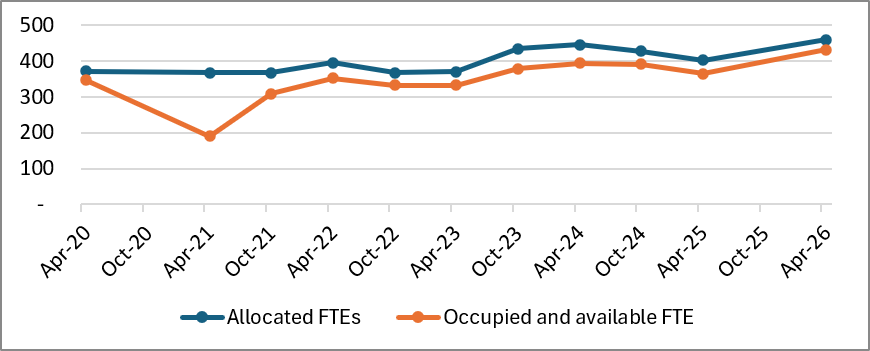
- October 2025 returns data omitted from this graphic as only data from Wales was collected during this period
Table 4: FTE resources April 2025 and 2026 for three countries: food hygiene
| Country | FTE Allocated | FTE Occupied and available | |
|---|---|---|---|
| April 2025 | England | 1,429 | 1,288 |
| Wales | 164 | 152 | |
| Northern Ireland | 65 | 57 | |
| Total | 1,659 | 1,496 | |
| April 2026 | England | 1,500 | 1,366 |
| Wales | 165 | 156 | |
| Northern Ireland | 64 | 59 | |
| Total | 1,729 | 1,582 |
Table 5: FTE resources April 2025 and 2026 for three countries: food standards
| Country | FTE Allocated | FTE Occupied and available | |
|---|---|---|---|
| April 2025 | England | 300 | 273 |
| Wales | 69 | 62 | |
| Northern Ireland | 32 | 29 | |
| Total | 402 | 365 | |
| April 2026 | England* | 362 | 342 |
| Wales | 70 | 63 | |
| Northern Ireland | 28 | 27 | |
| Total | 460 | 432 |
- Data collected in England in April 2026 incudes 120 local authorities, compared to the 128 returns collected in April 2025
Annex 3
Table 6: planned and completed feed official controls in England and Wales
| England & Wales planned and completed official controls | Country | Number of establishments 2025-26 | 2023-24 planned | 2023-24 completed | 2023-24 % | 2024-25 planned | 2024-25 Completed | 2024-25 % | 2025-26 planned | 2025-26 Completed | 2025-26 % |
|---|---|---|---|---|---|---|---|---|---|---|---|
| Feed Manufacturer | England | 601 | 177 | 181 | 102.3 | 185 | 184 | 99.5 | 172 | 164 | 95.3 |
| Wales | 32 | 16 | 23 | 143.8 | 18 | 15 | 83.3 | 16 | 13 | 81.3 | |
| Pet Food Manufacturer | England | 929 | 322 | 320 | 99.4 | 340 | 337 | 99.1 | 320 | 278 | 86.9 |
| Wales | 52 | 18 | 20 | 111.1 | 20 | 30 | 150.0 | 18 | 14 | 77.8 | |
| Mobile Mixer | England | 28 | 10 | 11 | 110.0 | 14 | 13 | 92.9 | 8 | 5 | 62.5 |
| Wales | 14 | 5 | 7 | 140.0 | 2 | 5 | 250.0 | 2 | 1 | 50.0 | |
| Importers | England | 141 | 32 | 31 | 96.9 | 35 | 32 | 91.4 | 39 | 27 | 69.2 |
| Wales | 2 | 1 | 4 | 400.0 | 1 | 1 | 100.0 | 1 | 1 | 100.0 | |
| Co Product Producer | England | 1,256 | 380 | 356 | 93.7 | 397 | 368 | 92.7 | 351 | 320 | 91.2 |
| Wales | 84 | 31 | 24 | 76.9 | 20 | 16 | 80.0 | 31 | 28 | 90.3 | |
| Stores | England | 855 | 85 | 88 | 103.5 | 81 | 80 | 98.8 | 84 | 77 | 91.7 |
| Wales | 16 | 10 | 4 | 40.0 | 4 | 4 | 100.0 | 8 | 5 | 62.5 | |
| Transporter | England | 1,617 | 142 | 148 | 104.2 | 119 | 108 | 90.8 | 119 | 133 | 111.8 |
| Wales | 59 | 13 | 10 | 76.9 | 6 | 4 | 66.7 | 17 | 5 | 29.4 | |
| Supplier of feed materials / Surplus Food | England | 5,693 | 696 | 665 | 95.5 | 767 | 787 | 102.6 | 728 | 728 | 100.0 |
| Wales | 275 | 81 | 101 | 124.7 | 75 | 72 | 96.0 | 69 | 58 | 84.1 | |
| On Farm Mixer | England | 9,564 | 624 | 638 | 102.2 | 566 | 569 | 100.5 | 584 | 614 | 105.1 |
| Wales | 1,016 | 111 | 148 | 133.3 | 67 | 63 | 94.0 | 67 | 69 | 103.0 | |
| Distributor | England | 1,886 | 225 | 223 | 99.1 | 299 | 302 | 101.0 | 247 | 260 | 105.3 |
| Wales | 195 | 56 | 53 | 94.6 | 42 | 38 | 90.5 | 27 | 29 | 107.4 | |
| Livestock Farms | England | 90,309 | 853 | 872 | 102.2 | 971 | 1009 | 103.9 | 1077 | 1019 | 94.6 |
| Wales | 15,189 | 1,310 | 1,633 | 124.7 | 1,233 | 1,256 | 101.9 | 1269 | 1227 | 96.7 | |
| Arable Farms | England | 11,907 | 284 | 256 | 90.1 | 230 | 228 | 99.1 | 96 | 80 | 83.3 |
| Wales | 87 | 17 | 16 | 94.1 | 20 | 17 | 85.0 | 19 | 4 | 21.1 | |
| TOTAL | England | 124,786 | 3,830 | 3,789 | 98.9 | 4,004 | 4,017 | 100.3 | 3825 | 3705 | 96.9 |
| Wales | 17,021 | 1,669 | 2,043 | 122.4 | 1,508 | 1,521 | 100.9 | 1544 | 1454 | 94.2 |
*establishment types broadly listed in descending order of inherent risk
NB. Where more controls have been completed than planned, this can be the result of varying factors, such as the identification and inspection of new businesses and those that have ceased trading being recorded as such
Footnote 1 Please see Annual FSA Science Update paper